Cities with the Highest Percentage of Immigrants from Italy in Massachusetts
RELATED REPORTS & OPTIONS
Italy
Massachusetts
Compare Cities
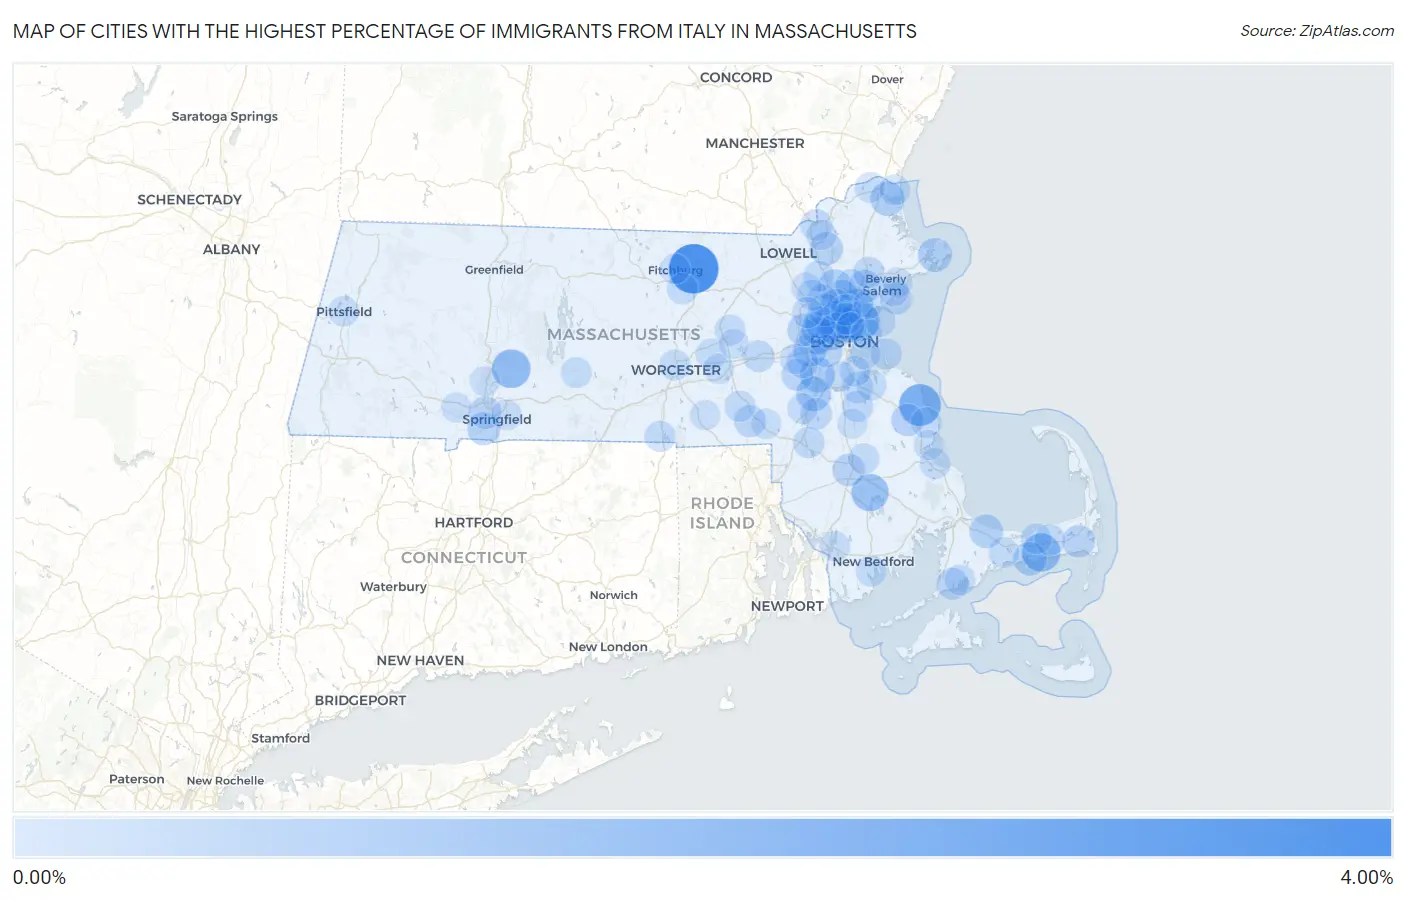
Map of Cities with the Highest Percentage of Immigrants from Italy in Massachusetts
0.00%
4.00%
Cities with the Highest Percentage of Immigrants from Italy in Massachusetts
| City | Italy | vs State | vs National | |
| 1. | Lunenburg | 3.91% | 0.24%(+3.67)#1 | 0.095%(+3.81)#36 |
| 2. | Marshfield Hills | 2.32% | 0.24%(+2.08)#2 | 0.095%(+2.22)#90 |
| 3. | Revere | 1.80% | 0.24%(+1.56)#3 | 0.095%(+1.70)#148 |
| 4. | Granby | 1.70% | 0.24%(+1.46)#4 | 0.095%(+1.61)#162 |
| 5. | South Yarmouth | 1.65% | 0.24%(+1.41)#5 | 0.095%(+1.56)#167 |
| 6. | North Lakeville | 1.43% | 0.24%(+1.19)#6 | 0.095%(+1.34)#202 |
| 7. | Medford | 1.41% | 0.24%(+1.17)#7 | 0.095%(+1.31)#208 |
| 8. | Watertown Town | 1.18% | 0.24%(+0.938)#8 | 0.095%(+1.09)#269 |
| 9. | Everett | 1.14% | 0.24%(+0.902)#9 | 0.095%(+1.05)#276 |
| 10. | Dedham | 0.97% | 0.24%(+0.724)#10 | 0.095%(+0.872)#357 |
| 11. | Norwood | 0.96% | 0.24%(+0.722)#11 | 0.095%(+0.869)#360 |
| 12. | Saugus | 0.96% | 0.24%(+0.721)#12 | 0.095%(+0.868)#362 |
| 13. | Newburyport | 0.86% | 0.24%(+0.614)#13 | 0.095%(+0.761)#418 |
| 14. | Gloucester | 0.76% | 0.24%(+0.523)#14 | 0.095%(+0.670)#485 |
| 15. | Reading | 0.74% | 0.24%(+0.502)#15 | 0.095%(+0.649)#503 |
| 16. | West Yarmouth | 0.72% | 0.24%(+0.480)#16 | 0.095%(+0.627)#534 |
| 17. | East Sandwich | 0.71% | 0.24%(+0.471)#17 | 0.095%(+0.618)#540 |
| 18. | Andover | 0.68% | 0.24%(+0.438)#18 | 0.095%(+0.585)#577 |
| 19. | Newton | 0.64% | 0.24%(+0.400)#19 | 0.095%(+0.548)#619 |
| 20. | Cambridge | 0.59% | 0.24%(+0.349)#20 | 0.095%(+0.496)#674 |
| 21. | Agawam Town | 0.58% | 0.24%(+0.342)#21 | 0.095%(+0.489)#678 |
| 22. | Peabody | 0.58% | 0.24%(+0.338)#22 | 0.095%(+0.485)#684 |
| 23. | Waltham | 0.56% | 0.24%(+0.321)#23 | 0.095%(+0.468)#704 |
| 24. | Wakefield | 0.55% | 0.24%(+0.313)#24 | 0.095%(+0.460)#718 |
| 25. | Belmont | 0.55% | 0.24%(+0.306)#25 | 0.095%(+0.454)#732 |
| 26. | West Springfield Town | 0.55% | 0.24%(+0.304)#26 | 0.095%(+0.451)#734 |
| 27. | Raynham Center | 0.53% | 0.24%(+0.290)#27 | 0.095%(+0.438)#752 |
| 28. | East Harwich | 0.53% | 0.24%(+0.285)#28 | 0.095%(+0.432)#759 |
| 29. | Brookline | 0.52% | 0.24%(+0.280)#29 | 0.095%(+0.427)#768 |
| 30. | North Pembroke | 0.51% | 0.24%(+0.264)#30 | 0.095%(+0.411)#799 |
| 31. | Winchester | 0.50% | 0.24%(+0.254)#31 | 0.095%(+0.401)#812 |
| 32. | Somerville | 0.46% | 0.24%(+0.223)#32 | 0.095%(+0.370)#871 |
| 33. | Stoneham | 0.43% | 0.24%(+0.189)#33 | 0.095%(+0.336)#932 |
| 34. | Marblehead | 0.40% | 0.24%(+0.161)#34 | 0.095%(+0.308)#983 |
| 35. | Dover | 0.40% | 0.24%(+0.156)#35 | 0.095%(+0.304)#993 |
| 36. | Bellingham | 0.39% | 0.24%(+0.146)#36 | 0.095%(+0.294)#1,020 |
| 37. | Teaticket | 0.38% | 0.24%(+0.143)#37 | 0.095%(+0.290)#1,031 |
| 38. | Arlington | 0.38% | 0.24%(+0.137)#38 | 0.095%(+0.285)#1,052 |
| 39. | Lynnfield | 0.35% | 0.24%(+0.106)#39 | 0.095%(+0.254)#1,124 |
| 40. | Methuen Town | 0.34% | 0.24%(+0.097)#40 | 0.095%(+0.244)#1,153 |
| 41. | Malden | 0.34% | 0.24%(+0.096)#41 | 0.095%(+0.243)#1,159 |
| 42. | Danvers | 0.34% | 0.24%(+0.095)#42 | 0.095%(+0.242)#1,161 |
| 43. | Framingham | 0.34% | 0.24%(+0.094)#43 | 0.095%(+0.241)#1,167 |
| 44. | Needham | 0.33% | 0.24%(+0.093)#44 | 0.095%(+0.240)#1,169 |
| 45. | Sharon | 0.33% | 0.24%(+0.093)#45 | 0.095%(+0.240)#1,172 |
| 46. | Woburn | 0.33% | 0.24%(+0.085)#46 | 0.095%(+0.232)#1,194 |
| 47. | Mansfield Center | 0.33% | 0.24%(+0.083)#47 | 0.095%(+0.231)#1,197 |
| 48. | Braintree Town | 0.32% | 0.24%(+0.078)#48 | 0.095%(+0.226)#1,215 |
| 49. | Holbrook | 0.32% | 0.24%(+0.076)#49 | 0.095%(+0.223)#1,227 |
| 50. | Melrose | 0.28% | 0.24%(+0.040)#50 | 0.095%(+0.187)#1,357 |
| 51. | Milford | 0.28% | 0.24%(+0.034)#51 | 0.095%(+0.181)#1,385 |
| 52. | Winthrop Town | 0.27% | 0.24%(+0.031)#52 | 0.095%(+0.179)#1,395 |
| 53. | Leominster | 0.27% | 0.24%(+0.024)#53 | 0.095%(+0.171)#1,423 |
| 54. | South Dennis | 0.26% | 0.24%(+0.016)#54 | 0.095%(+0.163)#1,466 |
| 55. | Hull | 0.26% | 0.24%(+0.015)#55 | 0.095%(+0.163)#1,470 |
| 56. | Boston | 0.24% | 0.24%(-0.002)#56 | 0.095%(+0.145)#1,535 |
| 57. | Wilmington | 0.24% | 0.24%(-0.005)#57 | 0.095%(+0.143)#1,549 |
| 58. | Webster | 0.23% | 0.24%(-0.013)#58 | 0.095%(+0.134)#1,591 |
| 59. | Burlington | 0.23% | 0.24%(-0.016)#59 | 0.095%(+0.131)#1,602 |
| 60. | Ware | 0.22% | 0.24%(-0.018)#60 | 0.095%(+0.129)#1,609 |
| 61. | Lexington | 0.22% | 0.24%(-0.020)#61 | 0.095%(+0.128)#1,615 |
| 62. | Nahant | 0.21% | 0.24%(-0.032)#62 | 0.095%(+0.115)#1,688 |
| 63. | Worcester | 0.21% | 0.24%(-0.032)#63 | 0.095%(+0.115)#1,691 |
| 64. | Salisbury | 0.21% | 0.24%(-0.033)#64 | 0.095%(+0.114)#1,695 |
| 65. | Barnstable Town | 0.20% | 0.24%(-0.037)#65 | 0.095%(+0.110)#1,724 |
| 66. | Weymouth Town | 0.20% | 0.24%(-0.039)#66 | 0.095%(+0.108)#1,739 |
| 67. | Plymouth | 0.20% | 0.24%(-0.046)#67 | 0.095%(+0.102)#1,781 |
| 68. | Bridgewater Town | 0.19% | 0.24%(-0.053)#68 | 0.095%(+0.095)#1,817 |
| 69. | Hudson | 0.19% | 0.24%(-0.055)#69 | 0.095%(+0.093)#1,831 |
| 70. | Yarmouth Port | 0.18% | 0.24%(-0.058)#70 | 0.095%(+0.090)#1,848 |
| 71. | Bliss Corner | 0.18% | 0.24%(-0.063)#71 | 0.095%(+0.084)#1,886 |
| 72. | Quincy | 0.17% | 0.24%(-0.067)#72 | 0.095%(+0.080)#1,908 |
| 73. | East Falmouth | 0.17% | 0.24%(-0.074)#73 | 0.095%(+0.073)#1,951 |
| 74. | Northborough | 0.16% | 0.24%(-0.077)#74 | 0.095%(+0.070)#1,970 |
| 75. | Marshfield | 0.16% | 0.24%(-0.077)#75 | 0.095%(+0.070)#1,976 |
| 76. | Walpole | 0.16% | 0.24%(-0.085)#76 | 0.095%(+0.062)#2,018 |
| 77. | Pittsfield | 0.14% | 0.24%(-0.100)#77 | 0.095%(+0.047)#2,105 |
| 78. | Amesbury Town | 0.14% | 0.24%(-0.103)#78 | 0.095%(+0.044)#2,125 |
| 79. | Westborough | 0.14% | 0.24%(-0.105)#79 | 0.095%(+0.042)#2,135 |
| 80. | Fall River | 0.13% | 0.24%(-0.109)#80 | 0.095%(+0.038)#2,172 |
| 81. | Springfield | 0.12% | 0.24%(-0.118)#81 | 0.095%(+0.030)#2,254 |
| 82. | Chelsea | 0.12% | 0.24%(-0.119)#82 | 0.095%(+0.028)#2,265 |
| 83. | West Warren | 0.12% | 0.24%(-0.121)#83 | 0.095%(+0.027)#2,285 |
| 84. | Franklin Town | 0.12% | 0.24%(-0.123)#84 | 0.095%(+0.024)#2,301 |
| 85. | Milton | 0.11% | 0.24%(-0.133)#85 | 0.095%(+0.014)#2,384 |
| 86. | Wellesley | 0.10% | 0.24%(-0.141)#86 | 0.095%(+0.006)#2,452 |
| 87. | Fitchburg | 0.091% | 0.24%(-0.150)#87 | 0.095%(-0.003)#2,524 |
| 88. | Lawrence | 0.091% | 0.24%(-0.151)#88 | 0.095%(-0.004)#2,533 |
| 89. | Beverly | 0.090% | 0.24%(-0.152)#89 | 0.095%(-0.005)#2,544 |
| 90. | South Duxbury | 0.088% | 0.24%(-0.154)#90 | 0.095%(-0.007)#2,560 |
| 91. | Holyoke | 0.084% | 0.24%(-0.158)#91 | 0.095%(-0.011)#2,602 |
| 92. | Whitinsville | 0.082% | 0.24%(-0.159)#92 | 0.095%(-0.012)#2,613 |
| 93. | Lynn | 0.079% | 0.24%(-0.162)#93 | 0.095%(-0.015)#2,642 |
| 94. | Marlborough | 0.075% | 0.24%(-0.167)#94 | 0.095%(-0.020)#2,692 |
| 95. | Westfield | 0.074% | 0.24%(-0.168)#95 | 0.095%(-0.021)#2,711 |
| 96. | North Attleborough | 0.072% | 0.24%(-0.170)#96 | 0.095%(-0.023)#2,736 |
| 97. | Brockton | 0.066% | 0.24%(-0.176)#97 | 0.095%(-0.029)#2,810 |
| 98. | Pinehurst | 0.062% | 0.24%(-0.180)#98 | 0.095%(-0.032)#2,847 |
| 99. | Salem | 0.058% | 0.24%(-0.183)#99 | 0.095%(-0.036)#2,892 |
| 100. | Greenfield | 0.057% | 0.24%(-0.185)#100 | 0.095%(-0.038)#2,918 |
Common Questions
What are the Top 10 Cities with the Highest Percentage of Immigrants from Italy in Massachusetts?
Top 10 Cities with the Highest Percentage of Immigrants from Italy in Massachusetts are:
#1
3.91%
#2
2.32%
#3
1.80%
#4
1.70%
#5
1.65%
#6
1.43%
#7
1.41%
#8
1.18%
#9
1.14%
#10
0.97%
What city has the Highest Percentage of Immigrants from Italy in Massachusetts?
Lunenburg has the Highest Percentage of Immigrants from Italy in Massachusetts with 3.91%.
What is the Percentage of Immigrants from Italy in the State of Massachusetts?
Percentage of Immigrants from Italy in Massachusetts is 0.24%.
What is the Percentage of Immigrants from Italy in the United States?
Percentage of Immigrants from Italy in the United States is 0.095%.