Cities with the Most Immigrants from Ireland in Massachusetts
RELATED REPORTS & OPTIONS
Ireland
Massachusetts
Compare Cities
Map of Cities with the Most Immigrants from Ireland in Massachusetts
0
2,500
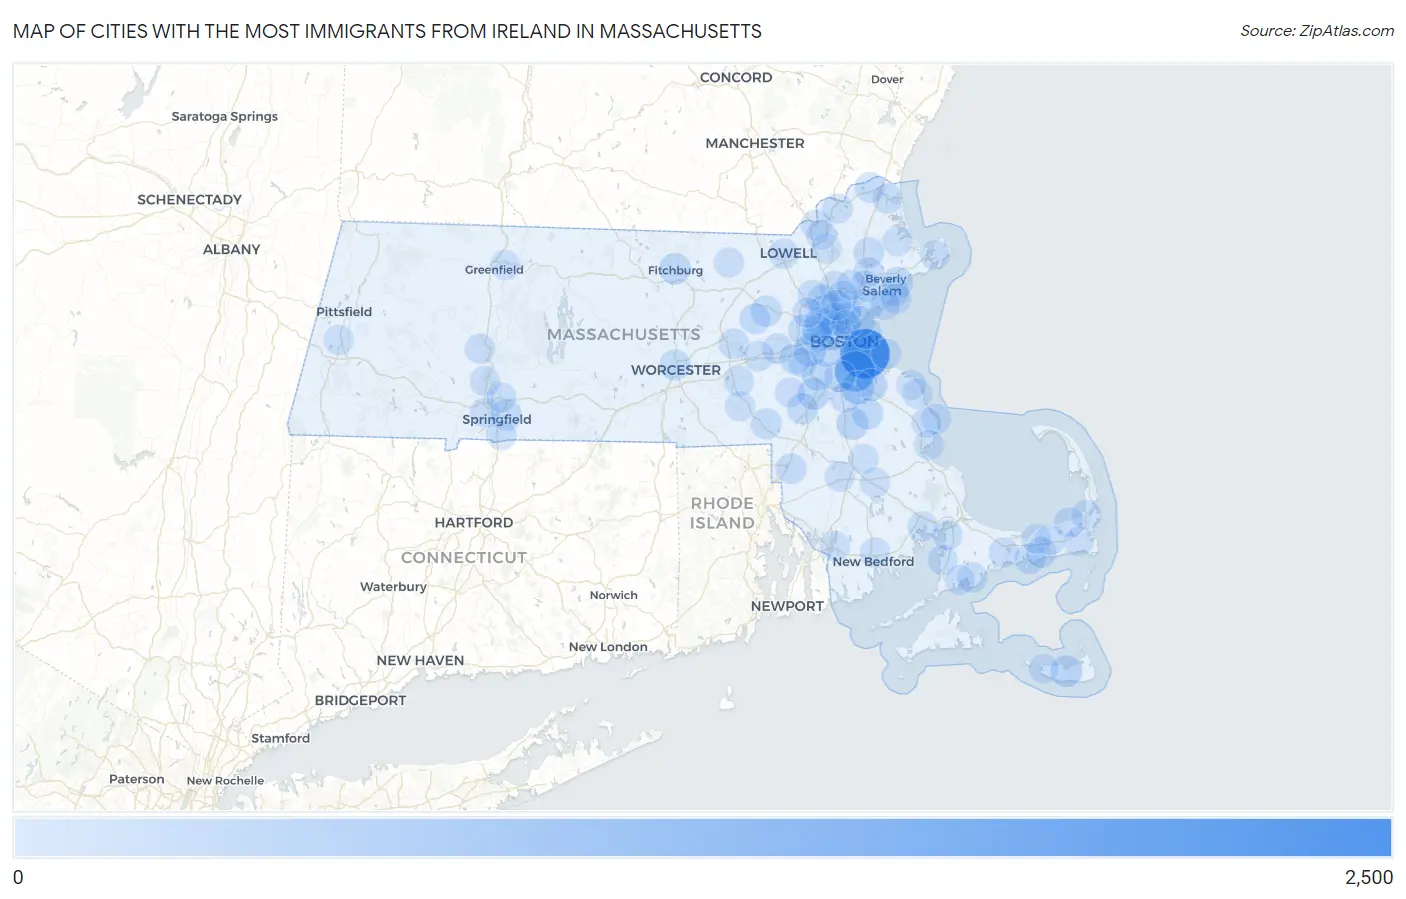
Cities with the Most Immigrants from Ireland in Massachusetts
| City | Ireland | vs State | vs National | |
| 1. | Boston | 2,087 | 13,446(15.52%)#1 | 119,836(1.74%)#5 |
| 2. | Quincy | 1,090 | 13,446(8.11%)#2 | 119,836(0.91%)#7 |
| 3. | Braintree Town | 332 | 13,446(2.47%)#3 | 119,836(0.28%)#19 |
| 4. | Cambridge | 330 | 13,446(2.45%)#4 | 119,836(0.28%)#20 |
| 5. | Newton | 278 | 13,446(2.07%)#5 | 119,836(0.23%)#27 |
| 6. | Weymouth Town | 225 | 13,446(1.67%)#6 | 119,836(0.19%)#43 |
| 7. | Brockton | 210 | 13,446(1.56%)#7 | 119,836(0.18%)#46 |
| 8. | Nantucket | 193 | 13,446(1.44%)#8 | 119,836(0.16%)#52 |
| 9. | Norwood | 192 | 13,446(1.43%)#9 | 119,836(0.16%)#53 |
| 10. | Milton | 178 | 13,446(1.32%)#10 | 119,836(0.15%)#57 |
| 11. | Medford | 167 | 13,446(1.24%)#11 | 119,836(0.14%)#66 |
| 12. | Fitchburg | 167 | 13,446(1.24%)#12 | 119,836(0.14%)#67 |
| 13. | Malden | 142 | 13,446(1.06%)#13 | 119,836(0.12%)#83 |
| 14. | Dedham | 141 | 13,446(1.05%)#14 | 119,836(0.12%)#85 |
| 15. | Beverly | 138 | 13,446(1.03%)#15 | 119,836(0.12%)#92 |
| 16. | Waltham | 134 | 13,446(1.00%)#16 | 119,836(0.11%)#94 |
| 17. | Somerville | 133 | 13,446(0.99%)#17 | 119,836(0.11%)#95 |
| 18. | Brookline | 132 | 13,446(0.98%)#18 | 119,836(0.11%)#99 |
| 19. | Abington | 125 | 13,446(0.93%)#19 | 119,836(0.10%)#109 |
| 20. | Franklin Town | 118 | 13,446(0.88%)#20 | 119,836(0.10%)#121 |
| 21. | Winthrop Town | 112 | 13,446(0.83%)#21 | 119,836(0.09%)#130 |
| 22. | Wellesley | 111 | 13,446(0.83%)#22 | 119,836(0.09%)#132 |
| 23. | West Concord | 111 | 13,446(0.83%)#23 | 119,836(0.09%)#133 |
| 24. | Worcester | 110 | 13,446(0.82%)#24 | 119,836(0.09%)#134 |
| 25. | Walpole | 110 | 13,446(0.82%)#25 | 119,836(0.09%)#136 |
| 26. | Winchester | 105 | 13,446(0.78%)#26 | 119,836(0.09%)#145 |
| 27. | Springfield | 104 | 13,446(0.77%)#27 | 119,836(0.09%)#148 |
| 28. | West Yarmouth | 100 | 13,446(0.74%)#28 | 119,836(0.08%)#161 |
| 29. | Peabody | 99 | 13,446(0.74%)#29 | 119,836(0.08%)#162 |
| 30. | Maynard | 93 | 13,446(0.69%)#30 | 119,836(0.08%)#179 |
| 31. | Lynn | 90 | 13,446(0.67%)#31 | 119,836(0.08%)#185 |
| 32. | Woburn | 90 | 13,446(0.67%)#32 | 119,836(0.08%)#186 |
| 33. | Melrose | 90 | 13,446(0.67%)#33 | 119,836(0.08%)#188 |
| 34. | Watertown Town | 89 | 13,446(0.66%)#34 | 119,836(0.07%)#196 |
| 35. | Arlington | 83 | 13,446(0.62%)#35 | 119,836(0.07%)#211 |
| 36. | Revere | 81 | 13,446(0.60%)#36 | 119,836(0.07%)#219 |
| 37. | Methuen Town | 81 | 13,446(0.60%)#37 | 119,836(0.07%)#220 |
| 38. | Reading | 76 | 13,446(0.57%)#38 | 119,836(0.06%)#240 |
| 39. | Topsfield | 76 | 13,446(0.57%)#39 | 119,836(0.06%)#244 |
| 40. | Wakefield | 75 | 13,446(0.56%)#40 | 119,836(0.06%)#248 |
| 41. | South Yarmouth | 75 | 13,446(0.56%)#41 | 119,836(0.06%)#249 |
| 42. | Amesbury Town | 67 | 13,446(0.50%)#42 | 119,836(0.06%)#270 |
| 43. | Cochituate | 65 | 13,446(0.48%)#43 | 119,836(0.05%)#285 |
| 44. | Attleboro | 64 | 13,446(0.48%)#44 | 119,836(0.05%)#288 |
| 45. | Marlborough | 57 | 13,446(0.42%)#45 | 119,836(0.05%)#332 |
| 46. | Salem | 54 | 13,446(0.40%)#46 | 119,836(0.05%)#352 |
| 47. | Randolph Town | 52 | 13,446(0.39%)#47 | 119,836(0.04%)#366 |
| 48. | Belmont | 52 | 13,446(0.39%)#48 | 119,836(0.04%)#367 |
| 49. | Seabrook | 49 | 13,446(0.36%)#49 | 119,836(0.04%)#393 |
| 50. | Burlington | 44 | 13,446(0.33%)#50 | 119,836(0.04%)#439 |
| 51. | Marblehead | 40 | 13,446(0.30%)#51 | 119,836(0.03%)#492 |
| 52. | Barnstable Town | 39 | 13,446(0.29%)#52 | 119,836(0.03%)#512 |
| 53. | South Dennis | 38 | 13,446(0.28%)#53 | 119,836(0.03%)#539 |
| 54. | Taunton | 36 | 13,446(0.27%)#54 | 119,836(0.03%)#567 |
| 55. | Framingham | 35 | 13,446(0.26%)#55 | 119,836(0.03%)#577 |
| 56. | Swampscott | 33 | 13,446(0.25%)#56 | 119,836(0.03%)#619 |
| 57. | Hull | 33 | 13,446(0.25%)#57 | 119,836(0.03%)#620 |
| 58. | Brewster | 33 | 13,446(0.25%)#58 | 119,836(0.03%)#629 |
| 59. | Everett | 32 | 13,446(0.24%)#59 | 119,836(0.03%)#634 |
| 60. | Andover | 32 | 13,446(0.24%)#60 | 119,836(0.03%)#649 |
| 61. | Holyoke | 30 | 13,446(0.22%)#61 | 119,836(0.03%)#678 |
| 62. | Lowell | 29 | 13,446(0.22%)#62 | 119,836(0.02%)#695 |
| 63. | North Attleborough | 28 | 13,446(0.21%)#63 | 119,836(0.02%)#719 |
| 64. | Danvers | 28 | 13,446(0.21%)#64 | 119,836(0.02%)#721 |
| 65. | Ocean Bluff Brant Rock | 28 | 13,446(0.21%)#65 | 119,836(0.02%)#738 |
| 66. | Stoneham | 27 | 13,446(0.20%)#66 | 119,836(0.02%)#753 |
| 67. | Longmeadow | 25 | 13,446(0.19%)#67 | 119,836(0.02%)#808 |
| 68. | Marshfield | 25 | 13,446(0.19%)#68 | 119,836(0.02%)#815 |
| 69. | Haverhill | 23 | 13,446(0.17%)#69 | 119,836(0.02%)#850 |
| 70. | Northampton | 23 | 13,446(0.17%)#70 | 119,836(0.02%)#860 |
| 71. | Wareham Center | 23 | 13,446(0.17%)#71 | 119,836(0.02%)#876 |
| 72. | North Falmouth | 23 | 13,446(0.17%)#72 | 119,836(0.02%)#877 |
| 73. | West Springfield Town | 22 | 13,446(0.16%)#73 | 119,836(0.02%)#894 |
| 74. | Newburyport | 22 | 13,446(0.16%)#74 | 119,836(0.02%)#900 |
| 75. | Medfield | 22 | 13,446(0.16%)#75 | 119,836(0.02%)#917 |
| 76. | Chicopee | 21 | 13,446(0.16%)#76 | 119,836(0.02%)#931 |
| 77. | Lexington | 21 | 13,446(0.16%)#77 | 119,836(0.02%)#933 |
| 78. | Hopkinton | 21 | 13,446(0.16%)#78 | 119,836(0.02%)#959 |
| 79. | Monument Beach | 20 | 13,446(0.15%)#79 | 119,836(0.02%)#1,000 |
| 80. | Lynnfield | 18 | 13,446(0.13%)#80 | 119,836(0.02%)#1,064 |
| 81. | Fall River | 17 | 13,446(0.13%)#81 | 119,836(0.01%)#1,077 |
| 82. | Lawrence | 17 | 13,446(0.13%)#82 | 119,836(0.01%)#1,079 |
| 83. | Milford | 17 | 13,446(0.13%)#83 | 119,836(0.01%)#1,094 |
| 84. | Lenox | 17 | 13,446(0.13%)#84 | 119,836(0.01%)#1,122 |
| 85. | Gloucester | 16 | 13,446(0.12%)#85 | 119,836(0.01%)#1,136 |
| 86. | Ipswich | 16 | 13,446(0.12%)#86 | 119,836(0.01%)#1,160 |
| 87. | South Duxbury | 16 | 13,446(0.12%)#87 | 119,836(0.01%)#1,163 |
| 88. | Needham | 15 | 13,446(0.11%)#88 | 119,836(0.01%)#1,183 |
| 89. | Scituate | 15 | 13,446(0.11%)#89 | 119,836(0.01%)#1,217 |
| 90. | Groton | 15 | 13,446(0.11%)#90 | 119,836(0.01%)#1,229 |
| 91. | East Harwich | 13 | 13,446(0.10%)#91 | 119,836(0.01%)#1,341 |
| 92. | Madaket | 13 | 13,446(0.10%)#92 | 119,836(0.01%)#1,355 |
| 93. | Turners Falls | 12 | 13,446(0.09%)#93 | 119,836(0.01%)#1,402 |
| 94. | Orleans | 12 | 13,446(0.09%)#94 | 119,836(0.01%)#1,408 |
| 95. | New Bedford | 10 | 13,446(0.07%)#95 | 119,836(0.01%)#1,485 |
| 96. | Bridgewater Town | 10 | 13,446(0.07%)#96 | 119,836(0.01%)#1,501 |
| 97. | Middleborough Center | 10 | 13,446(0.07%)#97 | 119,836(0.01%)#1,530 |
| 98. | East Falmouth | 10 | 13,446(0.07%)#98 | 119,836(0.01%)#1,539 |
| 99. | North Scituate | 9 | 13,446(0.07%)#99 | 119,836(0.01%)#1,615 |
| 100. | Yarmouth Port | 8 | 13,446(0.06%)#100 | 119,836(0.01%)#1,715 |
Common Questions
What are the Top 10 Cities with the Most Immigrants from Ireland in Massachusetts?
Top 10 Cities with the Most Immigrants from Ireland in Massachusetts are:
#1
2,087
#2
1,090
#3
332
#4
330
#5
278
#6
225
#7
210
#8
193
#9
192
#10
178
What city has the Most Immigrants from Ireland in Massachusetts?
Boston has the Most Immigrants from Ireland in Massachusetts with 2,087.
What is the Total Immigrants from Ireland in the State of Massachusetts?
Total Immigrants from Ireland in Massachusetts is 13,446.
What is the Total Immigrants from Ireland in the United States?
Total Immigrants from Ireland in the United States is 119,836.