Cities with the Most Immigrants from Venezuela in Massachusetts
RELATED REPORTS & OPTIONS
Venezuela
Massachusetts
Compare Cities
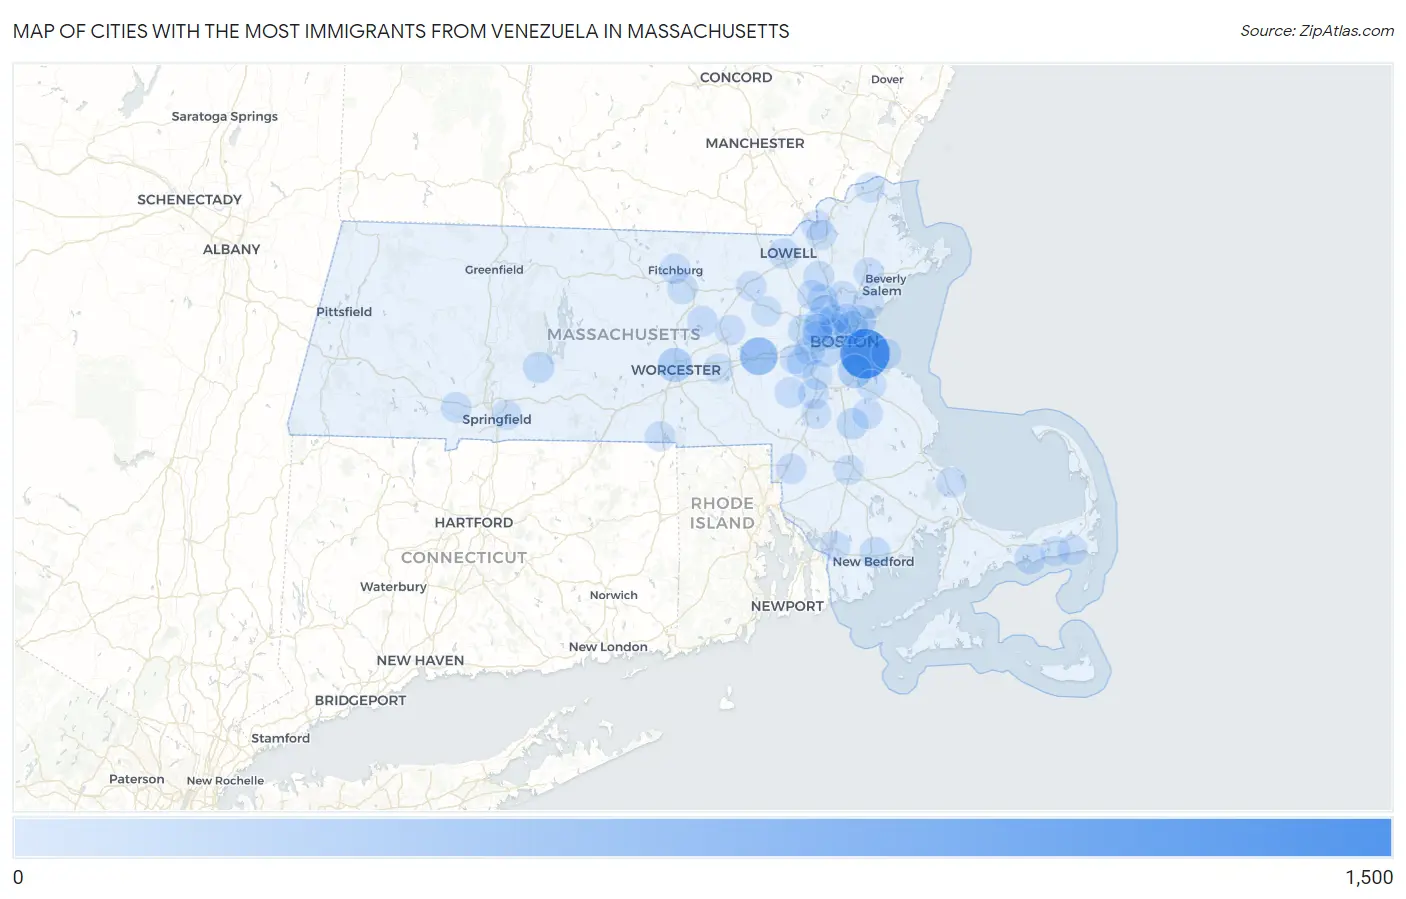
Map of Cities with the Most Immigrants from Venezuela in Massachusetts
0
1,500
Cities with the Most Immigrants from Venezuela in Massachusetts
| City | Venezuela | vs State | vs National | |
| 1. | Boston | 1,193 | 5,265(22.66%)#1 | 519,103(0.23%)#58 |
| 2. | Framingham | 455 | 5,265(8.64%)#2 | 519,103(0.09%)#152 |
| 3. | Worcester | 243 | 5,265(4.62%)#3 | 519,103(0.05%)#282 |
| 4. | Quincy | 214 | 5,265(4.06%)#4 | 519,103(0.04%)#315 |
| 5. | Chelsea | 203 | 5,265(3.86%)#5 | 519,103(0.04%)#333 |
| 6. | Revere | 132 | 5,265(2.51%)#6 | 519,103(0.03%)#472 |
| 7. | Greenfield | 126 | 5,265(2.39%)#7 | 519,103(0.02%)#486 |
| 8. | Somerville | 118 | 5,265(2.24%)#8 | 519,103(0.02%)#503 |
| 9. | Brookline | 91 | 5,265(1.73%)#9 | 519,103(0.02%)#625 |
| 10. | Brockton | 90 | 5,265(1.71%)#10 | 519,103(0.02%)#630 |
| 11. | Waltham | 79 | 5,265(1.50%)#11 | 519,103(0.02%)#679 |
| 12. | Belchertown | 75 | 5,265(1.42%)#12 | 519,103(0.01%)#712 |
| 13. | Needham | 73 | 5,265(1.39%)#13 | 519,103(0.01%)#721 |
| 14. | West Yarmouth | 69 | 5,265(1.31%)#14 | 519,103(0.01%)#750 |
| 15. | Cambridge | 65 | 5,265(1.23%)#15 | 519,103(0.01%)#770 |
| 16. | New Bedford | 63 | 5,265(1.20%)#16 | 519,103(0.01%)#785 |
| 17. | Arlington | 56 | 5,265(1.06%)#17 | 519,103(0.01%)#863 |
| 18. | Woburn | 55 | 5,265(1.04%)#18 | 519,103(0.01%)#877 |
| 19. | Leominster | 49 | 5,265(0.93%)#19 | 519,103(0.01%)#940 |
| 20. | Lowell | 46 | 5,265(0.87%)#20 | 519,103(0.01%)#975 |
| 21. | Lynn | 46 | 5,265(0.87%)#21 | 519,103(0.01%)#976 |
| 22. | Wilmington | 45 | 5,265(0.85%)#22 | 519,103(0.01%)#999 |
| 23. | Newton | 44 | 5,265(0.84%)#23 | 519,103(0.01%)#1,009 |
| 24. | Medford | 43 | 5,265(0.82%)#24 | 519,103(0.01%)#1,028 |
| 25. | Watertown Town | 41 | 5,265(0.78%)#25 | 519,103(0.01%)#1,058 |
| 26. | Amherst | 41 | 5,265(0.78%)#26 | 519,103(0.01%)#1,059 |
| 27. | Westfield | 39 | 5,265(0.74%)#27 | 519,103(0.01%)#1,081 |
| 28. | Norwood | 38 | 5,265(0.72%)#28 | 519,103(0.01%)#1,097 |
| 29. | Medfield | 38 | 5,265(0.72%)#29 | 519,103(0.01%)#1,105 |
| 30. | Clinton | 37 | 5,265(0.70%)#30 | 519,103(0.01%)#1,120 |
| 31. | Wakefield | 30 | 5,265(0.57%)#31 | 519,103(0.01%)#1,249 |
| 32. | Methuen Town | 29 | 5,265(0.55%)#32 | 519,103(0.01%)#1,270 |
| 33. | Abington | 29 | 5,265(0.55%)#33 | 519,103(0.01%)#1,278 |
| 34. | Fitchburg | 28 | 5,265(0.53%)#34 | 519,103(0.01%)#1,297 |
| 35. | Burlington | 28 | 5,265(0.53%)#35 | 519,103(0.01%)#1,303 |
| 36. | Fall River | 25 | 5,265(0.47%)#36 | 519,103(0.00%)#1,369 |
| 37. | Attleboro | 22 | 5,265(0.42%)#37 | 519,103(0.00%)#1,452 |
| 38. | Malden | 20 | 5,265(0.38%)#38 | 519,103(0.00%)#1,507 |
| 39. | North Attleborough | 19 | 5,265(0.36%)#39 | 519,103(0.00%)#1,543 |
| 40. | Winchester | 19 | 5,265(0.36%)#40 | 519,103(0.00%)#1,548 |
| 41. | The Pinehills | 17 | 5,265(0.32%)#41 | 519,103(0.00%)#1,639 |
| 42. | Danvers | 16 | 5,265(0.30%)#42 | 519,103(0.00%)#1,657 |
| 43. | Littleton Common | 16 | 5,265(0.30%)#43 | 519,103(0.00%)#1,681 |
| 44. | Lawrence | 14 | 5,265(0.27%)#44 | 519,103(0.00%)#1,726 |
| 45. | Hudson | 14 | 5,265(0.27%)#45 | 519,103(0.00%)#1,739 |
| 46. | Raynham Center | 13 | 5,265(0.25%)#46 | 519,103(0.00%)#1,799 |
| 47. | Springfield | 12 | 5,265(0.23%)#47 | 519,103(0.00%)#1,805 |
| 48. | Hull | 12 | 5,265(0.23%)#48 | 519,103(0.00%)#1,831 |
| 49. | West Concord | 11 | 5,265(0.21%)#49 | 519,103(0.00%)#1,887 |
| 50. | Weymouth Town | 10 | 5,265(0.19%)#50 | 519,103(0.00%)#1,913 |
| 51. | Wellesley | 10 | 5,265(0.19%)#51 | 519,103(0.00%)#1,924 |
| 52. | Belmont | 10 | 5,265(0.19%)#52 | 519,103(0.00%)#1,926 |
| 53. | Webster | 10 | 5,265(0.19%)#53 | 519,103(0.00%)#1,943 |
| 54. | Sharon | 9 | 5,265(0.17%)#54 | 519,103(0.00%)#2,010 |
| 55. | Westborough | 8 | 5,265(0.15%)#55 | 519,103(0.00%)#2,063 |
| 56. | Dennis Port | 8 | 5,265(0.15%)#56 | 519,103(0.00%)#2,068 |
| 57. | Amesbury Town | 7 | 5,265(0.13%)#57 | 519,103(0.00%)#2,099 |
| 58. | Harwich Port | 7 | 5,265(0.13%)#58 | 519,103(0.00%)#2,121 |
| 59. | Dedham | 6 | 5,265(0.11%)#59 | 519,103(0.00%)#2,139 |
Common Questions
What are the Top 10 Cities with the Most Immigrants from Venezuela in Massachusetts?
Top 10 Cities with the Most Immigrants from Venezuela in Massachusetts are:
#1
1,193
#2
455
#3
243
#4
214
#5
203
#6
132
#7
118
#8
91
#9
90
#10
79
What city has the Most Immigrants from Venezuela in Massachusetts?
Boston has the Most Immigrants from Venezuela in Massachusetts with 1,193.
What is the Total Immigrants from Venezuela in the State of Massachusetts?
Total Immigrants from Venezuela in Massachusetts is 5,265.
What is the Total Immigrants from Venezuela in the United States?
Total Immigrants from Venezuela in the United States is 519,103.