Cities with the Highest Percentage of South American Population in Massachusetts
RELATED REPORTS & OPTIONS
South American
Massachusetts
Compare Cities
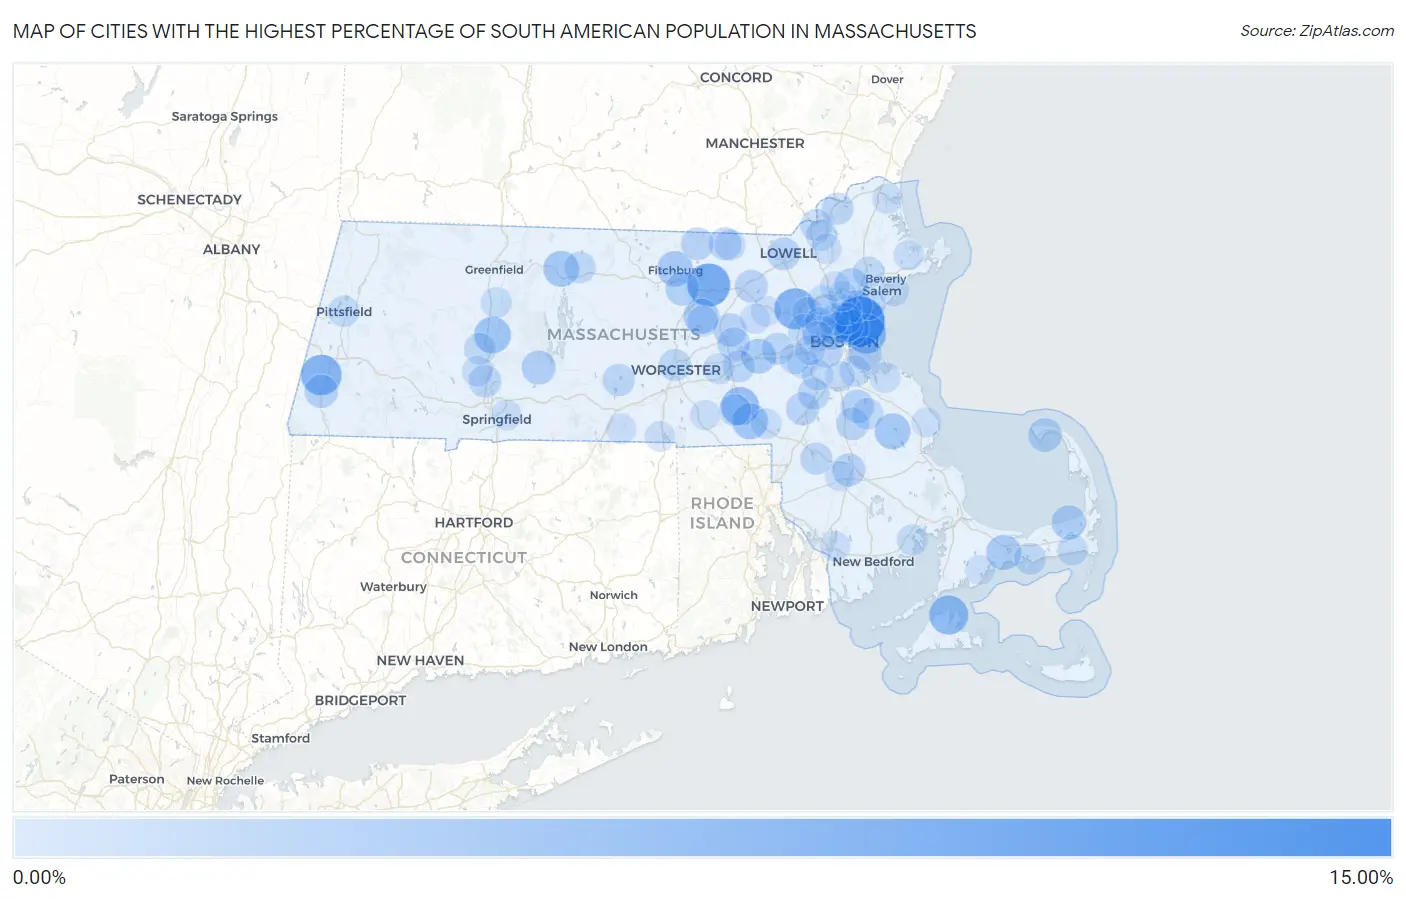
Map of Cities with the Highest Percentage of South American Population in Massachusetts
0.00%
15.00%
Cities with the Highest Percentage of South American Population in Massachusetts
| City | South American | vs State | vs National | |
| 1. | Revere | 11.82% | 1.34%(+10.5)#1 | 1.28%(+10.5)#161 |
| 2. | Shirley | 8.02% | 1.34%(+6.68)#2 | 1.28%(+6.74)#301 |
| 3. | Hanscom Afb | 6.84% | 1.34%(+5.50)#3 | 1.28%(+5.56)#383 |
| 4. | Housatonic | 6.60% | 1.34%(+5.26)#4 | 1.28%(+5.32)#406 |
| 5. | Winthrop Town | 6.07% | 1.34%(+4.73)#5 | 1.28%(+4.79)#461 |
| 6. | Vineyard Haven | 5.75% | 1.34%(+4.41)#6 | 1.28%(+4.46)#508 |
| 7. | Milford | 5.21% | 1.34%(+3.86)#7 | 1.28%(+3.92)#575 |
| 8. | Hatfield | 4.36% | 1.34%(+3.02)#8 | 1.28%(+3.07)#742 |
| 9. | Chelsea | 3.98% | 1.34%(+2.64)#9 | 1.28%(+2.70)#857 |
| 10. | Bellingham | 3.97% | 1.34%(+2.63)#10 | 1.28%(+2.69)#861 |
| 11. | Orange | 3.89% | 1.34%(+2.55)#11 | 1.28%(+2.60)#882 |
| 12. | Hanson | 3.88% | 1.34%(+2.54)#12 | 1.28%(+2.60)#885 |
| 13. | South Lancaster | 3.65% | 1.34%(+2.31)#13 | 1.28%(+2.37)#955 |
| 14. | Fitchburg | 3.63% | 1.34%(+2.29)#14 | 1.28%(+2.34)#967 |
| 15. | Barnstable Town | 3.51% | 1.34%(+2.17)#15 | 1.28%(+2.23)#1,002 |
| 16. | Framingham | 3.25% | 1.34%(+1.91)#16 | 1.28%(+1.96)#1,101 |
| 17. | Everett | 3.07% | 1.34%(+1.73)#17 | 1.28%(+1.79)#1,189 |
| 18. | Brewster | 3.05% | 1.34%(+1.71)#18 | 1.28%(+1.76)#1,201 |
| 19. | Belchertown | 2.83% | 1.34%(+1.49)#19 | 1.28%(+1.55)#1,308 |
| 20. | Leominster | 2.75% | 1.34%(+1.41)#20 | 1.28%(+1.47)#1,363 |
| 21. | Provincetown | 2.74% | 1.34%(+1.40)#21 | 1.28%(+1.46)#1,367 |
| 22. | Lynnfield | 2.69% | 1.34%(+1.35)#22 | 1.28%(+1.41)#1,387 |
| 23. | Great Barrington | 2.49% | 1.34%(+1.15)#23 | 1.28%(+1.20)#1,505 |
| 24. | Hudson | 2.40% | 1.34%(+1.06)#24 | 1.28%(+1.12)#1,567 |
| 25. | Boston | 2.39% | 1.34%(+1.05)#25 | 1.28%(+1.11)#1,575 |
| 26. | Holbrook | 2.36% | 1.34%(+1.02)#26 | 1.28%(+1.08)#1,598 |
| 27. | Raynham Center | 2.35% | 1.34%(+1.00)#27 | 1.28%(+1.06)#1,612 |
| 28. | Walpole | 2.28% | 1.34%(+0.935)#28 | 1.28%(+0.992)#1,651 |
| 29. | Littleton Common | 2.23% | 1.34%(+0.889)#29 | 1.28%(+0.947)#1,692 |
| 30. | Pepperell | 2.22% | 1.34%(+0.882)#30 | 1.28%(+0.939)#1,698 |
| 31. | Marlborough | 2.15% | 1.34%(+0.807)#31 | 1.28%(+0.865)#1,753 |
| 32. | Lynn | 2.13% | 1.34%(+0.793)#32 | 1.28%(+0.851)#1,764 |
| 33. | Brookline | 2.13% | 1.34%(+0.792)#33 | 1.28%(+0.849)#1,766 |
| 34. | Brockton | 2.12% | 1.34%(+0.784)#34 | 1.28%(+0.842)#1,775 |
| 35. | Townsend | 2.12% | 1.34%(+0.781)#35 | 1.28%(+0.839)#1,778 |
| 36. | Lowell | 2.10% | 1.34%(+0.757)#36 | 1.28%(+0.815)#1,804 |
| 37. | Holyoke | 2.01% | 1.34%(+0.667)#37 | 1.28%(+0.724)#1,894 |
| 38. | Amherst | 1.98% | 1.34%(+0.642)#38 | 1.28%(+0.700)#1,916 |
| 39. | East Brookfield | 1.93% | 1.34%(+0.592)#39 | 1.28%(+0.650)#1,960 |
| 40. | Worcester | 1.87% | 1.34%(+0.534)#40 | 1.28%(+0.591)#2,009 |
| 41. | Belmont | 1.87% | 1.34%(+0.526)#41 | 1.28%(+0.584)#2,019 |
| 42. | Norton Center | 1.86% | 1.34%(+0.520)#42 | 1.28%(+0.577)#2,027 |
| 43. | Haverhill | 1.85% | 1.34%(+0.511)#43 | 1.28%(+0.569)#2,041 |
| 44. | Norwood | 1.83% | 1.34%(+0.491)#44 | 1.28%(+0.548)#2,064 |
| 45. | Methuen Town | 1.81% | 1.34%(+0.471)#45 | 1.28%(+0.529)#2,079 |
| 46. | Cordaville | 1.80% | 1.34%(+0.462)#46 | 1.28%(+0.520)#2,089 |
| 47. | Cochituate | 1.77% | 1.34%(+0.432)#47 | 1.28%(+0.490)#2,117 |
| 48. | Cambridge | 1.74% | 1.34%(+0.404)#48 | 1.28%(+0.462)#2,155 |
| 49. | Hopedale | 1.74% | 1.34%(+0.400)#49 | 1.28%(+0.457)#2,160 |
| 50. | Waltham | 1.69% | 1.34%(+0.347)#50 | 1.28%(+0.404)#2,215 |
| 51. | Northampton | 1.67% | 1.34%(+0.334)#51 | 1.28%(+0.392)#2,234 |
| 52. | Somerville | 1.67% | 1.34%(+0.328)#52 | 1.28%(+0.386)#2,238 |
| 53. | Saugus | 1.65% | 1.34%(+0.308)#53 | 1.28%(+0.366)#2,258 |
| 54. | Danvers | 1.63% | 1.34%(+0.290)#54 | 1.28%(+0.347)#2,284 |
| 55. | West Yarmouth | 1.61% | 1.34%(+0.266)#55 | 1.28%(+0.324)#2,313 |
| 56. | Athol | 1.56% | 1.34%(+0.223)#56 | 1.28%(+0.280)#2,368 |
| 57. | Abington | 1.52% | 1.34%(+0.183)#57 | 1.28%(+0.240)#2,416 |
| 58. | Malden | 1.49% | 1.34%(+0.152)#58 | 1.28%(+0.209)#2,464 |
| 59. | Quincy | 1.48% | 1.34%(+0.142)#59 | 1.28%(+0.199)#2,481 |
| 60. | Pittsfield | 1.44% | 1.34%(+0.100)#60 | 1.28%(+0.158)#2,535 |
| 61. | Needham | 1.42% | 1.34%(+0.080)#61 | 1.28%(+0.138)#2,576 |
| 62. | Winchester | 1.40% | 1.34%(+0.058)#62 | 1.28%(+0.115)#2,618 |
| 63. | Marion Center | 1.33% | 1.34%(-0.014)#63 | 1.28%(+0.043)#2,737 |
| 64. | Clinton | 1.30% | 1.34%(-0.036)#64 | 1.28%(+0.021)#2,771 |
| 65. | Lawrence | 1.29% | 1.34%(-0.052)#65 | 1.28%(+0.006)#2,803 |
| 66. | Medford | 1.27% | 1.34%(-0.071)#66 | 1.28%(-0.013)#2,837 |
| 67. | East Pepperell | 1.25% | 1.34%(-0.090)#67 | 1.28%(-0.033)#2,874 |
| 68. | Dedham | 1.22% | 1.34%(-0.120)#68 | 1.28%(-0.062)#2,933 |
| 69. | Harwich Port | 1.20% | 1.34%(-0.142)#69 | 1.28%(-0.084)#2,991 |
| 70. | Westborough | 1.19% | 1.34%(-0.154)#70 | 1.28%(-0.096)#3,018 |
| 71. | South Deerfield | 1.18% | 1.34%(-0.163)#71 | 1.28%(-0.105)#3,037 |
| 72. | Wellesley | 1.18% | 1.34%(-0.165)#72 | 1.28%(-0.108)#3,045 |
| 73. | Hingham | 1.16% | 1.34%(-0.181)#73 | 1.28%(-0.124)#3,077 |
| 74. | Franklin Town | 1.13% | 1.34%(-0.215)#74 | 1.28%(-0.157)#3,159 |
| 75. | Easthampton Town | 1.08% | 1.34%(-0.262)#75 | 1.28%(-0.205)#3,268 |
| 76. | Webster | 0.97% | 1.34%(-0.370)#76 | 1.28%(-0.313)#3,532 |
| 77. | Lexington | 0.96% | 1.34%(-0.376)#77 | 1.28%(-0.319)#3,554 |
| 78. | Springfield | 0.95% | 1.34%(-0.391)#78 | 1.28%(-0.333)#3,599 |
| 79. | West Concord | 0.95% | 1.34%(-0.395)#79 | 1.28%(-0.337)#3,610 |
| 80. | Newburyport | 0.92% | 1.34%(-0.420)#80 | 1.28%(-0.362)#3,682 |
| 81. | North Attleborough | 0.91% | 1.34%(-0.427)#81 | 1.28%(-0.369)#3,709 |
| 82. | Southbridge Town | 0.89% | 1.34%(-0.446)#82 | 1.28%(-0.389)#3,774 |
| 83. | Arlington | 0.89% | 1.34%(-0.448)#83 | 1.28%(-0.390)#3,780 |
| 84. | Melrose | 0.89% | 1.34%(-0.448)#84 | 1.28%(-0.391)#3,783 |
| 85. | Andover | 0.89% | 1.34%(-0.449)#85 | 1.28%(-0.391)#3,785 |
| 86. | Salem | 0.89% | 1.34%(-0.454)#86 | 1.28%(-0.396)#3,793 |
| 87. | Fall River | 0.86% | 1.34%(-0.483)#87 | 1.28%(-0.426)#3,862 |
| 88. | Essex | 0.85% | 1.34%(-0.490)#88 | 1.28%(-0.432)#3,882 |
| 89. | Greenfield | 0.84% | 1.34%(-0.503)#89 | 1.28%(-0.446)#3,921 |
| 90. | Newton | 0.83% | 1.34%(-0.507)#90 | 1.28%(-0.450)#3,938 |
| 91. | Woburn | 0.83% | 1.34%(-0.509)#91 | 1.28%(-0.451)#3,943 |
| 92. | Watertown Town | 0.82% | 1.34%(-0.522)#92 | 1.28%(-0.465)#3,982 |
| 93. | Milton | 0.80% | 1.34%(-0.539)#93 | 1.28%(-0.482)#4,033 |
| 94. | Whitinsville | 0.80% | 1.34%(-0.543)#94 | 1.28%(-0.486)#4,052 |
| 95. | Maynard | 0.80% | 1.34%(-0.544)#95 | 1.28%(-0.487)#4,056 |
| 96. | Marshfield | 0.74% | 1.34%(-0.601)#96 | 1.28%(-0.544)#4,270 |
| 97. | Taunton | 0.72% | 1.34%(-0.622)#97 | 1.28%(-0.565)#4,342 |
| 98. | Mashpee Neck | 0.71% | 1.34%(-0.632)#98 | 1.28%(-0.574)#4,384 |
| 99. | Wakefield | 0.71% | 1.34%(-0.635)#99 | 1.28%(-0.577)#4,395 |
| 100. | Reading | 0.70% | 1.34%(-0.640)#100 | 1.28%(-0.583)#4,426 |
Common Questions
What are the Top 10 Cities with the Highest Percentage of South American Population in Massachusetts?
Top 10 Cities with the Highest Percentage of South American Population in Massachusetts are:
#1
11.82%
#2
8.02%
#3
6.84%
#4
6.60%
#5
6.07%
#6
5.75%
#7
5.21%
#8
4.36%
#9
3.98%
#10
3.97%
What city has the Highest Percentage of South American Population in Massachusetts?
Revere has the Highest Percentage of South American Population in Massachusetts with 11.82%.
What is the Percentage of South American Population in the State of Massachusetts?
Percentage of South American Population in Massachusetts is 1.34%.
What is the Percentage of South American Population in the United States?
Percentage of South American Population in the United States is 1.28%.