Cities with the Highest Percentage of Population Enrolled in High School in Massachusetts
RELATED REPORTS & OPTIONS
High School
Massachusetts
Compare Cities
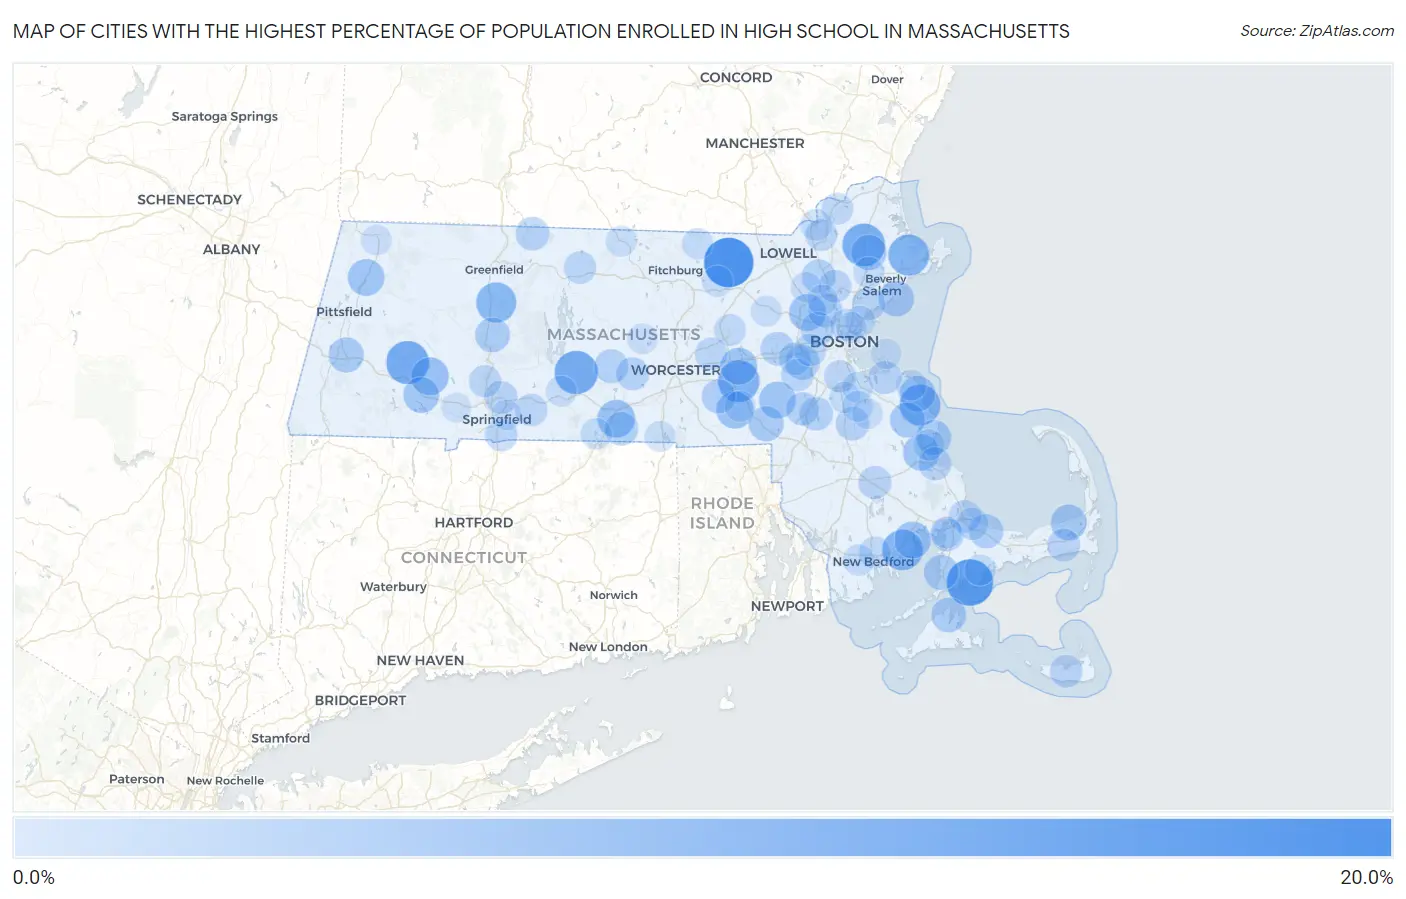
Map of Cities with the Highest Percentage of Population Enrolled in High School in Massachusetts
0.0%
20.0%
Cities with the Highest Percentage of Population Enrolled in High School in Massachusetts
| City | % in High School | vs State | vs National | |
| 1. | Groton | 15.5% | 5.1%(+10.4)#1 | 5.4%(+10.1)#723 |
| 2. | Seconsett Island | 13.8% | 5.1%(+8.74)#2 | 5.4%(+8.46)#1,001 |
| 3. | Ware | 12.1% | 5.1%(+6.99)#3 | 5.4%(+6.72)#1,472 |
| 4. | Chester | 12.0% | 5.1%(+6.88)#4 | 5.4%(+6.60)#1,527 |
| 5. | Boxford | 11.8% | 5.1%(+6.68)#5 | 5.4%(+6.40)#1,617 |
| 6. | Hopkinton | 11.3% | 5.1%(+6.18)#6 | 5.4%(+5.90)#1,872 |
| 7. | Marshfield Hills | 10.9% | 5.1%(+5.76)#7 | 5.4%(+5.48)#2,066 |
| 8. | Essex | 10.8% | 5.1%(+5.73)#8 | 5.4%(+5.46)#2,089 |
| 9. | Mattapoisett Center | 10.7% | 5.1%(+5.59)#9 | 5.4%(+5.31)#2,171 |
| 10. | South Deerfield | 10.4% | 5.1%(+5.32)#10 | 5.4%(+5.04)#2,364 |
| 11. | Sturbridge | 9.1% | 5.1%(+4.02)#11 | 5.4%(+3.74)#3,513 |
| 12. | Huntington | 9.1% | 5.1%(+3.97)#12 | 5.4%(+3.69)#3,564 |
| 13. | Hopedale | 8.9% | 5.1%(+3.75)#13 | 5.4%(+3.47)#3,802 |
| 14. | Cordaville | 8.7% | 5.1%(+3.59)#14 | 5.4%(+3.31)#4,013 |
| 15. | Lexington | 8.7% | 5.1%(+3.58)#15 | 5.4%(+3.30)#4,034 |
| 16. | Marion Center | 8.7% | 5.1%(+3.58)#16 | 5.4%(+3.30)#4,038 |
| 17. | Millis Clicquot | 8.6% | 5.1%(+3.50)#17 | 5.4%(+3.22)#4,139 |
| 18. | Cheshire | 8.6% | 5.1%(+3.48)#18 | 5.4%(+3.20)#4,164 |
| 19. | Kingston | 8.4% | 5.1%(+3.29)#19 | 5.4%(+3.02)#4,461 |
| 20. | Brewster | 8.2% | 5.1%(+3.06)#20 | 5.4%(+2.78)#4,841 |
| 21. | Blandford | 8.1% | 5.1%(+3.03)#21 | 5.4%(+2.75)#4,887 |
| 22. | Scituate | 8.1% | 5.1%(+2.96)#22 | 5.4%(+2.68)#5,012 |
| 23. | Marblehead | 8.0% | 5.1%(+2.85)#23 | 5.4%(+2.57)#5,237 |
| 24. | Topsfield | 7.9% | 5.1%(+2.78)#24 | 5.4%(+2.50)#5,384 |
| 25. | Lee | 7.8% | 5.1%(+2.66)#25 | 5.4%(+2.38)#5,608 |
| 26. | Duxbury | 7.8% | 5.1%(+2.65)#26 | 5.4%(+2.37)#5,617 |
| 27. | Franklin Town | 7.7% | 5.1%(+2.63)#27 | 5.4%(+2.35)#5,661 |
| 28. | North Pembroke | 7.7% | 5.1%(+2.63)#28 | 5.4%(+2.35)#5,662 |
| 29. | West Falmouth | 7.6% | 5.1%(+2.53)#29 | 5.4%(+2.25)#5,848 |
| 30. | Vineyard Haven | 7.6% | 5.1%(+2.51)#30 | 5.4%(+2.23)#5,908 |
| 31. | Hatfield | 7.6% | 5.1%(+2.44)#31 | 5.4%(+2.17)#6,058 |
| 32. | Needham | 7.4% | 5.1%(+2.29)#32 | 5.4%(+2.01)#6,401 |
| 33. | Winchester | 7.3% | 5.1%(+2.23)#33 | 5.4%(+1.95)#6,558 |
| 34. | East Sandwich | 7.3% | 5.1%(+2.22)#34 | 5.4%(+1.94)#6,591 |
| 35. | Upton | 7.2% | 5.1%(+2.12)#35 | 5.4%(+1.84)#6,854 |
| 36. | Wilmington | 7.1% | 5.1%(+1.99)#36 | 5.4%(+1.71)#7,202 |
| 37. | North Brookfield | 7.1% | 5.1%(+1.99)#37 | 5.4%(+1.71)#7,223 |
| 38. | Southbridge Town | 7.0% | 5.1%(+1.91)#38 | 5.4%(+1.63)#7,399 |
| 39. | Cochituate | 7.0% | 5.1%(+1.90)#39 | 5.4%(+1.62)#7,437 |
| 40. | Belmont | 6.9% | 5.1%(+1.83)#40 | 5.4%(+1.55)#7,622 |
| 41. | Northfield | 6.9% | 5.1%(+1.83)#41 | 5.4%(+1.55)#7,625 |
| 42. | Sharon | 6.9% | 5.1%(+1.82)#42 | 5.4%(+1.54)#7,642 |
| 43. | Brockton | 6.9% | 5.1%(+1.80)#43 | 5.4%(+1.52)#7,706 |
| 44. | Walpole | 6.9% | 5.1%(+1.77)#44 | 5.4%(+1.49)#7,785 |
| 45. | Lynn | 6.7% | 5.1%(+1.63)#45 | 5.4%(+1.35)#8,199 |
| 46. | Plymouth | 6.7% | 5.1%(+1.61)#46 | 5.4%(+1.33)#8,251 |
| 47. | Hingham | 6.7% | 5.1%(+1.61)#47 | 5.4%(+1.33)#8,262 |
| 48. | Spencer | 6.7% | 5.1%(+1.59)#48 | 5.4%(+1.31)#8,316 |
| 49. | Middleborough Center | 6.6% | 5.1%(+1.54)#49 | 5.4%(+1.26)#8,493 |
| 50. | Chicopee | 6.6% | 5.1%(+1.53)#50 | 5.4%(+1.26)#8,495 |
| 51. | Northwest Harwich | 6.6% | 5.1%(+1.47)#51 | 5.4%(+1.19)#8,727 |
| 52. | Reading | 6.6% | 5.1%(+1.46)#52 | 5.4%(+1.18)#8,765 |
| 53. | Nantucket | 6.5% | 5.1%(+1.42)#53 | 5.4%(+1.14)#8,882 |
| 54. | Northborough | 6.5% | 5.1%(+1.35)#54 | 5.4%(+1.07)#9,106 |
| 55. | Monument Beach | 6.4% | 5.1%(+1.31)#55 | 5.4%(+1.03)#9,254 |
| 56. | Athol | 6.4% | 5.1%(+1.30)#56 | 5.4%(+1.02)#9,284 |
| 57. | Wilbraham | 6.4% | 5.1%(+1.29)#57 | 5.4%(+1.01)#9,330 |
| 58. | Longmeadow | 6.4% | 5.1%(+1.29)#58 | 5.4%(+1.01)#9,334 |
| 59. | Wellesley | 6.4% | 5.1%(+1.28)#59 | 5.4%(+1.00)#9,370 |
| 60. | Dover | 6.4% | 5.1%(+1.28)#60 | 5.4%(+0.998)#9,381 |
| 61. | Sagamore | 6.3% | 5.1%(+1.24)#61 | 5.4%(+0.962)#9,525 |
| 62. | Newton | 6.3% | 5.1%(+1.24)#62 | 5.4%(+0.956)#9,546 |
| 63. | North Attleborough | 6.3% | 5.1%(+1.22)#63 | 5.4%(+0.944)#9,587 |
| 64. | Sandwich | 6.3% | 5.1%(+1.18)#64 | 5.4%(+0.905)#9,721 |
| 65. | Holyoke | 6.3% | 5.1%(+1.15)#65 | 5.4%(+0.871)#9,829 |
| 66. | Lawrence | 6.2% | 5.1%(+1.05)#66 | 5.4%(+0.775)#10,176 |
| 67. | Milton | 6.2% | 5.1%(+1.05)#67 | 5.4%(+0.775)#10,178 |
| 68. | Everett | 6.1% | 5.1%(+1.03)#68 | 5.4%(+0.746)#10,282 |
| 69. | New Bedford | 6.1% | 5.1%(+0.979)#69 | 5.4%(+0.700)#10,448 |
| 70. | Hudson | 6.1% | 5.1%(+0.969)#70 | 5.4%(+0.689)#10,490 |
| 71. | Oak Bluffs | 6.0% | 5.1%(+0.940)#71 | 5.4%(+0.661)#10,585 |
| 72. | Haverhill | 6.0% | 5.1%(+0.858)#72 | 5.4%(+0.579)#10,906 |
| 73. | Methuen Town | 5.9% | 5.1%(+0.840)#73 | 5.4%(+0.561)#10,976 |
| 74. | Bourne | 5.8% | 5.1%(+0.740)#74 | 5.4%(+0.460)#11,388 |
| 75. | Smith Mills | 5.8% | 5.1%(+0.688)#75 | 5.4%(+0.409)#11,623 |
| 76. | South Duxbury | 5.8% | 5.1%(+0.652)#76 | 5.4%(+0.373)#11,758 |
| 77. | Randolph Town | 5.7% | 5.1%(+0.640)#77 | 5.4%(+0.361)#11,814 |
| 78. | Devens | 5.7% | 5.1%(+0.634)#78 | 5.4%(+0.354)#11,849 |
| 79. | Holland | 5.7% | 5.1%(+0.624)#79 | 5.4%(+0.345)#11,886 |
| 80. | Danvers | 5.7% | 5.1%(+0.606)#80 | 5.4%(+0.326)#11,961 |
| 81. | Braintree Town | 5.7% | 5.1%(+0.595)#81 | 5.4%(+0.315)#12,001 |
| 82. | Mashpee Neck | 5.7% | 5.1%(+0.561)#82 | 5.4%(+0.282)#12,140 |
| 83. | Holbrook | 5.7% | 5.1%(+0.560)#83 | 5.4%(+0.281)#12,146 |
| 84. | Townsend | 5.6% | 5.1%(+0.513)#84 | 5.4%(+0.234)#12,350 |
| 85. | Milford | 5.6% | 5.1%(+0.509)#85 | 5.4%(+0.230)#12,372 |
| 86. | Revere | 5.6% | 5.1%(+0.469)#86 | 5.4%(+0.190)#12,526 |
| 87. | Palmer Town | 5.6% | 5.1%(+0.457)#87 | 5.4%(+0.178)#12,577 |
| 88. | North Scituate | 5.6% | 5.1%(+0.453)#88 | 5.4%(+0.174)#12,596 |
| 89. | Winchendon | 5.5% | 5.1%(+0.438)#89 | 5.4%(+0.159)#12,682 |
| 90. | West Concord | 5.5% | 5.1%(+0.434)#90 | 5.4%(+0.155)#12,694 |
| 91. | Pinehurst | 5.5% | 5.1%(+0.357)#91 | 5.4%(+0.077)#13,010 |
| 92. | Webster | 5.4% | 5.1%(+0.338)#92 | 5.4%(+0.059)#13,088 |
| 93. | Woburn | 5.4% | 5.1%(+0.333)#93 | 5.4%(+0.054)#13,106 |
| 94. | North Adams | 5.4% | 5.1%(+0.327)#94 | 5.4%(+0.048)#13,128 |
| 95. | Rutland | 5.4% | 5.1%(+0.306)#95 | 5.4%(+0.026)#13,210 |
| 96. | Chelsea | 5.4% | 5.1%(+0.285)#96 | 5.4%(+0.006)#13,299 |
| 97. | Abington | 5.4% | 5.1%(+0.253)#97 | 5.4%(-0.026)#13,448 |
| 98. | Springfield | 5.4% | 5.1%(+0.247)#98 | 5.4%(-0.032)#13,475 |
| 99. | Hull | 5.2% | 5.1%(+0.135)#99 | 5.4%(-0.144)#13,959 |
| 100. | Westfield | 5.2% | 5.1%(+0.077)#100 | 5.4%(-0.203)#14,225 |
Common Questions
What are the Top 10 Cities with the Highest Percentage of Population Enrolled in High School in Massachusetts?
Top 10 Cities with the Highest Percentage of Population Enrolled in High School in Massachusetts are:
#1
15.5%
#2
13.8%
#3
12.1%
#4
12.0%
#5
11.8%
#6
11.3%
#7
10.9%
#8
10.8%
#9
10.7%
#10
10.4%
What city has the Highest Percentage of Population Enrolled in High School in Massachusetts?
Groton has the Highest Percentage of Population Enrolled in High School in Massachusetts with 15.5%.
What is the Percentage of Population Enrolled in High School in the State of Massachusetts?
Percentage of Population Enrolled in High School in Massachusetts is 5.1%.
What is the Percentage of Population Enrolled in High School in the United States?
Percentage of Population Enrolled in High School in the United States is 5.4%.