Cities with the Highest Percentage of Immigrants from Latin America in Massachusetts
RELATED REPORTS & OPTIONS
Latin America
Massachusetts
Compare Cities
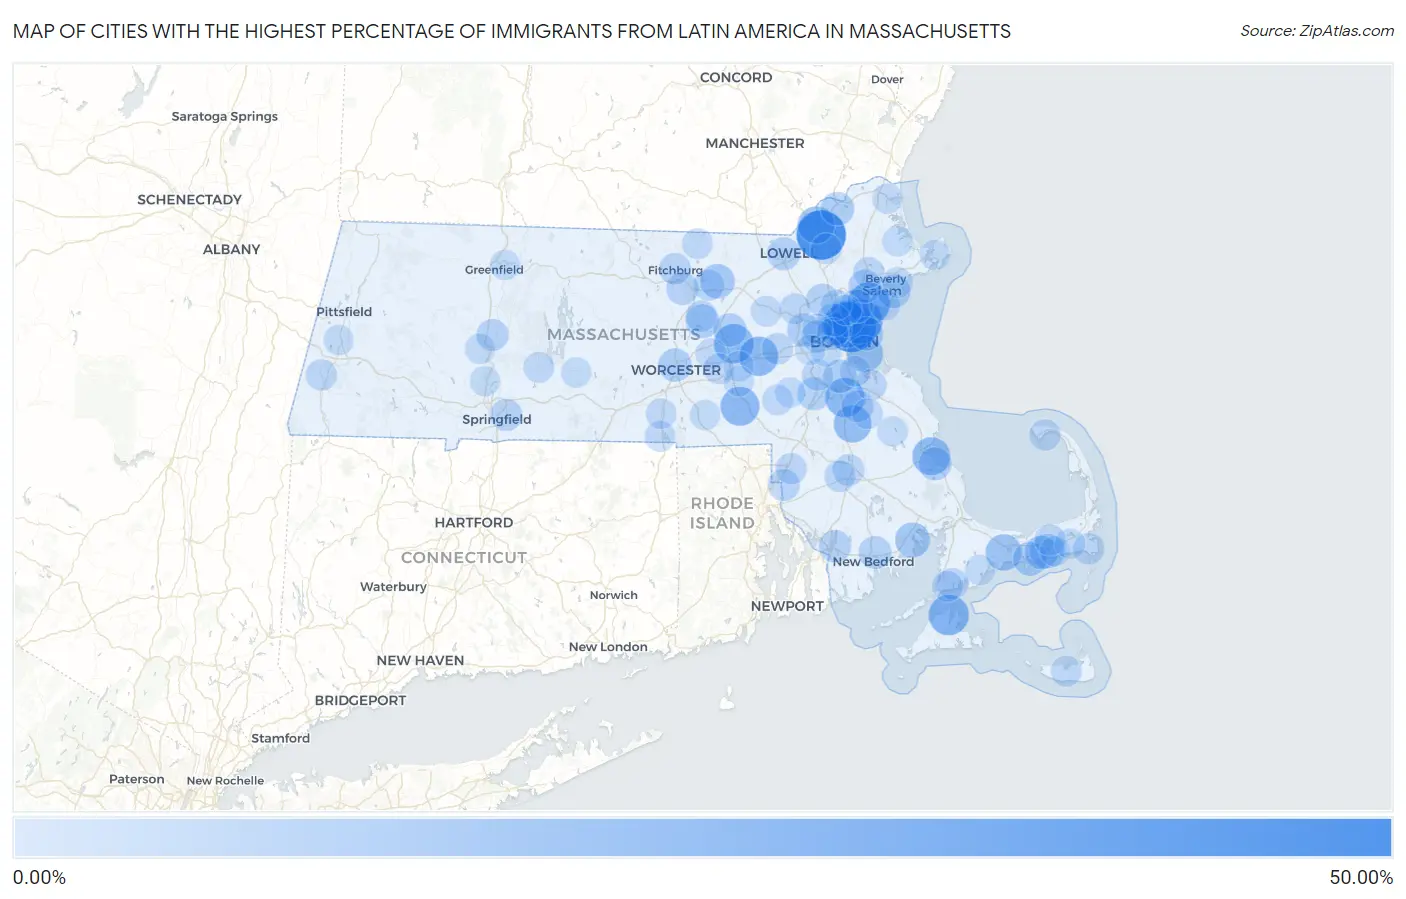
Map of Cities with the Highest Percentage of Immigrants from Latin America in Massachusetts
0.00%
50.00%
Cities with the Highest Percentage of Immigrants from Latin America in Massachusetts
| City | Latin America | vs State | vs National | |
| 1. | Chelsea | 40.05% | 6.80%(+33.2)#51 | 6.84%(+33.2)#3,005 |
| 2. | Lawrence | 39.93% | 6.80%(+33.1)#52 | 6.84%(+33.1)#3,006 |
| 3. | Everett | 32.03% | 6.80%(+25.2)#53 | 6.84%(+25.2)#3,007 |
| 4. | Revere | 30.91% | 6.80%(+24.1)#54 | 6.84%(+24.1)#3,008 |
| 5. | Lynn | 26.11% | 6.80%(+19.3)#55 | 6.84%(+19.3)#3,009 |
| 6. | Vineyard Haven | 21.80% | 6.80%(+15.0)#56 | 6.84%(+15.0)#3,010 |
| 7. | Marlborough | 20.19% | 6.80%(+13.4)#57 | 6.84%(+13.3)#3,011 |
| 8. | Randolph Town | 19.98% | 6.80%(+13.2)#58 | 6.84%(+13.1)#3,012 |
| 9. | Framingham | 19.51% | 6.80%(+12.7)#59 | 6.84%(+12.7)#3,014 |
| 10. | Milford | 19.06% | 6.80%(+12.3)#60 | 6.84%(+12.2)#3,015 |
| 11. | North Plymouth | 17.13% | 6.80%(+10.3)#61 | 6.84%(+10.3)#3,016 |
| 12. | Brockton | 16.56% | 6.80%(+9.77)#62 | 6.84%(+9.72)#3,017 |
| 13. | Methuen Town | 15.68% | 6.80%(+8.89)#63 | 6.84%(+8.84)#3,087 |
| 14. | Malden | 14.15% | 6.80%(+7.36)#64 | 6.84%(+7.31)#3,088 |
| 15. | Barnstable Town | 14.05% | 6.80%(+7.26)#65 | 6.84%(+7.21)#3,089 |
| 16. | Boston | 13.86% | 6.80%(+7.07)#66 | 6.84%(+7.02)#3,090 |
| 17. | Marion Center | 11.53% | 6.80%(+4.74)#67 | 6.84%(+4.69)#3,091 |
| 18. | Devens | 10.61% | 6.80%(+3.81)#68 | 6.84%(+3.77)#3,092 |
| 19. | West Dennis | 10.29% | 6.80%(+3.49)#69 | 6.84%(+3.44)#3,093 |
| 20. | West Yarmouth | 9.71% | 6.80%(+2.91)#70 | 6.84%(+2.87)#3,094 |
| 21. | Winthrop Town | 9.02% | 6.80%(+2.22)#71 | 6.84%(+2.18)#3,095 |
| 22. | South Yarmouth | 8.93% | 6.80%(+2.13)#72 | 6.84%(+2.09)#3,096 |
| 23. | Somerville | 8.92% | 6.80%(+2.12)#73 | 6.84%(+2.08)#3,097 |
| 24. | Salem | 8.88% | 6.80%(+2.09)#74 | 6.84%(+2.04)#3,098 |
| 25. | Clinton | 8.80% | 6.80%(+2.01)#75 | 6.84%(+1.96)#3,099 |
| 26. | Milton | 8.70% | 6.80%(+1.90)#76 | 6.84%(+1.86)#3,100 |
| 27. | Haverhill | 8.68% | 6.80%(+1.88)#77 | 6.84%(+1.84)#3,101 |
| 28. | Saugus | 8.68% | 6.80%(+1.88)#78 | 6.84%(+1.84)#3,102 |
| 29. | Worcester | 8.35% | 6.80%(+1.55)#79 | 6.84%(+1.51)#3,103 |
| 30. | Waltham | 8.26% | 6.80%(+1.47)#80 | 6.84%(+1.42)#3,104 |
| 31. | Medford | 8.13% | 6.80%(+1.34)#81 | 6.84%(+1.29)#3,105 |
| 32. | Hudson | 7.98% | 6.80%(+1.19)#82 | 6.84%(+1.14)#3,106 |
| 33. | Peabody | 7.92% | 6.80%(+1.13)#83 | 6.84%(+1.08)#3,107 |
| 34. | Plymouth | 7.70% | 6.80%(+0.905)#84 | 6.84%(+0.860)#3,108 |
| 35. | Lowell | 7.65% | 6.80%(+0.857)#85 | 6.84%(+0.812)#3,109 |
| 36. | Norwood | 7.64% | 6.80%(+0.843)#86 | 6.84%(+0.797)#3,110 |
| 37. | New Bedford | 7.37% | 6.80%(+0.576)#87 | 6.84%(+0.531)#3,146 |
| 38. | Woburn | 7.06% | 6.80%(+0.260)#88 | 6.84%(+0.214)#3,147 |
| 39. | Leominster | 6.48% | 6.80%(-0.317)#89 | 6.84%(-0.362)#3,148 |
| 40. | Fall River | 6.37% | 6.80%(-0.427)#90 | 6.84%(-0.473)#3,149 |
| 41. | Springfield | 5.98% | 6.80%(-0.818)#91 | 6.84%(-0.863)#3,187 |
| 42. | Hatfield | 5.71% | 6.80%(-1.09)#92 | 6.84%(-1.13)#3,188 |
| 43. | North Seekonk | 5.69% | 6.80%(-1.11)#93 | 6.84%(-1.15)#3,189 |
| 44. | Holbrook | 5.66% | 6.80%(-1.13)#94 | 6.84%(-1.18)#3,190 |
| 45. | Watertown Town | 5.63% | 6.80%(-1.17)#95 | 6.84%(-1.21)#3,191 |
| 46. | Cambridge | 5.24% | 6.80%(-1.55)#96 | 6.84%(-1.60)#3,192 |
| 47. | Fitchburg | 5.06% | 6.80%(-1.74)#97 | 6.84%(-1.78)#3,193 |
| 48. | West Chatham | 4.84% | 6.80%(-1.96)#98 | 6.84%(-2.00)#3,194 |
| 49. | Raynham Center | 4.79% | 6.80%(-2.01)#99 | 6.84%(-2.05)#3,195 |
| 50. | Cochituate | 4.71% | 6.80%(-2.08)#100 | 6.84%(-2.13)#3,196 |
| 51. | Taunton | 4.52% | 6.80%(-2.27)#101 | 6.84%(-2.32)#3,197 |
| 52. | South Lancaster | 4.51% | 6.80%(-2.29)#102 | 6.84%(-2.33)#3,198 |
| 53. | Shirley | 4.49% | 6.80%(-2.31)#103 | 6.84%(-2.35)#3,199 |
| 54. | Teaticket | 4.48% | 6.80%(-2.31)#104 | 6.84%(-2.36)#3,200 |
| 55. | Dedham | 4.46% | 6.80%(-2.33)#105 | 6.84%(-2.38)#3,201 |
| 56. | South Dennis | 4.29% | 6.80%(-2.51)#106 | 6.84%(-2.55)#3,202 |
| 57. | Housatonic | 4.16% | 6.80%(-2.63)#107 | 6.84%(-2.68)#3,203 |
| 58. | Provincetown | 4.14% | 6.80%(-2.66)#108 | 6.84%(-2.70)#3,204 |
| 59. | Danvers | 3.98% | 6.80%(-2.82)#109 | 6.84%(-2.86)#3,205 |
| 60. | Attleboro | 3.92% | 6.80%(-2.87)#110 | 6.84%(-2.92)#3,206 |
| 61. | Oak Bluffs | 3.88% | 6.80%(-2.92)#111 | 6.84%(-2.96)#3,207 |
| 62. | Hanscom Afb | 3.87% | 6.80%(-2.93)#112 | 6.84%(-2.97)#3,208 |
| 63. | Weymouth Town | 3.82% | 6.80%(-2.97)#113 | 6.84%(-3.02)#3,209 |
| 64. | Falmouth | 3.81% | 6.80%(-2.98)#114 | 6.84%(-3.03)#3,210 |
| 65. | Andover | 3.66% | 6.80%(-3.13)#115 | 6.84%(-3.18)#3,211 |
| 66. | Nantucket | 3.65% | 6.80%(-3.15)#116 | 6.84%(-3.20)#3,212 |
| 67. | Stoneham | 3.64% | 6.80%(-3.16)#117 | 6.84%(-3.20)#3,213 |
| 68. | Northborough | 3.62% | 6.80%(-3.17)#118 | 6.84%(-3.22)#3,214 |
| 69. | Beverly | 3.58% | 6.80%(-3.21)#119 | 6.84%(-3.26)#3,215 |
| 70. | Swampscott | 3.52% | 6.80%(-3.27)#120 | 6.84%(-3.32)#3,216 |
| 71. | Belchertown | 3.44% | 6.80%(-3.36)#121 | 6.84%(-3.40)#3,217 |
| 72. | Quincy | 3.40% | 6.80%(-3.40)#122 | 6.84%(-3.44)#3,218 |
| 73. | Webster | 3.39% | 6.80%(-3.40)#123 | 6.84%(-3.45)#3,219 |
| 74. | West Concord | 3.36% | 6.80%(-3.43)#124 | 6.84%(-3.48)#3,220 |
| 75. | Melrose | 3.36% | 6.80%(-3.43)#125 | 6.84%(-3.48)#3,221 |
| 76. | Townsend | 3.36% | 6.80%(-3.44)#126 | 6.84%(-3.48)#3,222 |
| 77. | Westborough | 3.29% | 6.80%(-3.51)#127 | 6.84%(-3.55)#3,223 |
| 78. | Millis Clicquot | 3.22% | 6.80%(-3.57)#128 | 6.84%(-3.62)#3,224 |
| 79. | Oxford | 3.07% | 6.80%(-3.73)#129 | 6.84%(-3.77)#3,225 |
| 80. | Abington | 3.02% | 6.80%(-3.78)#130 | 6.84%(-3.82)#3,226 |
| 81. | Ipswich | 2.98% | 6.80%(-3.82)#131 | 6.84%(-3.86)#3,227 |
| 82. | Gloucester | 2.93% | 6.80%(-3.87)#132 | 6.84%(-3.91)#3,228 |
| 83. | Amherst | 2.88% | 6.80%(-3.92)#133 | 6.84%(-3.97)#3,229 |
| 84. | Whitinsville | 2.86% | 6.80%(-3.94)#134 | 6.84%(-3.98)#3,230 |
| 85. | Brookline | 2.86% | 6.80%(-3.94)#135 | 6.84%(-3.98)#3,231 |
| 86. | Medfield | 2.85% | 6.80%(-3.95)#136 | 6.84%(-3.99)#3,232 |
| 87. | Ware | 2.85% | 6.80%(-3.95)#137 | 6.84%(-3.99)#3,233 |
| 88. | Cordaville | 2.81% | 6.80%(-3.99)#138 | 6.84%(-4.03)#3,234 |
| 89. | Northampton | 2.81% | 6.80%(-3.99)#139 | 6.84%(-4.03)#3,235 |
| 90. | Hopkinton | 2.70% | 6.80%(-4.10)#140 | 6.84%(-4.14)#3,236 |
| 91. | Dennis Port | 2.67% | 6.80%(-4.13)#141 | 6.84%(-4.17)#3,237 |
| 92. | Turners Falls | 2.58% | 6.80%(-4.22)#142 | 6.84%(-4.26)#3,238 |
| 93. | Holyoke | 2.58% | 6.80%(-4.22)#143 | 6.84%(-4.27)#3,239 |
| 94. | Harwich Center | 2.54% | 6.80%(-4.26)#144 | 6.84%(-4.30)#3,240 |
| 95. | Lenox | 2.50% | 6.80%(-4.29)#145 | 6.84%(-4.34)#3,241 |
| 96. | Hanson | 2.49% | 6.80%(-4.30)#146 | 6.84%(-4.35)#3,242 |
| 97. | Mashpee Neck | 2.44% | 6.80%(-4.35)#147 | 6.84%(-4.40)#3,243 |
| 98. | Newburyport | 2.39% | 6.80%(-4.41)#148 | 6.84%(-4.45)#3,244 |
| 99. | Belmont | 2.36% | 6.80%(-4.43)#149 | 6.84%(-4.48)#3,245 |
| 100. | Newton | 2.32% | 6.80%(-4.48)#150 | 6.84%(-4.52)#3,246 |
Common Questions
What are the Top 10 Cities with the Highest Percentage of Immigrants from Latin America in Massachusetts?
Top 10 Cities with the Highest Percentage of Immigrants from Latin America in Massachusetts are:
#1
40.05%
#2
39.93%
#3
32.03%
#4
30.91%
#5
26.11%
#6
21.80%
#7
20.19%
#8
19.98%
#9
19.51%
#10
19.06%
What city has the Highest Percentage of Immigrants from Latin America in Massachusetts?
Chelsea has the Highest Percentage of Immigrants from Latin America in Massachusetts with 40.05%.
What is the Percentage of Immigrants from Latin America in the State of Massachusetts?
Percentage of Immigrants from Latin America in Massachusetts is 6.80%.
What is the Percentage of Immigrants from Latin America in the United States?
Percentage of Immigrants from Latin America in the United States is 6.84%.