Cities with the Most Immigrants from Trinidad and Tobago in Massachusetts
RELATED REPORTS & OPTIONS
Trinidad and Tobago
Massachusetts
Compare Cities
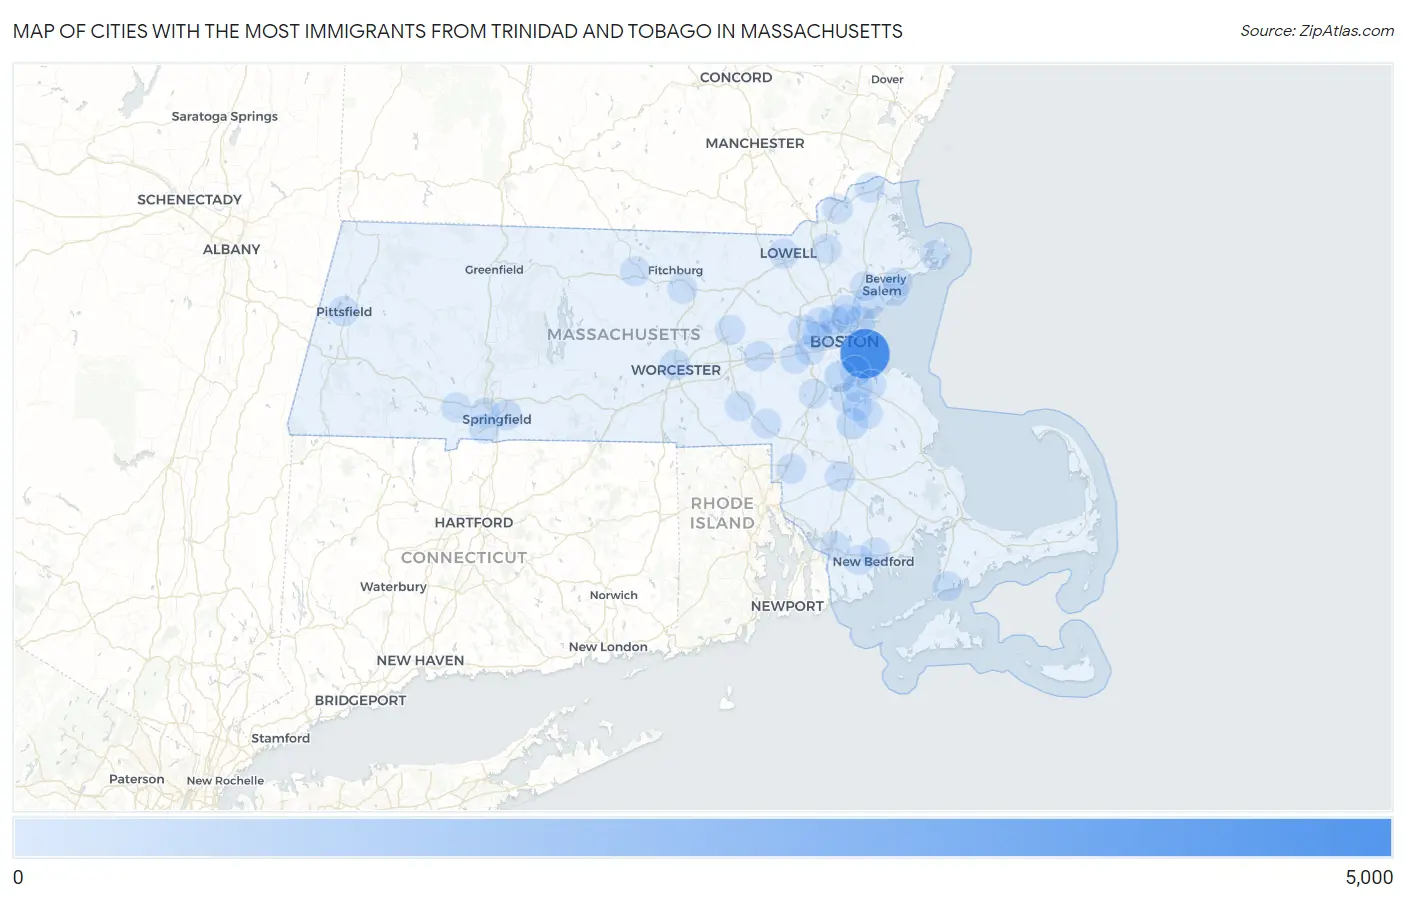
Map of Cities with the Most Immigrants from Trinidad and Tobago in Massachusetts
0
5,000
Cities with the Most Immigrants from Trinidad and Tobago in Massachusetts
| City | Trinidad and Tobago | vs State | vs National | |
| 1. | Boston | 4,459 | 6,999(63.71%)#1 | 231,222(1.93%)#2 |
| 2. | Milton | 271 | 6,999(3.87%)#2 | 231,222(0.12%)#78 |
| 3. | Brockton | 270 | 6,999(3.86%)#3 | 231,222(0.12%)#79 |
| 4. | Quincy | 177 | 6,999(2.53%)#4 | 231,222(0.08%)#134 |
| 5. | Revere | 175 | 6,999(2.50%)#5 | 231,222(0.08%)#138 |
| 6. | Springfield | 145 | 6,999(2.07%)#6 | 231,222(0.06%)#169 |
| 7. | Worcester | 126 | 6,999(1.80%)#7 | 231,222(0.05%)#202 |
| 8. | Lynn | 96 | 6,999(1.37%)#8 | 231,222(0.04%)#285 |
| 9. | Framingham | 85 | 6,999(1.21%)#9 | 231,222(0.04%)#329 |
| 10. | Cambridge | 82 | 6,999(1.17%)#10 | 231,222(0.04%)#339 |
| 11. | Waltham | 69 | 6,999(0.99%)#11 | 231,222(0.03%)#417 |
| 12. | Medford | 40 | 6,999(0.57%)#12 | 231,222(0.02%)#611 |
| 13. | Taunton | 39 | 6,999(0.56%)#13 | 231,222(0.02%)#619 |
| 14. | New Bedford | 36 | 6,999(0.51%)#14 | 231,222(0.02%)#664 |
| 15. | Leominster | 36 | 6,999(0.51%)#15 | 231,222(0.02%)#670 |
| 16. | Randolph Town | 36 | 6,999(0.51%)#16 | 231,222(0.02%)#673 |
| 17. | Newton | 34 | 6,999(0.49%)#17 | 231,222(0.01%)#695 |
| 18. | Peabody | 34 | 6,999(0.49%)#18 | 231,222(0.01%)#696 |
| 19. | Fall River | 33 | 6,999(0.47%)#19 | 231,222(0.01%)#714 |
| 20. | Hudson | 29 | 6,999(0.41%)#20 | 231,222(0.01%)#783 |
| 21. | Watertown Town | 26 | 6,999(0.37%)#21 | 231,222(0.01%)#834 |
| 22. | Holbrook | 26 | 6,999(0.37%)#22 | 231,222(0.01%)#841 |
| 23. | Pittsfield | 22 | 6,999(0.31%)#23 | 231,222(0.01%)#927 |
| 24. | Lowell | 21 | 6,999(0.30%)#24 | 231,222(0.01%)#946 |
| 25. | Attleboro | 19 | 6,999(0.27%)#25 | 231,222(0.01%)#994 |
| 26. | Andover | 16 | 6,999(0.23%)#26 | 231,222(0.01%)#1,113 |
| 27. | Smith Mills | 14 | 6,999(0.20%)#27 | 231,222(0.01%)#1,196 |
| 28. | Haverhill | 13 | 6,999(0.19%)#28 | 231,222(0.01%)#1,204 |
| 29. | Melrose | 13 | 6,999(0.19%)#29 | 231,222(0.01%)#1,210 |
| 30. | Salem | 12 | 6,999(0.17%)#30 | 231,222(0.01%)#1,238 |
| 31. | Braintree Town | 12 | 6,999(0.17%)#31 | 231,222(0.01%)#1,240 |
| 32. | Wellesley | 11 | 6,999(0.16%)#32 | 231,222(0.00%)#1,294 |
| 33. | Amesbury Town | 11 | 6,999(0.16%)#33 | 231,222(0.00%)#1,304 |
| 34. | Weymouth Town | 10 | 6,999(0.14%)#34 | 231,222(0.00%)#1,329 |
| 35. | Beverly | 10 | 6,999(0.14%)#35 | 231,222(0.00%)#1,334 |
| 36. | Westfield | 10 | 6,999(0.14%)#36 | 231,222(0.00%)#1,336 |
| 37. | Norwood | 10 | 6,999(0.14%)#37 | 231,222(0.00%)#1,341 |
| 38. | Gloucester | 9 | 6,999(0.13%)#38 | 231,222(0.00%)#1,392 |
| 39. | Milford | 9 | 6,999(0.13%)#39 | 231,222(0.00%)#1,393 |
| 40. | Abington | 9 | 6,999(0.13%)#40 | 231,222(0.00%)#1,397 |
| 41. | Gardner | 8 | 6,999(0.11%)#41 | 231,222(0.00%)#1,439 |
| 42. | Franklin Town | 7 | 6,999(0.10%)#42 | 231,222(0.00%)#1,470 |
| 43. | West Springfield Town | 7 | 6,999(0.10%)#43 | 231,222(0.00%)#1,473 |
| 44. | Falmouth | 7 | 6,999(0.10%)#44 | 231,222(0.00%)#1,507 |
| 45. | Arlington | 6 | 6,999(0.09%)#45 | 231,222(0.00%)#1,524 |
| 46. | Agawam Town | 5 | 6,999(0.07%)#46 | 231,222(0.00%)#1,577 |
| 47. | Malden | 1 | 6,999(0.01%)#47 | 231,222(0.00%)#1,698 |
Common Questions
What are the Top 10 Cities with the Most Immigrants from Trinidad and Tobago in Massachusetts?
Top 10 Cities with the Most Immigrants from Trinidad and Tobago in Massachusetts are:
#1
4,459
#2
271
#3
270
#4
177
#5
175
#6
145
#7
126
#8
96
#9
85
#10
82
What city has the Most Immigrants from Trinidad and Tobago in Massachusetts?
Boston has the Most Immigrants from Trinidad and Tobago in Massachusetts with 4,459.
What is the Total Immigrants from Trinidad and Tobago in the State of Massachusetts?
Total Immigrants from Trinidad and Tobago in Massachusetts is 6,999.
What is the Total Immigrants from Trinidad and Tobago in the United States?
Total Immigrants from Trinidad and Tobago in the United States is 231,222.