Cities with the Most Immigrants from France in Massachusetts
RELATED REPORTS & OPTIONS
France
Massachusetts
Compare Cities
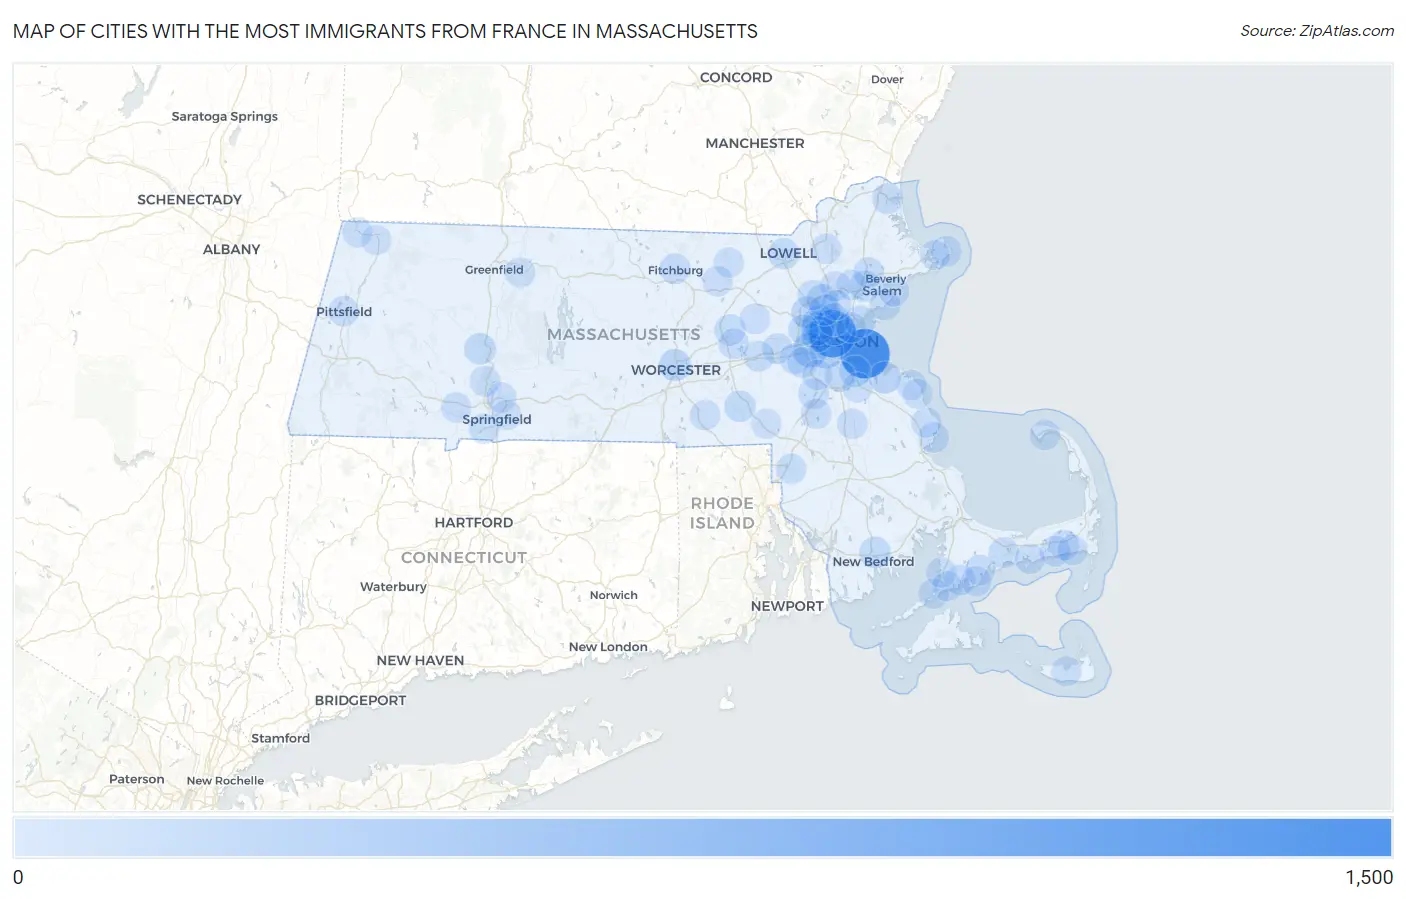
Map of Cities with the Most Immigrants from France in Massachusetts
0
1,500
Cities with the Most Immigrants from France in Massachusetts
| City | France | vs State | vs National | |
| 1. | Boston | 1,217 | 7,364(16.53%)#1 | 184,998(0.66%)#10 |
| 2. | Cambridge | 1,076 | 7,364(14.61%)#2 | 184,998(0.58%)#14 |
| 3. | Newton | 279 | 7,364(3.79%)#3 | 184,998(0.15%)#65 |
| 4. | Brookline | 256 | 7,364(3.48%)#4 | 184,998(0.14%)#77 |
| 5. | Arlington | 250 | 7,364(3.39%)#5 | 184,998(0.14%)#82 |
| 6. | Somerville | 194 | 7,364(2.63%)#6 | 184,998(0.10%)#117 |
| 7. | Belmont | 182 | 7,364(2.47%)#7 | 184,998(0.10%)#133 |
| 8. | Medford | 142 | 7,364(1.93%)#8 | 184,998(0.08%)#183 |
| 9. | Lexington | 128 | 7,364(1.74%)#9 | 184,998(0.07%)#205 |
| 10. | Hingham | 118 | 7,364(1.60%)#10 | 184,998(0.06%)#223 |
| 11. | Worcester | 113 | 7,364(1.53%)#11 | 184,998(0.06%)#231 |
| 12. | Woburn | 104 | 7,364(1.41%)#12 | 184,998(0.06%)#253 |
| 13. | New Bedford | 84 | 7,364(1.14%)#13 | 184,998(0.05%)#315 |
| 14. | Watertown Town | 79 | 7,364(1.07%)#14 | 184,998(0.04%)#337 |
| 15. | Quincy | 78 | 7,364(1.06%)#15 | 184,998(0.04%)#342 |
| 16. | Northampton | 78 | 7,364(1.06%)#16 | 184,998(0.04%)#345 |
| 17. | Winchester | 78 | 7,364(1.06%)#17 | 184,998(0.04%)#346 |
| 18. | Revere | 75 | 7,364(1.02%)#18 | 184,998(0.04%)#357 |
| 19. | Milford | 74 | 7,364(1.00%)#19 | 184,998(0.04%)#363 |
| 20. | Peabody | 68 | 7,364(0.92%)#20 | 184,998(0.04%)#401 |
| 21. | Hudson | 64 | 7,364(0.87%)#21 | 184,998(0.03%)#429 |
| 22. | Lowell | 63 | 7,364(0.86%)#22 | 184,998(0.03%)#431 |
| 23. | Waltham | 56 | 7,364(0.76%)#23 | 184,998(0.03%)#489 |
| 24. | Amherst | 55 | 7,364(0.75%)#24 | 184,998(0.03%)#506 |
| 25. | Milton | 49 | 7,364(0.67%)#25 | 184,998(0.03%)#560 |
| 26. | Fitchburg | 41 | 7,364(0.56%)#26 | 184,998(0.02%)#654 |
| 27. | Norwood | 41 | 7,364(0.56%)#27 | 184,998(0.02%)#657 |
| 28. | Wellesley | 41 | 7,364(0.56%)#28 | 184,998(0.02%)#658 |
| 29. | Swampscott | 40 | 7,364(0.54%)#29 | 184,998(0.02%)#680 |
| 30. | Newburyport | 38 | 7,364(0.52%)#30 | 184,998(0.02%)#701 |
| 31. | Danvers | 36 | 7,364(0.49%)#31 | 184,998(0.02%)#742 |
| 32. | Cochituate | 34 | 7,364(0.46%)#32 | 184,998(0.02%)#790 |
| 33. | East Falmouth | 33 | 7,364(0.45%)#33 | 184,998(0.02%)#810 |
| 34. | Barnstable Town | 32 | 7,364(0.43%)#34 | 184,998(0.02%)#815 |
| 35. | Dennis Port | 32 | 7,364(0.43%)#35 | 184,998(0.02%)#826 |
| 36. | Framingham | 31 | 7,364(0.42%)#36 | 184,998(0.02%)#833 |
| 37. | Maynard | 29 | 7,364(0.39%)#37 | 184,998(0.02%)#886 |
| 38. | Holyoke | 28 | 7,364(0.38%)#38 | 184,998(0.02%)#899 |
| 39. | Marlborough | 25 | 7,364(0.34%)#39 | 184,998(0.01%)#984 |
| 40. | Sharon | 25 | 7,364(0.34%)#40 | 184,998(0.01%)#1,000 |
| 41. | Rockport | 25 | 7,364(0.34%)#41 | 184,998(0.01%)#1,001 |
| 42. | Needham | 24 | 7,364(0.33%)#42 | 184,998(0.01%)#1,016 |
| 43. | Northwest Harwich | 24 | 7,364(0.33%)#43 | 184,998(0.01%)#1,044 |
| 44. | Devens | 24 | 7,364(0.33%)#44 | 184,998(0.01%)#1,051 |
| 45. | North Attleborough | 23 | 7,364(0.31%)#45 | 184,998(0.01%)#1,063 |
| 46. | Brockton | 20 | 7,364(0.27%)#46 | 184,998(0.01%)#1,162 |
| 47. | Dedham | 20 | 7,364(0.27%)#47 | 184,998(0.01%)#1,173 |
| 48. | Duxbury | 20 | 7,364(0.27%)#48 | 184,998(0.01%)#1,197 |
| 49. | Andover | 18 | 7,364(0.24%)#49 | 184,998(0.01%)#1,274 |
| 50. | Whitinsville | 18 | 7,364(0.24%)#50 | 184,998(0.01%)#1,283 |
| 51. | Salem | 17 | 7,364(0.23%)#51 | 184,998(0.01%)#1,304 |
| 52. | Pittsfield | 17 | 7,364(0.23%)#52 | 184,998(0.01%)#1,305 |
| 53. | Burlington | 17 | 7,364(0.23%)#53 | 184,998(0.01%)#1,316 |
| 54. | Mashpee Neck | 17 | 7,364(0.23%)#54 | 184,998(0.01%)#1,359 |
| 55. | Reading | 15 | 7,364(0.20%)#55 | 184,998(0.01%)#1,455 |
| 56. | Provincetown | 15 | 7,364(0.20%)#56 | 184,998(0.01%)#1,486 |
| 57. | Attleboro | 14 | 7,364(0.19%)#57 | 184,998(0.01%)#1,513 |
| 58. | Woods Hole | 14 | 7,364(0.19%)#58 | 184,998(0.01%)#1,565 |
| 59. | Westfield | 13 | 7,364(0.18%)#59 | 184,998(0.01%)#1,584 |
| 60. | Harwich Port | 13 | 7,364(0.18%)#60 | 184,998(0.01%)#1,636 |
| 61. | Chicopee | 12 | 7,364(0.16%)#61 | 184,998(0.01%)#1,645 |
| 62. | Chelsea | 12 | 7,364(0.16%)#62 | 184,998(0.01%)#1,655 |
| 63. | Lynnfield | 12 | 7,364(0.16%)#63 | 184,998(0.01%)#1,683 |
| 64. | West Yarmouth | 12 | 7,364(0.16%)#64 | 184,998(0.01%)#1,698 |
| 65. | Marshfield | 12 | 7,364(0.16%)#65 | 184,998(0.01%)#1,704 |
| 66. | Agawam Town | 11 | 7,364(0.15%)#66 | 184,998(0.01%)#1,736 |
| 67. | Greenfield | 10 | 7,364(0.14%)#67 | 184,998(0.01%)#1,850 |
| 68. | North Adams | 10 | 7,364(0.14%)#68 | 184,998(0.01%)#1,865 |
| 69. | North Scituate | 10 | 7,364(0.14%)#69 | 184,998(0.01%)#1,886 |
| 70. | New Seabury | 10 | 7,364(0.14%)#70 | 184,998(0.01%)#1,913 |
| 71. | Williamstown | 9 | 7,364(0.12%)#71 | 184,998(0.00%)#1,980 |
| 72. | Falmouth | 9 | 7,364(0.12%)#72 | 184,998(0.00%)#1,984 |
| 73. | Stoneham | 8 | 7,364(0.11%)#73 | 184,998(0.00%)#2,045 |
| 74. | Springfield | 6 | 7,364(0.08%)#74 | 184,998(0.00%)#2,205 |
| 75. | Braintree Town | 6 | 7,364(0.08%)#75 | 184,998(0.00%)#2,224 |
| 76. | Scituate | 6 | 7,364(0.08%)#76 | 184,998(0.00%)#2,268 |
| 77. | Groton | 6 | 7,364(0.08%)#77 | 184,998(0.00%)#2,293 |
| 78. | Nantucket | 5 | 7,364(0.07%)#78 | 184,998(0.00%)#2,344 |
| 79. | Gloucester | 4 | 7,364(0.05%)#79 | 184,998(0.00%)#2,397 |
| 80. | Millers Falls | 4 | 7,364(0.05%)#80 | 184,998(0.00%)#2,457 |
| 81. | West Falmouth | 3 | 7,364(0.04%)#81 | 184,998(0.00%)#2,514 |
| 82. | Franklin Town | 1 | 7,364(0.01%)#82 | 184,998(0.00%)#2,621 |
Common Questions
What are the Top 10 Cities with the Most Immigrants from France in Massachusetts?
Top 10 Cities with the Most Immigrants from France in Massachusetts are:
What city has the Most Immigrants from France in Massachusetts?
Boston has the Most Immigrants from France in Massachusetts with 1,217.
What is the Total Immigrants from France in the State of Massachusetts?
Total Immigrants from France in Massachusetts is 7,364.
What is the Total Immigrants from France in the United States?
Total Immigrants from France in the United States is 184,998.