Cities with the Highest Percentage of Households with Income Above $100,000 in Massachusetts
RELATED REPORTS & OPTIONS
Household Income | $100k+
Massachusetts
Compare Cities
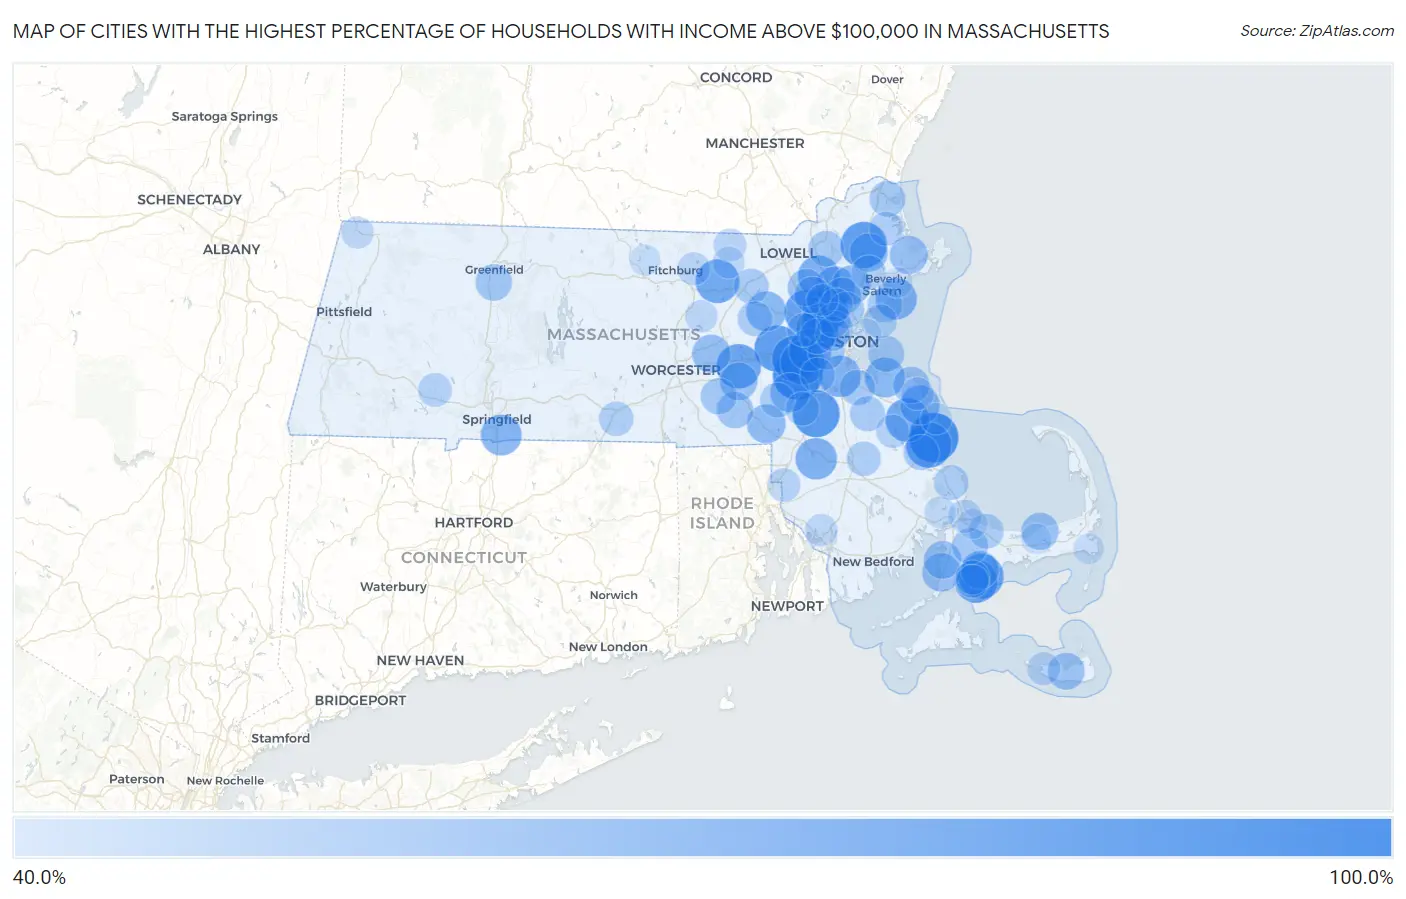
Map of Cities with the Highest Percentage of Households with Income Above $100,000 in Massachusetts
0.0%
100.0%
Cities with the Highest Percentage of Households with Income Above $100,000 in Massachusetts
| City | Households with Income > $100k | vs State | vs National | |
| 1. | Duxbury | 83.5% | 48.6%(+34.9)#1 | 37.3%(+46.2)#387 |
| 2. | Dover | 83.3% | 48.6%(+34.7)#2 | 37.3%(+46.0)#398 |
| 3. | Cedar Crest | 81.2% | 48.6%(+32.6)#3 | 37.3%(+43.9)#491 |
| 4. | Sharon | 79.2% | 48.6%(+30.6)#4 | 37.3%(+41.9)#598 |
| 5. | Cochituate | 77.6% | 48.6%(+29.0)#5 | 37.3%(+40.3)#714 |
| 6. | Boxford | 77.6% | 48.6%(+29.0)#6 | 37.3%(+40.3)#716 |
| 7. | Wellesley | 77.4% | 48.6%(+28.8)#7 | 37.3%(+40.1)#732 |
| 8. | Lexington | 77.0% | 48.6%(+28.4)#8 | 37.3%(+39.7)#765 |
| 9. | South Duxbury | 76.3% | 48.6%(+27.7)#9 | 37.3%(+39.0)#799 |
| 10. | Winchester | 75.8% | 48.6%(+27.2)#10 | 37.3%(+38.5)#826 |
| 11. | Popponesset Island | 75.0% | 48.6%(+26.4)#11 | 37.3%(+37.7)#906 |
| 12. | Cordaville | 74.5% | 48.6%(+25.9)#12 | 37.3%(+37.2)#936 |
| 13. | Needham | 74.3% | 48.6%(+25.7)#13 | 37.3%(+37.0)#953 |
| 14. | North Pembroke | 73.5% | 48.6%(+24.9)#14 | 37.3%(+36.2)#1,026 |
| 15. | Devens | 73.4% | 48.6%(+24.8)#15 | 37.3%(+36.1)#1,037 |
| 16. | New Seabury | 72.2% | 48.6%(+23.6)#16 | 37.3%(+34.9)#1,138 |
| 17. | Belmont | 71.2% | 48.6%(+22.6)#17 | 37.3%(+33.9)#1,228 |
| 18. | Newton | 70.8% | 48.6%(+22.2)#18 | 37.3%(+33.5)#1,262 |
| 19. | Wilmington | 69.6% | 48.6%(+21.0)#19 | 37.3%(+32.3)#1,366 |
| 20. | Milton | 69.3% | 48.6%(+20.7)#20 | 37.3%(+32.0)#1,401 |
| 21. | Norton Center | 69.1% | 48.6%(+20.5)#21 | 37.3%(+31.8)#1,431 |
| 22. | Marblehead | 68.9% | 48.6%(+20.3)#22 | 37.3%(+31.6)#1,452 |
| 23. | Longmeadow | 68.0% | 48.6%(+19.4)#23 | 37.3%(+30.7)#1,566 |
| 24. | West Concord | 66.5% | 48.6%(+17.9)#24 | 37.3%(+29.2)#1,748 |
| 25. | Hingham | 66.3% | 48.6%(+17.7)#25 | 37.3%(+29.0)#1,779 |
| 26. | Green Harbor | 66.2% | 48.6%(+17.6)#26 | 37.3%(+28.9)#1,797 |
| 27. | Reading | 65.9% | 48.6%(+17.3)#27 | 37.3%(+28.6)#1,823 |
| 28. | Marshfield Hills | 65.7% | 48.6%(+17.1)#28 | 37.3%(+28.4)#1,856 |
| 29. | Medfield | 65.5% | 48.6%(+16.9)#29 | 37.3%(+28.2)#1,876 |
| 30. | Lynnfield | 64.9% | 48.6%(+16.3)#30 | 37.3%(+27.6)#1,945 |
| 31. | Franklin Town | 64.5% | 48.6%(+15.9)#31 | 37.3%(+27.2)#1,989 |
| 32. | Northborough | 63.6% | 48.6%(+15.0)#32 | 37.3%(+26.3)#2,117 |
| 33. | Topsfield | 63.4% | 48.6%(+14.8)#33 | 37.3%(+26.1)#2,146 |
| 34. | West Falmouth | 63.3% | 48.6%(+14.7)#34 | 37.3%(+26.0)#2,159 |
| 35. | Essex | 63.1% | 48.6%(+14.5)#35 | 37.3%(+25.8)#2,194 |
| 36. | Arlington | 63.0% | 48.6%(+14.4)#36 | 37.3%(+25.7)#2,203 |
| 37. | Mashpee Neck | 62.7% | 48.6%(+14.1)#37 | 37.3%(+25.4)#2,270 |
| 38. | Hopkinton | 62.4% | 48.6%(+13.8)#38 | 37.3%(+25.1)#2,318 |
| 39. | North Falmouth | 62.4% | 48.6%(+13.8)#39 | 37.3%(+25.1)#2,319 |
| 40. | Wakefield | 62.0% | 48.6%(+13.4)#40 | 37.3%(+24.7)#2,380 |
| 41. | Dennis | 61.7% | 48.6%(+13.1)#41 | 37.3%(+24.4)#2,440 |
| 42. | Pinehurst | 61.6% | 48.6%(+13.0)#42 | 37.3%(+24.3)#2,453 |
| 43. | Nantucket | 61.1% | 48.6%(+12.5)#43 | 37.3%(+23.8)#2,544 |
| 44. | Brookline | 60.7% | 48.6%(+12.1)#44 | 37.3%(+23.4)#2,608 |
| 45. | North Scituate | 60.7% | 48.6%(+12.1)#45 | 37.3%(+23.4)#2,613 |
| 46. | Burlington | 60.6% | 48.6%(+12.0)#46 | 37.3%(+23.3)#2,624 |
| 47. | Hopedale | 60.5% | 48.6%(+11.9)#47 | 37.3%(+23.2)#2,652 |
| 48. | Deerfield | 60.3% | 48.6%(+11.7)#48 | 37.3%(+23.0)#2,686 |
| 49. | Upton | 59.9% | 48.6%(+11.3)#49 | 37.3%(+22.6)#2,758 |
| 50. | Hull | 59.7% | 48.6%(+11.1)#50 | 37.3%(+22.4)#2,788 |
| 51. | Melrose | 59.5% | 48.6%(+10.9)#51 | 37.3%(+22.2)#2,824 |
| 52. | Forestdale | 59.4% | 48.6%(+10.8)#52 | 37.3%(+22.1)#2,851 |
| 53. | Somerville | 59.2% | 48.6%(+10.6)#53 | 37.3%(+21.9)#2,871 |
| 54. | Andover | 59.2% | 48.6%(+10.6)#54 | 37.3%(+21.9)#2,877 |
| 55. | Newburyport | 59.0% | 48.6%(+10.4)#55 | 37.3%(+21.7)#2,911 |
| 56. | Watertown Town | 58.8% | 48.6%(+10.2)#56 | 37.3%(+21.5)#2,939 |
| 57. | Braintree Town | 58.4% | 48.6%(+9.80)#57 | 37.3%(+21.1)#3,005 |
| 58. | Kingston | 58.4% | 48.6%(+9.80)#58 | 37.3%(+21.1)#3,013 |
| 59. | Abington | 57.9% | 48.6%(+9.30)#59 | 37.3%(+20.6)#3,081 |
| 60. | Littleton Common | 57.9% | 48.6%(+9.30)#60 | 37.3%(+20.6)#3,086 |
| 61. | Millis Clicquot | 57.6% | 48.6%(+9.00)#61 | 37.3%(+20.3)#3,133 |
| 62. | Swampscott | 57.5% | 48.6%(+8.90)#62 | 37.3%(+20.2)#3,147 |
| 63. | East Sandwich | 57.5% | 48.6%(+8.90)#63 | 37.3%(+20.2)#3,150 |
| 64. | Dedham | 57.3% | 48.6%(+8.70)#64 | 37.3%(+20.0)#3,181 |
| 65. | Maynard | 57.2% | 48.6%(+8.60)#65 | 37.3%(+19.9)#3,201 |
| 66. | The Pinehills | 57.2% | 48.6%(+8.60)#66 | 37.3%(+19.9)#3,205 |
| 67. | Cambridge | 57.0% | 48.6%(+8.40)#67 | 37.3%(+19.7)#3,229 |
| 68. | Medford | 57.0% | 48.6%(+8.40)#68 | 37.3%(+19.7)#3,231 |
| 69. | Sturbridge | 56.9% | 48.6%(+8.30)#69 | 37.3%(+19.6)#3,258 |
| 70. | Danvers | 56.8% | 48.6%(+8.20)#70 | 37.3%(+19.5)#3,267 |
| 71. | Bridgewater Town | 56.7% | 48.6%(+8.10)#71 | 37.3%(+19.4)#3,285 |
| 72. | Rowley | 56.1% | 48.6%(+7.50)#72 | 37.3%(+18.8)#3,406 |
| 73. | Seabrook | 56.1% | 48.6%(+7.50)#73 | 37.3%(+18.8)#3,408 |
| 74. | Russell | 55.7% | 48.6%(+7.10)#74 | 37.3%(+18.4)#3,480 |
| 75. | Walpole | 55.6% | 48.6%(+7.00)#75 | 37.3%(+18.3)#3,489 |
| 76. | Nahant | 55.5% | 48.6%(+6.90)#76 | 37.3%(+18.2)#3,511 |
| 77. | Waltham | 55.2% | 48.6%(+6.60)#77 | 37.3%(+17.9)#3,562 |
| 78. | North Seekonk | 54.8% | 48.6%(+6.20)#78 | 37.3%(+17.5)#3,651 |
| 79. | Stoneham | 54.7% | 48.6%(+6.10)#79 | 37.3%(+17.4)#3,667 |
| 80. | Sagamore | 54.7% | 48.6%(+6.10)#80 | 37.3%(+17.4)#3,674 |
| 81. | Hanson | 54.6% | 48.6%(+6.00)#81 | 37.3%(+17.3)#3,694 |
| 82. | Monomoscoy Island | 54.3% | 48.6%(+5.70)#82 | 37.3%(+17.0)#3,761 |
| 83. | Madaket | 54.2% | 48.6%(+5.60)#83 | 37.3%(+16.9)#3,784 |
| 84. | Lunenburg | 54.1% | 48.6%(+5.50)#84 | 37.3%(+16.8)#3,796 |
| 85. | East Pepperell | 53.8% | 48.6%(+5.20)#85 | 37.3%(+16.5)#3,851 |
| 86. | Scituate | 53.7% | 48.6%(+5.10)#86 | 37.3%(+16.4)#3,872 |
| 87. | South Lancaster | 53.2% | 48.6%(+4.60)#87 | 37.3%(+15.9)#3,983 |
| 88. | North Attleborough | 52.9% | 48.6%(+4.30)#88 | 37.3%(+15.6)#4,025 |
| 89. | Somerset | 52.9% | 48.6%(+4.30)#89 | 37.3%(+15.6)#4,027 |
| 90. | Williamstown | 52.9% | 48.6%(+4.30)#90 | 37.3%(+15.6)#4,035 |
| 91. | Groton | 52.5% | 48.6%(+3.90)#91 | 37.3%(+15.2)#4,125 |
| 92. | Woburn | 52.0% | 48.6%(+3.40)#92 | 37.3%(+14.7)#4,245 |
| 93. | White Island Shores | 52.0% | 48.6%(+3.40)#93 | 37.3%(+14.7)#4,254 |
| 94. | Ocean Bluff Brant Rock | 51.7% | 48.6%(+3.10)#94 | 37.3%(+14.4)#4,313 |
| 95. | South Ashburnham | 51.1% | 48.6%(+2.50)#95 | 37.3%(+13.8)#4,459 |
| 96. | West Chatham | 50.6% | 48.6%(+2.00)#96 | 37.3%(+13.3)#4,571 |
| 97. | Yarmouth Port | 50.1% | 48.6%(+1.50)#97 | 37.3%(+12.8)#4,666 |
| 98. | Beverly | 49.7% | 48.6%(+1.10)#98 | 37.3%(+12.4)#4,815 |
| 99. | Sandwich | 49.7% | 48.6%(+1.10)#99 | 37.3%(+12.4)#4,828 |
| 100. | Winthrop Town | 49.4% | 48.6%(+0.800)#100 | 37.3%(+12.1)#4,897 |
Common Questions
What are the Top 10 Cities with the Highest Percentage of Households with Income Above $100,000 in Massachusetts?
Top 10 Cities with the Highest Percentage of Households with Income Above $100,000 in Massachusetts are:
#1
83.5%
#2
83.3%
#3
79.2%
#4
77.6%
#5
77.6%
#6
77.4%
#7
77.0%
#8
76.3%
#9
75.8%
#10
75.0%
What city has the Highest Percentage of Households with Income Above $100,000 in Massachusetts?
Duxbury has the Highest Percentage of Households with Income Above $100,000 in Massachusetts with 83.5%.
What is the Percentage of Households with Income Above $100,000 in the State of Massachusetts?
Percentage of Households with Income Above $100,000 in Massachusetts is 48.6%.
What is the Percentage of Households with Income Above $100,000 in the United States?
Percentage of Households with Income Above $100,000 in the United States is 37.3%.