Cities with the Highest Percentage of Immigrants from Asia in Massachusetts
RELATED REPORTS & OPTIONS
Asia
Massachusetts
Compare Cities
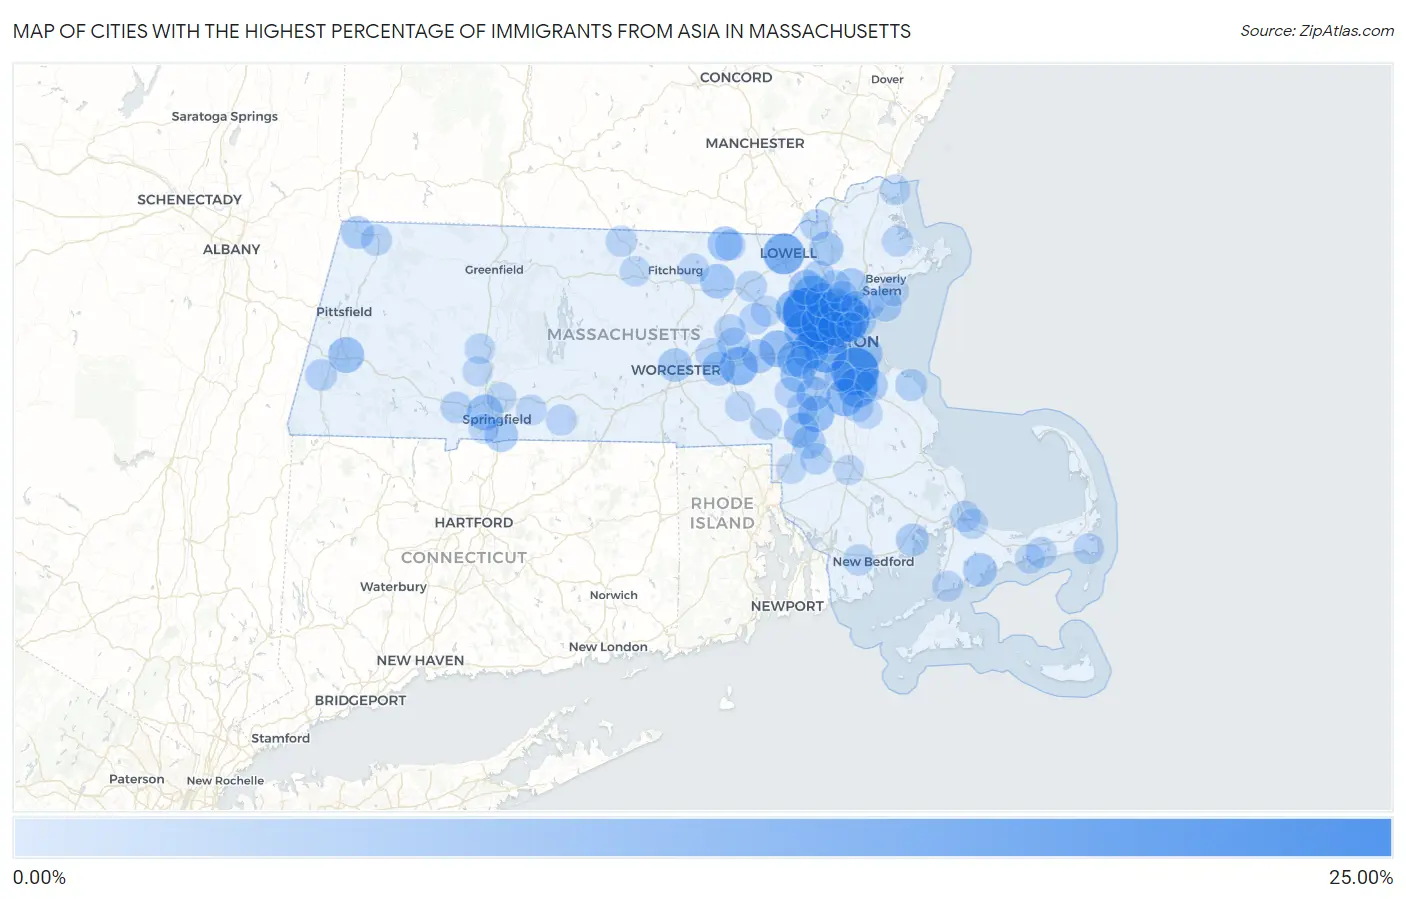
Map of Cities with the Highest Percentage of Immigrants from Asia in Massachusetts
0.00%
25.00%
Cities with the Highest Percentage of Immigrants from Asia in Massachusetts
| City | Asia | vs State | vs National | |
| 1. | Lexington | 24.17% | 5.37%(+18.8)#1 | 4.26%(+19.9)#191 |
| 2. | Quincy | 21.75% | 5.37%(+16.4)#2 | 4.26%(+17.5)#240 |
| 3. | Malden | 20.77% | 5.37%(+15.4)#3 | 4.26%(+16.5)#258 |
| 4. | Brookline | 16.46% | 5.37%(+11.1)#4 | 4.26%(+12.2)#413 |
| 5. | Belmont | 14.73% | 5.37%(+9.37)#5 | 4.26%(+10.5)#501 |
| 6. | Lowell | 14.31% | 5.37%(+8.94)#6 | 4.26%(+10.1)#519 |
| 7. | Cambridge | 14.01% | 5.37%(+8.64)#7 | 4.26%(+9.75)#541 |
| 8. | West Warren | 13.56% | 5.37%(+8.19)#8 | 4.26%(+9.30)#568 |
| 9. | Braintree Town | 13.33% | 5.37%(+7.96)#9 | 4.26%(+9.07)#591 |
| 10. | Burlington | 11.97% | 5.37%(+6.61)#10 | 4.26%(+7.71)#688 |
| 11. | Watertown Town | 11.81% | 5.37%(+6.44)#11 | 4.26%(+7.55)#706 |
| 12. | Waltham | 11.43% | 5.37%(+6.06)#12 | 4.26%(+7.17)#738 |
| 13. | Hanscom Afb | 11.10% | 5.37%(+5.73)#13 | 4.26%(+6.84)#773 |
| 14. | Cordaville | 11.10% | 5.37%(+5.73)#14 | 4.26%(+6.84)#774 |
| 15. | Randolph Town | 10.54% | 5.37%(+5.17)#15 | 4.26%(+6.28)#844 |
| 16. | Newton | 10.33% | 5.37%(+4.96)#16 | 4.26%(+6.07)#875 |
| 17. | Arlington | 10.30% | 5.37%(+4.93)#17 | 4.26%(+6.04)#878 |
| 18. | Winchester | 10.13% | 5.37%(+4.77)#18 | 4.26%(+5.87)#905 |
| 19. | Cochituate | 9.49% | 5.37%(+4.12)#19 | 4.26%(+5.23)#987 |
| 20. | Sharon | 9.11% | 5.37%(+3.74)#20 | 4.26%(+4.85)#1,043 |
| 21. | Medford | 9.10% | 5.37%(+3.73)#21 | 4.26%(+4.84)#1,046 |
| 22. | Amherst | 8.95% | 5.37%(+3.59)#22 | 4.26%(+4.69)#1,075 |
| 23. | West Springfield Town | 8.53% | 5.37%(+3.16)#23 | 4.26%(+4.27)#1,155 |
| 24. | Wellesley | 8.50% | 5.37%(+3.14)#24 | 4.26%(+4.24)#1,167 |
| 25. | Lee | 8.49% | 5.37%(+3.13)#25 | 4.26%(+4.23)#1,169 |
| 26. | Pinehurst | 7.86% | 5.37%(+2.49)#26 | 4.26%(+3.60)#1,295 |
| 27. | Foxborough | 7.81% | 5.37%(+2.44)#27 | 4.26%(+3.55)#1,304 |
| 28. | Boston | 7.48% | 5.37%(+2.11)#28 | 4.26%(+3.22)#1,382 |
| 29. | Woburn | 7.23% | 5.37%(+1.86)#29 | 4.26%(+2.97)#1,440 |
| 30. | Devens | 7.15% | 5.37%(+1.78)#30 | 4.26%(+2.89)#1,465 |
| 31. | Pepperell | 7.12% | 5.37%(+1.75)#31 | 4.26%(+2.86)#1,469 |
| 32. | Everett | 7.12% | 5.37%(+1.75)#32 | 4.26%(+2.86)#1,470 |
| 33. | Dover | 7.09% | 5.37%(+1.72)#33 | 4.26%(+2.83)#1,475 |
| 34. | Somerville | 7.03% | 5.37%(+1.66)#34 | 4.26%(+2.77)#1,492 |
| 35. | Norwood | 6.79% | 5.37%(+1.42)#35 | 4.26%(+2.53)#1,567 |
| 36. | Andover | 6.67% | 5.37%(+1.30)#36 | 4.26%(+2.41)#1,607 |
| 37. | Framingham | 6.34% | 5.37%(+0.968)#37 | 4.26%(+2.07)#1,699 |
| 38. | Melrose | 6.29% | 5.37%(+0.919)#38 | 4.26%(+2.03)#1,708 |
| 39. | Mashpee Neck | 6.22% | 5.37%(+0.854)#39 | 4.26%(+1.96)#1,729 |
| 40. | Westborough | 6.21% | 5.37%(+0.842)#40 | 4.26%(+1.95)#1,732 |
| 41. | Lynnfield | 6.04% | 5.37%(+0.676)#41 | 4.26%(+1.78)#1,771 |
| 42. | Longmeadow | 6.02% | 5.37%(+0.656)#42 | 4.26%(+1.76)#1,780 |
| 43. | Worcester | 6.01% | 5.37%(+0.642)#43 | 4.26%(+1.75)#1,787 |
| 44. | Needham | 5.95% | 5.37%(+0.588)#44 | 4.26%(+1.69)#1,809 |
| 45. | Stoneham | 5.92% | 5.37%(+0.557)#45 | 4.26%(+1.66)#1,819 |
| 46. | Swampscott | 5.80% | 5.37%(+0.431)#46 | 4.26%(+1.54)#1,874 |
| 47. | Mansfield Center | 5.62% | 5.37%(+0.251)#47 | 4.26%(+1.36)#1,939 |
| 48. | Weymouth Town | 5.60% | 5.37%(+0.235)#48 | 4.26%(+1.34)#1,951 |
| 49. | Marion Center | 5.41% | 5.37%(+0.041)#49 | 4.26%(+1.15)#2,020 |
| 50. | Williamstown | 5.27% | 5.37%(-0.098)#50 | 4.26%(+1.01)#2,076 |
| 51. | Marlborough | 4.91% | 5.37%(-0.460)#51 | 4.26%(+0.647)#2,246 |
| 52. | Reading | 4.52% | 5.37%(-0.846)#52 | 4.26%(+0.261)#2,469 |
| 53. | Revere | 4.48% | 5.37%(-0.883)#53 | 4.26%(+0.223)#2,492 |
| 54. | North Scituate | 4.41% | 5.37%(-0.962)#54 | 4.26%(+0.145)#2,532 |
| 55. | Norton Center | 4.19% | 5.37%(-1.18)#55 | 4.26%(-0.074)#2,702 |
| 56. | Housatonic | 4.16% | 5.37%(-1.20)#56 | 4.26%(-0.098)#2,719 |
| 57. | Methuen Town | 4.12% | 5.37%(-1.25)#57 | 4.26%(-0.144)#2,747 |
| 58. | North Attleborough | 4.00% | 5.37%(-1.37)#58 | 4.26%(-0.264)#2,831 |
| 59. | Franklin Town | 3.95% | 5.37%(-1.42)#59 | 4.26%(-0.309)#2,855 |
| 60. | Westfield | 3.92% | 5.37%(-1.45)#60 | 4.26%(-0.341)#2,878 |
| 61. | Wilmington | 3.89% | 5.37%(-1.48)#61 | 4.26%(-0.371)#2,897 |
| 62. | Lynn | 3.81% | 5.37%(-1.56)#62 | 4.26%(-0.450)#2,970 |
| 63. | Maynard | 3.79% | 5.37%(-1.58)#63 | 4.26%(-0.474)#2,989 |
| 64. | Holbrook | 3.67% | 5.37%(-1.70)#64 | 4.26%(-0.591)#3,073 |
| 65. | North Adams | 3.66% | 5.37%(-1.70)#65 | 4.26%(-0.596)#3,082 |
| 66. | Hudson | 3.66% | 5.37%(-1.71)#66 | 4.26%(-0.601)#3,088 |
| 67. | Wakefield | 3.65% | 5.37%(-1.72)#67 | 4.26%(-0.612)#3,102 |
| 68. | Walpole | 3.64% | 5.37%(-1.73)#68 | 4.26%(-0.620)#3,108 |
| 69. | Smith Mills | 3.58% | 5.37%(-1.79)#69 | 4.26%(-0.683)#3,163 |
| 70. | Northborough | 3.56% | 5.37%(-1.80)#70 | 4.26%(-0.696)#3,175 |
| 71. | Littleton Common | 3.48% | 5.37%(-1.88)#71 | 4.26%(-0.776)#3,234 |
| 72. | Sagamore | 3.45% | 5.37%(-1.91)#72 | 4.26%(-0.806)#3,264 |
| 73. | West Concord | 3.38% | 5.37%(-1.99)#73 | 4.26%(-0.881)#3,344 |
| 74. | South Yarmouth | 3.37% | 5.37%(-2.00)#74 | 4.26%(-0.889)#3,355 |
| 75. | Winchendon | 3.36% | 5.37%(-2.00)#75 | 4.26%(-0.898)#3,364 |
| 76. | Monson Center | 3.29% | 5.37%(-2.08)#76 | 4.26%(-0.973)#3,439 |
| 77. | Ipswich | 3.18% | 5.37%(-2.19)#77 | 4.26%(-1.08)#3,537 |
| 78. | East Pepperell | 3.15% | 5.37%(-2.22)#78 | 4.26%(-1.11)#3,579 |
| 79. | Medfield | 3.13% | 5.37%(-2.23)#79 | 4.26%(-1.13)#3,597 |
| 80. | Milton | 3.07% | 5.37%(-2.30)#80 | 4.26%(-1.20)#3,671 |
| 81. | West Chatham | 3.06% | 5.37%(-2.31)#81 | 4.26%(-1.20)#3,675 |
| 82. | Falmouth | 3.04% | 5.37%(-2.33)#82 | 4.26%(-1.22)#3,701 |
| 83. | Salisbury | 3.00% | 5.37%(-2.37)#83 | 4.26%(-1.26)#3,739 |
| 84. | Wilbraham | 2.97% | 5.37%(-2.40)#84 | 4.26%(-1.29)#3,768 |
| 85. | Sandwich | 2.95% | 5.37%(-2.42)#85 | 4.26%(-1.31)#3,794 |
| 86. | Northampton | 2.85% | 5.37%(-2.52)#86 | 4.26%(-1.41)#3,918 |
| 87. | Lunenburg | 2.84% | 5.37%(-2.53)#87 | 4.26%(-1.42)#3,926 |
| 88. | Saugus | 2.80% | 5.37%(-2.56)#88 | 4.26%(-1.46)#3,975 |
| 89. | Gardner | 2.70% | 5.37%(-2.67)#89 | 4.26%(-1.56)#4,107 |
| 90. | Dedham | 2.60% | 5.37%(-2.77)#90 | 4.26%(-1.66)#4,254 |
| 91. | Salem | 2.56% | 5.37%(-2.81)#91 | 4.26%(-1.70)#4,312 |
| 92. | Raynham Center | 2.54% | 5.37%(-2.82)#92 | 4.26%(-1.72)#4,342 |
| 93. | Chicopee | 2.52% | 5.37%(-2.85)#93 | 4.26%(-1.74)#4,391 |
| 94. | Easthampton Town | 2.45% | 5.37%(-2.92)#94 | 4.26%(-1.81)#4,502 |
| 95. | Attleboro | 2.42% | 5.37%(-2.95)#95 | 4.26%(-1.84)#4,557 |
| 96. | Chelsea | 2.39% | 5.37%(-2.98)#96 | 4.26%(-1.87)#4,626 |
| 97. | West Yarmouth | 2.36% | 5.37%(-3.01)#97 | 4.26%(-1.90)#4,666 |
| 98. | Agawam Town | 2.30% | 5.37%(-3.06)#98 | 4.26%(-1.96)#4,767 |
| 99. | Milford | 2.30% | 5.37%(-3.07)#99 | 4.26%(-1.96)#4,782 |
| 100. | Abington | 2.26% | 5.37%(-3.11)#100 | 4.26%(-2.00)#4,855 |
Common Questions
What are the Top 10 Cities with the Highest Percentage of Immigrants from Asia in Massachusetts?
Top 10 Cities with the Highest Percentage of Immigrants from Asia in Massachusetts are:
#1
24.17%
#2
21.75%
#3
20.77%
#4
16.46%
#5
14.73%
#6
14.31%
#7
14.01%
#8
13.33%
#9
11.97%
#10
11.81%
What city has the Highest Percentage of Immigrants from Asia in Massachusetts?
Lexington has the Highest Percentage of Immigrants from Asia in Massachusetts with 24.17%.
What is the Percentage of Immigrants from Asia in the State of Massachusetts?
Percentage of Immigrants from Asia in Massachusetts is 5.37%.
What is the Percentage of Immigrants from Asia in the United States?
Percentage of Immigrants from Asia in the United States is 4.26%.