Cities with the Highest Percentage of Households with Income Above $200,000 in Massachusetts
RELATED REPORTS & OPTIONS
Household Income | $200k+
Massachusetts
Compare Cities
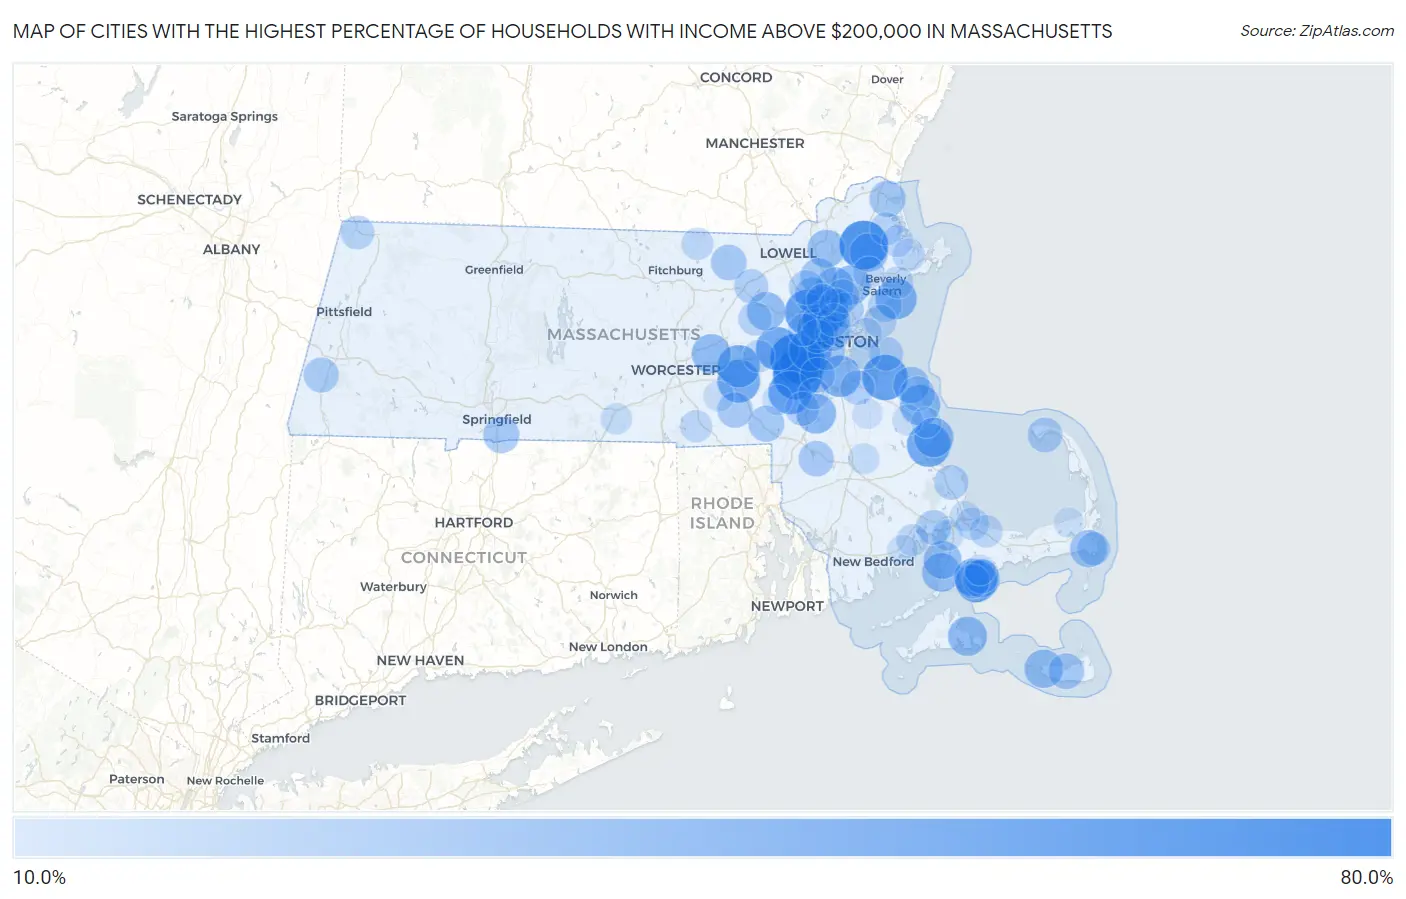
Map of Cities with the Highest Percentage of Households with Income Above $200,000 in Massachusetts
0.0%
80.0%
Cities with the Highest Percentage of Households with Income Above $200,000 in Massachusetts
| City | Households with Income > $200k | vs State | vs National | |
| 1. | Wellesley | 60.7% | 19.3%(+41.4)#1 | 11.4%(+49.3)#172 |
| 2. | Dover | 59.8% | 19.3%(+40.5)#2 | 11.4%(+48.4)#192 |
| 3. | Boxford | 58.5% | 19.3%(+39.2)#3 | 11.4%(+47.1)#220 |
| 4. | Winchester | 52.5% | 19.3%(+33.2)#4 | 11.4%(+41.1)#377 |
| 5. | Needham | 51.7% | 19.3%(+32.4)#5 | 11.4%(+40.3)#395 |
| 6. | Lexington | 51.5% | 19.3%(+32.2)#6 | 11.4%(+40.1)#405 |
| 7. | Hingham | 51.5% | 19.3%(+32.2)#7 | 11.4%(+40.1)#406 |
| 8. | South Duxbury | 47.2% | 19.3%(+27.9)#8 | 11.4%(+35.8)#530 |
| 9. | Cochituate | 46.7% | 19.3%(+27.4)#9 | 11.4%(+35.3)#552 |
| 10. | Medfield | 46.7% | 19.3%(+27.4)#10 | 11.4%(+35.3)#553 |
| 11. | Hopkinton | 45.2% | 19.3%(+25.9)#11 | 11.4%(+33.8)#602 |
| 12. | Cordaville | 44.7% | 19.3%(+25.4)#12 | 11.4%(+33.3)#625 |
| 13. | Newton | 44.4% | 19.3%(+25.1)#13 | 11.4%(+33.0)#634 |
| 14. | New Seabury | 43.8% | 19.3%(+24.5)#14 | 11.4%(+32.4)#664 |
| 15. | Milton | 42.4% | 19.3%(+23.1)#15 | 11.4%(+31.0)#712 |
| 16. | Marblehead | 41.6% | 19.3%(+22.3)#16 | 11.4%(+30.2)#751 |
| 17. | Belmont | 41.3% | 19.3%(+22.0)#17 | 11.4%(+29.9)#769 |
| 18. | Marshfield Hills | 40.1% | 19.3%(+20.8)#18 | 11.4%(+28.7)#827 |
| 19. | Green Harbor | 39.1% | 19.3%(+19.8)#19 | 11.4%(+27.7)#897 |
| 20. | Sharon | 38.2% | 19.3%(+18.9)#20 | 11.4%(+26.8)#947 |
| 21. | Duxbury | 38.1% | 19.3%(+18.8)#21 | 11.4%(+26.7)#954 |
| 22. | Lynnfield | 37.2% | 19.3%(+17.9)#22 | 11.4%(+25.8)#999 |
| 23. | Northborough | 37.1% | 19.3%(+17.8)#23 | 11.4%(+25.7)#1,008 |
| 24. | Edgartown | 37.1% | 19.3%(+17.8)#24 | 11.4%(+25.7)#1,013 |
| 25. | Madaket | 35.8% | 19.3%(+16.5)#25 | 11.4%(+24.4)#1,102 |
| 26. | West Concord | 35.7% | 19.3%(+16.4)#26 | 11.4%(+24.3)#1,106 |
| 27. | West Falmouth | 35.7% | 19.3%(+16.4)#27 | 11.4%(+24.3)#1,107 |
| 28. | Topsfield | 35.3% | 19.3%(+16.0)#28 | 11.4%(+23.9)#1,156 |
| 29. | North Falmouth | 34.5% | 19.3%(+15.2)#29 | 11.4%(+23.1)#1,212 |
| 30. | Reading | 34.3% | 19.3%(+15.0)#30 | 11.4%(+22.9)#1,224 |
| 31. | Andover | 34.0% | 19.3%(+14.7)#31 | 11.4%(+22.6)#1,241 |
| 32. | Seabrook | 34.0% | 19.3%(+14.7)#32 | 11.4%(+22.6)#1,247 |
| 33. | Popponesset | 33.9% | 19.3%(+14.6)#33 | 11.4%(+22.5)#1,263 |
| 34. | Brookline | 33.5% | 19.3%(+14.2)#34 | 11.4%(+22.1)#1,283 |
| 35. | West Chatham | 33.3% | 19.3%(+14.0)#35 | 11.4%(+21.9)#1,309 |
| 36. | Arlington | 32.0% | 19.3%(+12.7)#36 | 11.4%(+20.6)#1,423 |
| 37. | North Scituate | 31.3% | 19.3%(+12.0)#37 | 11.4%(+19.9)#1,491 |
| 38. | Wilmington | 31.1% | 19.3%(+11.8)#38 | 11.4%(+19.7)#1,506 |
| 39. | Newburyport | 30.6% | 19.3%(+11.3)#39 | 11.4%(+19.2)#1,554 |
| 40. | Longmeadow | 30.5% | 19.3%(+11.2)#40 | 11.4%(+19.1)#1,565 |
| 41. | Franklin Town | 30.4% | 19.3%(+11.1)#41 | 11.4%(+19.0)#1,573 |
| 42. | Nantucket | 29.7% | 19.3%(+10.4)#42 | 11.4%(+18.3)#1,650 |
| 43. | Groton | 29.4% | 19.3%(+10.1)#43 | 11.4%(+18.0)#1,674 |
| 44. | Hopedale | 29.1% | 19.3%(+9.80)#44 | 11.4%(+17.7)#1,699 |
| 45. | Burlington | 29.0% | 19.3%(+9.70)#45 | 11.4%(+17.6)#1,704 |
| 46. | Norton Center | 28.7% | 19.3%(+9.40)#46 | 11.4%(+17.3)#1,750 |
| 47. | Cedar Crest | 28.4% | 19.3%(+9.10)#47 | 11.4%(+17.0)#1,785 |
| 48. | Melrose | 28.2% | 19.3%(+8.90)#48 | 11.4%(+16.8)#1,798 |
| 49. | Cambridge | 28.0% | 19.3%(+8.70)#49 | 11.4%(+16.6)#1,810 |
| 50. | Housatonic | 28.0% | 19.3%(+8.70)#50 | 11.4%(+16.6)#1,818 |
| 51. | Provincetown | 27.8% | 19.3%(+8.50)#51 | 11.4%(+16.4)#1,844 |
| 52. | Scituate | 27.6% | 19.3%(+8.30)#52 | 11.4%(+16.2)#1,862 |
| 53. | Onset | 27.5% | 19.3%(+8.20)#53 | 11.4%(+16.1)#1,870 |
| 54. | Popponesset Island | 27.5% | 19.3%(+8.20)#54 | 11.4%(+16.1)#1,872 |
| 55. | Dedham | 27.4% | 19.3%(+8.10)#55 | 11.4%(+16.0)#1,875 |
| 56. | Pinehurst | 27.1% | 19.3%(+7.80)#56 | 11.4%(+15.7)#1,923 |
| 57. | The Pinehills | 26.7% | 19.3%(+7.40)#57 | 11.4%(+15.3)#1,968 |
| 58. | Braintree Town | 26.4% | 19.3%(+7.10)#58 | 11.4%(+15.0)#2,004 |
| 59. | Monomoscoy Island | 26.3% | 19.3%(+7.00)#59 | 11.4%(+14.9)#2,023 |
| 60. | Littleton Common | 26.2% | 19.3%(+6.90)#60 | 11.4%(+14.8)#2,035 |
| 61. | Hull | 25.9% | 19.3%(+6.60)#61 | 11.4%(+14.5)#2,064 |
| 62. | Walpole | 25.8% | 19.3%(+6.50)#62 | 11.4%(+14.4)#2,076 |
| 63. | Wakefield | 25.7% | 19.3%(+6.40)#63 | 11.4%(+14.3)#2,089 |
| 64. | Swampscott | 25.6% | 19.3%(+6.30)#64 | 11.4%(+14.2)#2,100 |
| 65. | Williamstown | 25.3% | 19.3%(+6.00)#65 | 11.4%(+13.9)#2,135 |
| 66. | Somerville | 25.2% | 19.3%(+5.90)#66 | 11.4%(+13.8)#2,140 |
| 67. | Watertown Town | 25.2% | 19.3%(+5.90)#67 | 11.4%(+13.8)#2,141 |
| 68. | Maynard | 24.6% | 19.3%(+5.30)#68 | 11.4%(+13.2)#2,215 |
| 69. | Chatham | 24.4% | 19.3%(+5.10)#69 | 11.4%(+13.0)#2,250 |
| 70. | Stoneham | 24.3% | 19.3%(+5.00)#70 | 11.4%(+12.9)#2,256 |
| 71. | Medford | 23.9% | 19.3%(+4.60)#71 | 11.4%(+12.5)#2,325 |
| 72. | Rowley | 23.7% | 19.3%(+4.40)#72 | 11.4%(+12.3)#2,366 |
| 73. | Nahant | 23.6% | 19.3%(+4.30)#73 | 11.4%(+12.2)#2,380 |
| 74. | Sandwich | 22.9% | 19.3%(+3.60)#74 | 11.4%(+11.5)#2,494 |
| 75. | Essex | 22.9% | 19.3%(+3.60)#75 | 11.4%(+11.5)#2,496 |
| 76. | East Sandwich | 22.8% | 19.3%(+3.50)#76 | 11.4%(+11.4)#2,506 |
| 77. | Waltham | 22.1% | 19.3%(+2.80)#77 | 11.4%(+10.7)#2,628 |
| 78. | East Douglas | 21.8% | 19.3%(+2.50)#78 | 11.4%(+10.4)#2,696 |
| 79. | Townsend | 21.8% | 19.3%(+2.50)#79 | 11.4%(+10.4)#2,699 |
| 80. | Framingham | 21.6% | 19.3%(+2.30)#80 | 11.4%(+10.2)#2,715 |
| 81. | Woburn | 21.5% | 19.3%(+2.20)#81 | 11.4%(+10.1)#2,748 |
| 82. | Marion Center | 21.5% | 19.3%(+2.20)#82 | 11.4%(+10.1)#2,759 |
| 83. | Beverly | 21.4% | 19.3%(+2.10)#83 | 11.4%(+10.00)#2,763 |
| 84. | Danvers | 21.3% | 19.3%(+2.00)#84 | 11.4%(+9.90)#2,786 |
| 85. | Winthrop Town | 21.1% | 19.3%(+1.80)#85 | 11.4%(+9.70)#2,829 |
| 86. | Ipswich | 20.8% | 19.3%(+1.50)#86 | 11.4%(+9.40)#2,884 |
| 87. | Monument Beach | 20.6% | 19.3%(+1.30)#87 | 11.4%(+9.20)#2,920 |
| 88. | Sturbridge | 20.2% | 19.3%(+0.900)#88 | 11.4%(+8.80)#3,007 |
| 89. | Boston | 19.6% | 19.3%(+0.300)#89 | 11.4%(+8.20)#3,129 |
| 90. | Bridgewater Town | 19.5% | 19.3%(+0.200)#90 | 11.4%(+8.10)#3,149 |
| 91. | Norwood | 19.2% | 19.3%(-0.100)#91 | 11.4%(+7.80)#3,207 |
| 92. | Upton | 19.2% | 19.3%(-0.100)#92 | 11.4%(+7.80)#3,221 |
| 93. | North Pembroke | 19.1% | 19.3%(-0.200)#93 | 11.4%(+7.70)#3,246 |
| 94. | Sagamore | 19.0% | 19.3%(-0.300)#94 | 11.4%(+7.60)#3,272 |
| 95. | Mashpee Neck | 19.0% | 19.3%(-0.300)#95 | 11.4%(+7.60)#3,279 |
| 96. | Millis Clicquot | 18.6% | 19.3%(-0.700)#96 | 11.4%(+7.20)#3,368 |
| 97. | Mattapoisett Center | 18.4% | 19.3%(-0.900)#97 | 11.4%(+7.00)#3,414 |
| 98. | Marshfield | 18.3% | 19.3%(-1.00)#98 | 11.4%(+6.90)#3,432 |
| 99. | Abington | 18.0% | 19.3%(-1.30)#99 | 11.4%(+6.60)#3,489 |
| 100. | Brewster | 17.4% | 19.3%(-1.90)#100 | 11.4%(+6.00)#3,639 |
Common Questions
What are the Top 10 Cities with the Highest Percentage of Households with Income Above $200,000 in Massachusetts?
Top 10 Cities with the Highest Percentage of Households with Income Above $200,000 in Massachusetts are:
#1
60.7%
#2
59.8%
#3
58.5%
#4
52.5%
#5
51.7%
#6
51.5%
#7
51.5%
#8
47.2%
#9
46.7%
#10
46.7%
What city has the Highest Percentage of Households with Income Above $200,000 in Massachusetts?
Wellesley has the Highest Percentage of Households with Income Above $200,000 in Massachusetts with 60.7%.
What is the Percentage of Households with Income Above $200,000 in the State of Massachusetts?
Percentage of Households with Income Above $200,000 in Massachusetts is 19.3%.
What is the Percentage of Households with Income Above $200,000 in the United States?
Percentage of Households with Income Above $200,000 in the United States is 11.4%.