Cities with the Most Immigrants from Latin America in Massachusetts
RELATED REPORTS & OPTIONS
Latin America
Massachusetts
Compare Cities
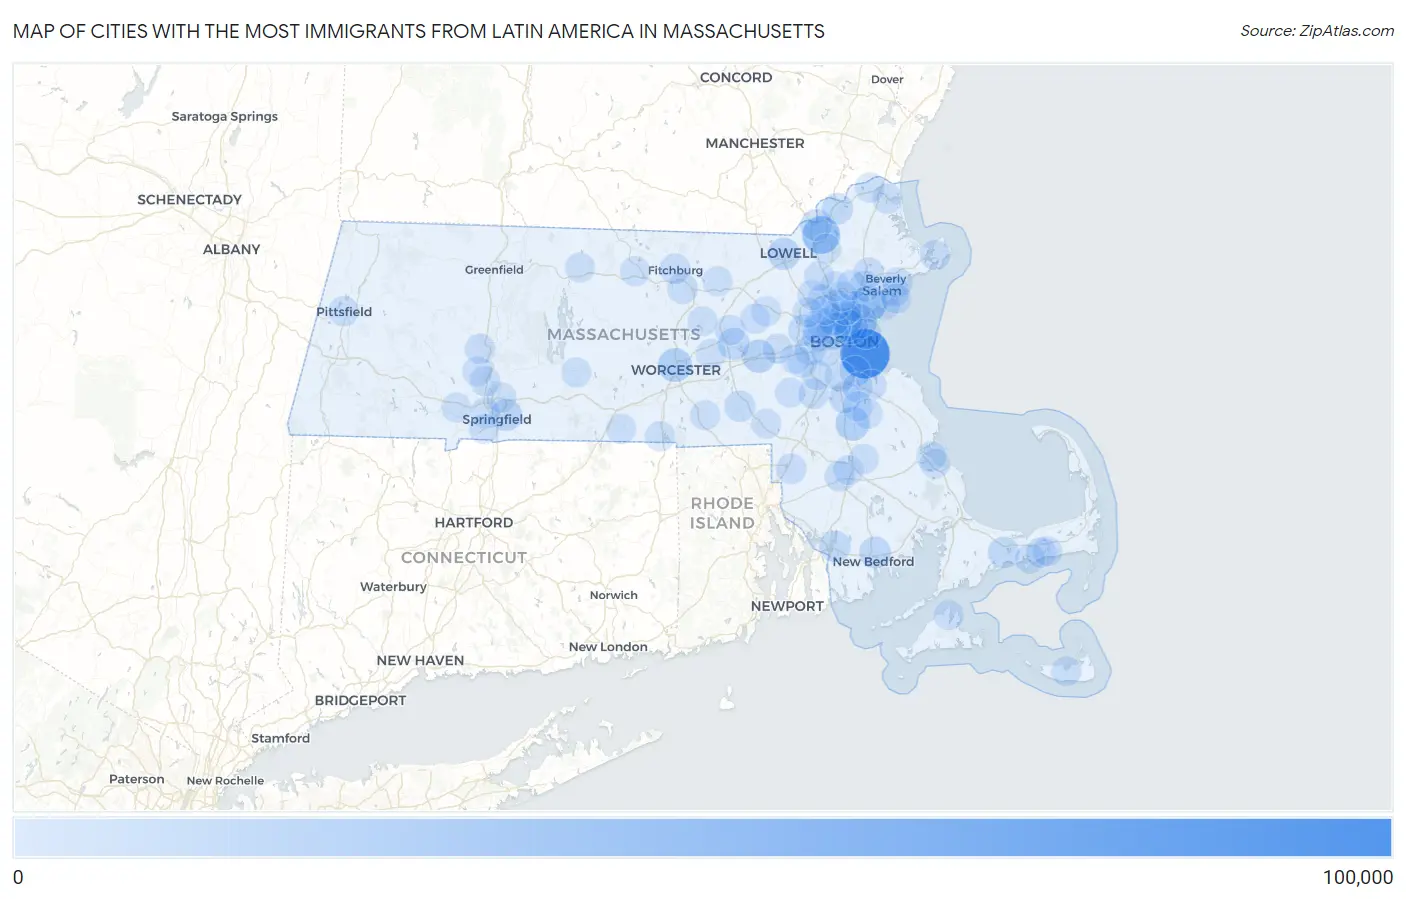
Map of Cities with the Most Immigrants from Latin America in Massachusetts
0
100,000
Cities with the Most Immigrants from Latin America in Massachusetts
| City | Latin America | vs State | vs National | |
| 1. | Boston | 92,332 | 474,591(19.46%)#1 | 22,649,518(0.41%)#15 |
| 2. | Lawrence | 35,169 | 474,591(7.41%)#2 | 22,649,518(0.16%)#70 |
| 3. | Lynn | 26,284 | 474,591(5.54%)#3 | 22,649,518(0.12%)#108 |
| 4. | Revere | 18,723 | 474,591(3.95%)#4 | 22,649,518(0.08%)#166 |
| 5. | Brockton | 17,345 | 474,591(3.65%)#5 | 22,649,518(0.08%)#180 |
| 6. | Worcester | 17,044 | 474,591(3.59%)#6 | 22,649,518(0.08%)#186 |
| 7. | Chelsea | 15,974 | 474,591(3.37%)#7 | 22,649,518(0.07%)#201 |
| 8. | Everett | 15,594 | 474,591(3.29%)#8 | 22,649,518(0.07%)#211 |
| 9. | Framingham | 14,006 | 474,591(2.95%)#9 | 22,649,518(0.06%)#240 |
| 10. | Springfield | 9,283 | 474,591(1.96%)#10 | 22,649,518(0.04%)#357 |
| 11. | Malden | 9,265 | 474,591(1.95%)#11 | 22,649,518(0.04%)#361 |
| 12. | Lowell | 8,780 | 474,591(1.85%)#12 | 22,649,518(0.04%)#381 |
| 13. | Marlborough | 8,357 | 474,591(1.76%)#13 | 22,649,518(0.04%)#402 |
| 14. | Methuen Town | 8,282 | 474,591(1.75%)#14 | 22,649,518(0.04%)#406 |
| 15. | New Bedford | 7,417 | 474,591(1.56%)#15 | 22,649,518(0.03%)#461 |
| 16. | Somerville | 7,177 | 474,591(1.51%)#16 | 22,649,518(0.03%)#475 |
| 17. | Randolph Town | 6,930 | 474,591(1.46%)#17 | 22,649,518(0.03%)#493 |
| 18. | Barnstable Town | 6,875 | 474,591(1.45%)#18 | 22,649,518(0.03%)#497 |
| 19. | Cambridge | 6,187 | 474,591(1.30%)#19 | 22,649,518(0.03%)#544 |
| 20. | Fall River | 5,963 | 474,591(1.26%)#20 | 22,649,518(0.03%)#562 |
| 21. | Haverhill | 5,839 | 474,591(1.23%)#21 | 22,649,518(0.03%)#573 |
| 22. | Waltham | 5,347 | 474,591(1.13%)#22 | 22,649,518(0.02%)#635 |
| 23. | Milford | 5,255 | 474,591(1.11%)#23 | 22,649,518(0.02%)#645 |
| 24. | Medford | 5,022 | 474,591(1.06%)#24 | 22,649,518(0.02%)#679 |
| 25. | Peabody | 4,294 | 474,591(0.90%)#25 | 22,649,518(0.02%)#757 |
| 26. | Salem | 3,957 | 474,591(0.83%)#26 | 22,649,518(0.02%)#800 |
| 27. | Quincy | 3,430 | 474,591(0.72%)#27 | 22,649,518(0.02%)#903 |
| 28. | Woburn | 2,892 | 474,591(0.61%)#28 | 22,649,518(0.01%)#1,034 |
| 29. | Leominster | 2,826 | 474,591(0.60%)#29 | 22,649,518(0.01%)#1,050 |
| 30. | Taunton | 2,689 | 474,591(0.57%)#30 | 22,649,518(0.01%)#1,085 |
| 31. | Saugus | 2,479 | 474,591(0.52%)#31 | 22,649,518(0.01%)#1,152 |
| 32. | Milton | 2,474 | 474,591(0.52%)#32 | 22,649,518(0.01%)#1,156 |
| 33. | Norwood | 2,394 | 474,591(0.50%)#33 | 22,649,518(0.01%)#1,184 |
| 34. | Weymouth Town | 2,191 | 474,591(0.46%)#34 | 22,649,518(0.01%)#1,248 |
| 35. | Fitchburg | 2,106 | 474,591(0.44%)#35 | 22,649,518(0.01%)#1,298 |
| 36. | Newton | 2,049 | 474,591(0.43%)#36 | 22,649,518(0.01%)#1,324 |
| 37. | Watertown Town | 1,980 | 474,591(0.42%)#37 | 22,649,518(0.01%)#1,351 |
| 38. | Attleboro | 1,820 | 474,591(0.38%)#38 | 22,649,518(0.01%)#1,439 |
| 39. | Brookline | 1,791 | 474,591(0.38%)#39 | 22,649,518(0.01%)#1,454 |
| 40. | Winthrop Town | 1,716 | 474,591(0.36%)#40 | 22,649,518(0.01%)#1,495 |
| 41. | Beverly | 1,520 | 474,591(0.32%)#41 | 22,649,518(0.01%)#1,602 |
| 42. | Hudson | 1,237 | 474,591(0.26%)#42 | 22,649,518(0.01%)#1,865 |
| 43. | Dedham | 1,122 | 474,591(0.24%)#43 | 22,649,518(0.00%)#1,988 |
| 44. | Danvers | 1,110 | 474,591(0.23%)#44 | 22,649,518(0.00%)#1,998 |
| 45. | South Yarmouth | 1,054 | 474,591(0.22%)#45 | 22,649,518(0.00%)#2,070 |
| 46. | Melrose | 991 | 474,591(0.21%)#46 | 22,649,518(0.00%)#2,154 |
| 47. | Holyoke | 984 | 474,591(0.21%)#47 | 22,649,518(0.00%)#2,163 |
| 48. | Amherst | 960 | 474,591(0.20%)#48 | 22,649,518(0.00%)#2,201 |
| 49. | Arlington | 921 | 474,591(0.19%)#49 | 22,649,518(0.00%)#2,266 |
| 50. | Gloucester | 874 | 474,591(0.18%)#50 | 22,649,518(0.00%)#2,328 |
| 51. | Stoneham | 836 | 474,591(0.18%)#51 | 22,649,518(0.00%)#2,387 |
| 52. | Braintree Town | 830 | 474,591(0.17%)#52 | 22,649,518(0.00%)#2,399 |
| 53. | Pittsfield | 826 | 474,591(0.17%)#53 | 22,649,518(0.00%)#2,406 |
| 54. | Northampton | 793 | 474,591(0.17%)#54 | 22,649,518(0.00%)#2,478 |
| 55. | Chicopee | 759 | 474,591(0.16%)#55 | 22,649,518(0.00%)#2,555 |
| 56. | North Plymouth | 757 | 474,591(0.16%)#56 | 22,649,518(0.00%)#2,562 |
| 57. | Clinton | 648 | 474,591(0.14%)#57 | 22,649,518(0.00%)#2,798 |
| 58. | Holbrook | 642 | 474,591(0.14%)#58 | 22,649,518(0.00%)#2,813 |
| 59. | Belmont | 638 | 474,591(0.13%)#59 | 22,649,518(0.00%)#2,823 |
| 60. | Lexington | 597 | 474,591(0.13%)#60 | 22,649,518(0.00%)#2,937 |
| 61. | West Yarmouth | 592 | 474,591(0.12%)#61 | 22,649,518(0.00%)#2,956 |
| 62. | Plymouth | 589 | 474,591(0.12%)#62 | 22,649,518(0.00%)#2,967 |
| 63. | Needham | 546 | 474,591(0.12%)#63 | 22,649,518(0.00%)#3,111 |
| 64. | North Attleborough | 541 | 474,591(0.11%)#64 | 22,649,518(0.00%)#3,126 |
| 65. | Swampscott | 533 | 474,591(0.11%)#65 | 22,649,518(0.00%)#3,167 |
| 66. | West Springfield Town | 532 | 474,591(0.11%)#66 | 22,649,518(0.00%)#3,170 |
| 67. | Vineyard Haven | 516 | 474,591(0.11%)#67 | 22,649,518(0.00%)#3,223 |
| 68. | Abington | 513 | 474,591(0.11%)#68 | 22,649,518(0.00%)#3,233 |
| 69. | Wakefield | 497 | 474,591(0.10%)#69 | 22,649,518(0.00%)#3,288 |
| 70. | Winchester | 484 | 474,591(0.10%)#70 | 22,649,518(0.00%)#3,344 |
| 71. | Wellesley | 479 | 474,591(0.10%)#71 | 22,649,518(0.00%)#3,364 |
| 72. | Newburyport | 438 | 474,591(0.09%)#72 | 22,649,518(0.00%)#3,540 |
| 73. | Webster | 416 | 474,591(0.09%)#73 | 22,649,518(0.00%)#3,640 |
| 74. | Nantucket | 382 | 474,591(0.08%)#74 | 22,649,518(0.00%)#3,812 |
| 75. | Bridgewater Town | 377 | 474,591(0.08%)#75 | 22,649,518(0.00%)#3,844 |
| 76. | Westfield | 366 | 474,591(0.08%)#76 | 22,649,518(0.00%)#3,916 |
| 77. | Easthampton Town | 351 | 474,591(0.07%)#77 | 22,649,518(0.00%)#4,000 |
| 78. | Andover | 345 | 474,591(0.07%)#78 | 22,649,518(0.00%)#4,044 |
| 79. | Franklin Town | 344 | 474,591(0.07%)#79 | 22,649,518(0.00%)#4,048 |
| 80. | Agawam Town | 336 | 474,591(0.07%)#80 | 22,649,518(0.00%)#4,098 |
| 81. | Cochituate | 327 | 474,591(0.07%)#81 | 22,649,518(0.00%)#4,157 |
| 82. | Gardner | 317 | 474,591(0.07%)#82 | 22,649,518(0.00%)#4,216 |
| 83. | Burlington | 307 | 474,591(0.06%)#83 | 22,649,518(0.00%)#4,279 |
| 84. | Reading | 284 | 474,591(0.06%)#84 | 22,649,518(0.00%)#4,445 |
| 85. | West Dennis | 281 | 474,591(0.06%)#85 | 22,649,518(0.00%)#4,469 |
| 86. | Greenfield | 278 | 474,591(0.06%)#86 | 22,649,518(0.00%)#4,489 |
| 87. | Lynnfield | 271 | 474,591(0.06%)#87 | 22,649,518(0.00%)#4,537 |
| 88. | Wilmington | 253 | 474,591(0.05%)#88 | 22,649,518(0.00%)#4,680 |
| 89. | Raynham Center | 243 | 474,591(0.05%)#89 | 22,649,518(0.00%)#4,767 |
| 90. | Northborough | 242 | 474,591(0.05%)#90 | 22,649,518(0.00%)#4,777 |
| 91. | Southbridge Town | 235 | 474,591(0.05%)#91 | 22,649,518(0.00%)#4,844 |
| 92. | West Concord | 217 | 474,591(0.05%)#92 | 22,649,518(0.00%)#5,034 |
| 93. | Marblehead | 213 | 474,591(0.04%)#93 | 22,649,518(0.00%)#5,068 |
| 94. | Whitinsville | 208 | 474,591(0.04%)#94 | 22,649,518(0.00%)#5,136 |
| 95. | Athol | 201 | 474,591(0.04%)#95 | 22,649,518(0.00%)#5,218 |
| 96. | Maynard | 193 | 474,591(0.04%)#96 | 22,649,518(0.00%)#5,319 |
| 97. | Devens | 187 | 474,591(0.04%)#97 | 22,649,518(0.00%)#5,407 |
| 98. | Amesbury Town | 185 | 474,591(0.04%)#98 | 22,649,518(0.00%)#5,423 |
| 99. | Medfield | 180 | 474,591(0.04%)#99 | 22,649,518(0.00%)#5,487 |
| 100. | Ware | 178 | 474,591(0.04%)#100 | 22,649,518(0.00%)#5,520 |
Common Questions
What are the Top 10 Cities with the Most Immigrants from Latin America in Massachusetts?
Top 10 Cities with the Most Immigrants from Latin America in Massachusetts are:
#1
92,332
#2
35,169
#3
26,284
#4
18,723
#5
17,345
#6
17,044
#7
15,974
#8
15,594
#9
14,006
#10
9,283
What city has the Most Immigrants from Latin America in Massachusetts?
Boston has the Most Immigrants from Latin America in Massachusetts with 92,332.
What is the Total Immigrants from Latin America in the State of Massachusetts?
Total Immigrants from Latin America in Massachusetts is 474,591.
What is the Total Immigrants from Latin America in the United States?
Total Immigrants from Latin America in the United States is 22,649,518.