Cities with the Most Immigrants from Taiwan in Massachusetts
RELATED REPORTS & OPTIONS
Taiwan
Massachusetts
Compare Cities
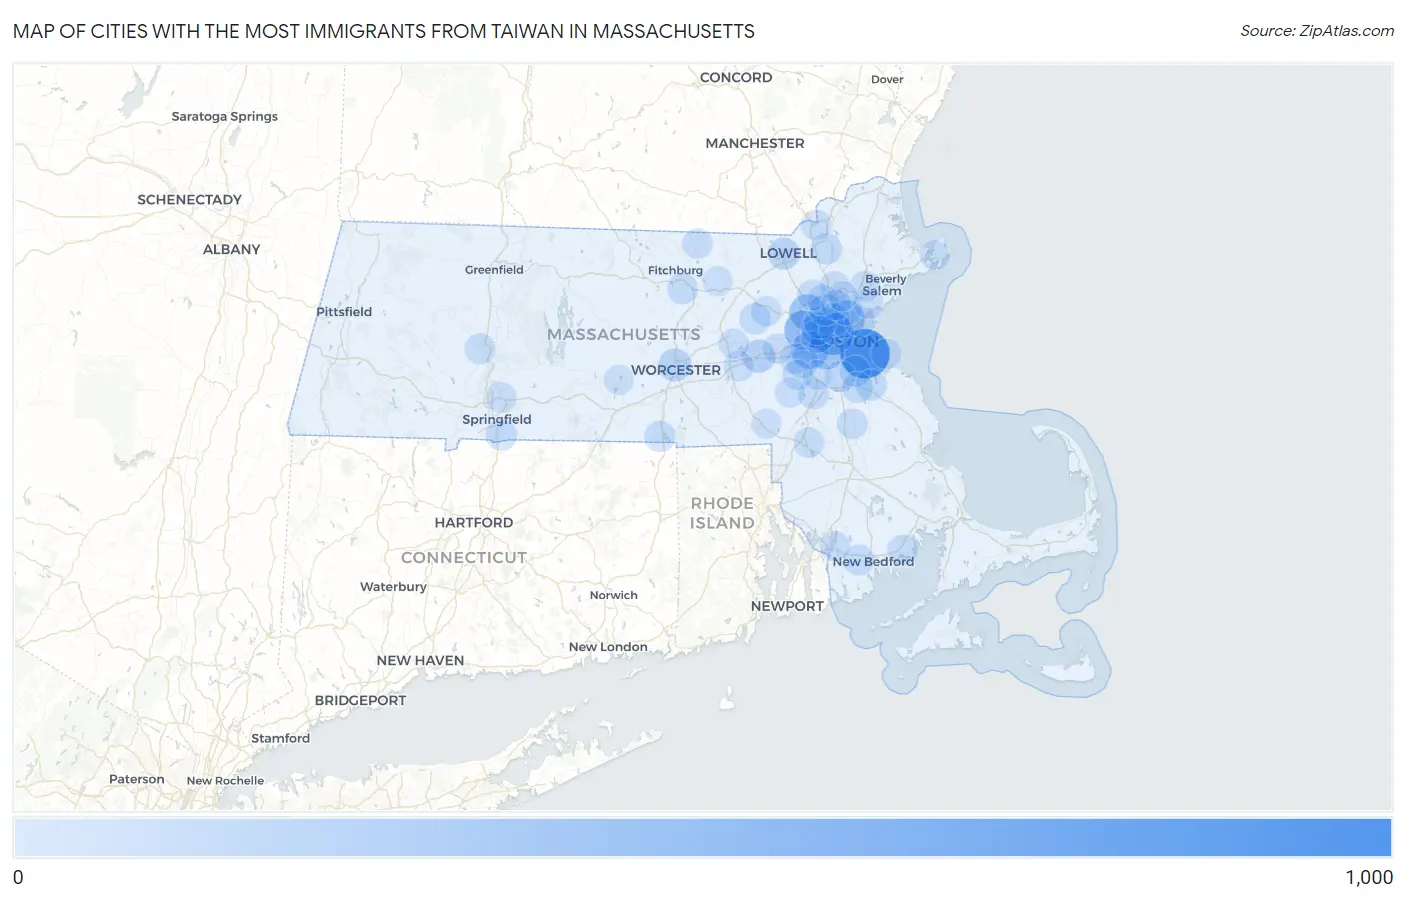
Map of Cities with the Most Immigrants from Taiwan in Massachusetts
0
1,000
Cities with the Most Immigrants from Taiwan in Massachusetts
| City | Taiwan | vs State | vs National | |
| 1. | Boston | 975 | 8,270(11.79%)#1 | 376,336(0.26%)#55 |
| 2. | Cambridge | 601 | 8,270(7.27%)#2 | 376,336(0.16%)#92 |
| 3. | Waltham | 428 | 8,270(5.18%)#3 | 376,336(0.11%)#136 |
| 4. | Newton | 363 | 8,270(4.39%)#4 | 376,336(0.10%)#152 |
| 5. | Malden | 348 | 8,270(4.21%)#5 | 376,336(0.09%)#157 |
| 6. | Lexington | 317 | 8,270(3.83%)#6 | 376,336(0.08%)#172 |
| 7. | Brookline | 301 | 8,270(3.64%)#7 | 376,336(0.08%)#182 |
| 8. | Framingham | 144 | 8,270(1.74%)#8 | 376,336(0.04%)#361 |
| 9. | Watertown Town | 144 | 8,270(1.74%)#9 | 376,336(0.04%)#362 |
| 10. | Medford | 141 | 8,270(1.70%)#10 | 376,336(0.04%)#368 |
| 11. | Worcester | 134 | 8,270(1.62%)#11 | 376,336(0.04%)#388 |
| 12. | Belmont | 129 | 8,270(1.56%)#12 | 376,336(0.03%)#405 |
| 13. | Arlington | 102 | 8,270(1.23%)#13 | 376,336(0.03%)#492 |
| 14. | Amherst | 97 | 8,270(1.17%)#14 | 376,336(0.03%)#507 |
| 15. | Lowell | 94 | 8,270(1.14%)#15 | 376,336(0.02%)#516 |
| 16. | Somerville | 91 | 8,270(1.10%)#16 | 376,336(0.02%)#524 |
| 17. | Needham | 82 | 8,270(0.99%)#17 | 376,336(0.02%)#582 |
| 18. | Winchester | 73 | 8,270(0.88%)#18 | 376,336(0.02%)#654 |
| 19. | Milton | 64 | 8,270(0.77%)#19 | 376,336(0.02%)#735 |
| 20. | Quincy | 63 | 8,270(0.76%)#20 | 376,336(0.02%)#739 |
| 21. | Maynard | 60 | 8,270(0.73%)#21 | 376,336(0.02%)#770 |
| 22. | Weymouth Town | 59 | 8,270(0.71%)#22 | 376,336(0.02%)#774 |
| 23. | Andover | 59 | 8,270(0.71%)#23 | 376,336(0.02%)#784 |
| 24. | Longmeadow | 54 | 8,270(0.65%)#24 | 376,336(0.01%)#840 |
| 25. | Braintree Town | 49 | 8,270(0.59%)#25 | 376,336(0.01%)#890 |
| 26. | Leominster | 48 | 8,270(0.58%)#26 | 376,336(0.01%)#900 |
| 27. | Webster | 47 | 8,270(0.57%)#27 | 376,336(0.01%)#915 |
| 28. | Norwood | 45 | 8,270(0.54%)#28 | 376,336(0.01%)#938 |
| 29. | Smith Mills | 42 | 8,270(0.51%)#29 | 376,336(0.01%)#979 |
| 30. | Revere | 40 | 8,270(0.48%)#30 | 376,336(0.01%)#1,011 |
| 31. | Melrose | 40 | 8,270(0.48%)#31 | 376,336(0.01%)#1,014 |
| 32. | Burlington | 35 | 8,270(0.42%)#32 | 376,336(0.01%)#1,102 |
| 33. | Northampton | 34 | 8,270(0.41%)#33 | 376,336(0.01%)#1,122 |
| 34. | Woburn | 32 | 8,270(0.39%)#34 | 376,336(0.01%)#1,169 |
| 35. | Mansfield Center | 31 | 8,270(0.37%)#35 | 376,336(0.01%)#1,203 |
| 36. | Peabody | 29 | 8,270(0.35%)#36 | 376,336(0.01%)#1,238 |
| 37. | Mattapoisett Center | 29 | 8,270(0.35%)#37 | 376,336(0.01%)#1,255 |
| 38. | Brockton | 28 | 8,270(0.34%)#38 | 376,336(0.01%)#1,257 |
| 39. | Wellesley | 27 | 8,270(0.33%)#39 | 376,336(0.01%)#1,299 |
| 40. | Reading | 27 | 8,270(0.33%)#40 | 376,336(0.01%)#1,300 |
| 41. | Methuen Town | 25 | 8,270(0.30%)#41 | 376,336(0.01%)#1,344 |
| 42. | Chicopee | 23 | 8,270(0.28%)#42 | 376,336(0.01%)#1,400 |
| 43. | West Concord | 17 | 8,270(0.21%)#43 | 376,336(0.00%)#1,670 |
| 44. | Cordaville | 17 | 8,270(0.21%)#44 | 376,336(0.00%)#1,675 |
| 45. | Stoneham | 16 | 8,270(0.19%)#45 | 376,336(0.00%)#1,698 |
| 46. | Townsend | 16 | 8,270(0.19%)#46 | 376,336(0.00%)#1,734 |
| 47. | Marlborough | 13 | 8,270(0.16%)#47 | 376,336(0.00%)#1,864 |
| 48. | Fall River | 12 | 8,270(0.15%)#48 | 376,336(0.00%)#1,915 |
| 49. | Cochituate | 11 | 8,270(0.13%)#49 | 376,336(0.00%)#2,019 |
| 50. | Medfield | 10 | 8,270(0.12%)#50 | 376,336(0.00%)#2,091 |
| 51. | Dover | 10 | 8,270(0.12%)#51 | 376,336(0.00%)#2,106 |
| 52. | Gloucester | 9 | 8,270(0.11%)#52 | 376,336(0.00%)#2,128 |
| 53. | Wakefield | 8 | 8,270(0.10%)#53 | 376,336(0.00%)#2,204 |
| 54. | Hull | 8 | 8,270(0.10%)#54 | 376,336(0.00%)#2,220 |
| 55. | Lynn | 6 | 8,270(0.07%)#55 | 376,336(0.00%)#2,325 |
| 56. | Dedham | 6 | 8,270(0.07%)#56 | 376,336(0.00%)#2,339 |
| 57. | Franklin Town | 5 | 8,270(0.06%)#57 | 376,336(0.00%)#2,404 |
| 58. | Devens | 5 | 8,270(0.06%)#58 | 376,336(0.00%)#2,436 |
| 59. | East Brookfield | 2 | 8,270(0.02%)#59 | 376,336(0.00%)#2,580 |
Common Questions
What are the Top 10 Cities with the Most Immigrants from Taiwan in Massachusetts?
Top 10 Cities with the Most Immigrants from Taiwan in Massachusetts are:
#1
975
#2
601
#3
428
#4
363
#5
348
#6
317
#7
301
#8
144
#9
144
#10
141
What city has the Most Immigrants from Taiwan in Massachusetts?
Boston has the Most Immigrants from Taiwan in Massachusetts with 975.
What is the Total Immigrants from Taiwan in the State of Massachusetts?
Total Immigrants from Taiwan in Massachusetts is 8,270.
What is the Total Immigrants from Taiwan in the United States?
Total Immigrants from Taiwan in the United States is 376,336.