Cities with the Highest Percentage of Population Employed in Management in Massachusetts
RELATED REPORTS & OPTIONS
Management
Massachusetts
Compare Cities
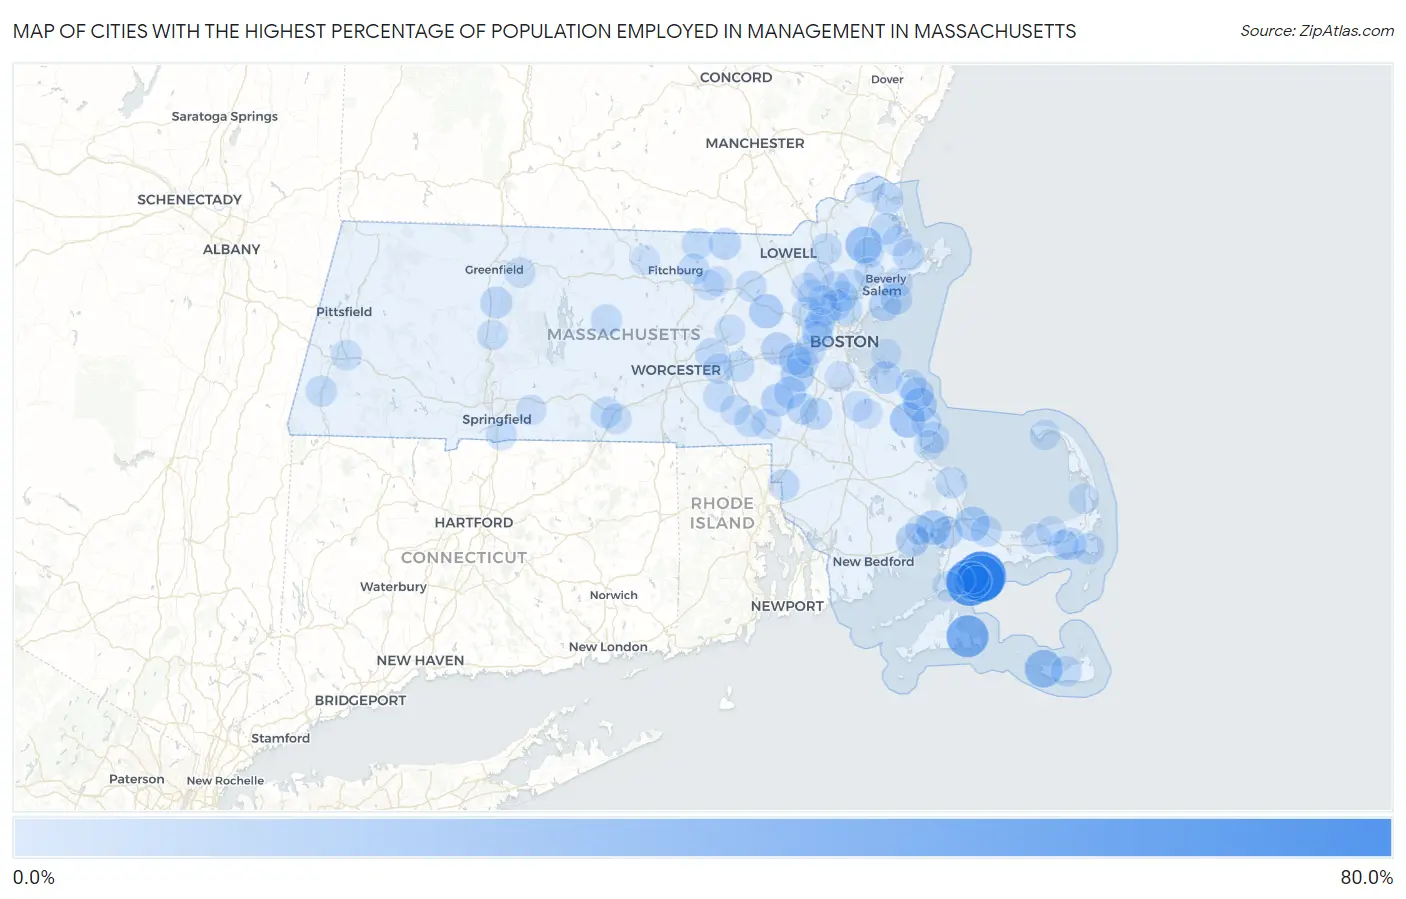
Map of Cities with the Highest Percentage of Population Employed in Management in Massachusetts
0.0%
80.0%
Cities with the Highest Percentage of Population Employed in Management in Massachusetts
| City | % Employed | vs State | vs National | |
| 1. | Popponesset Island | 76.9% | 12.7%(+64.3)#1 | 11.0%(+65.9)#92 |
| 2. | Seconsett Island | 68.9% | 12.7%(+56.2)#2 | 11.0%(+57.9)#111 |
| 3. | Popponesset | 66.4% | 12.7%(+53.7)#3 | 11.0%(+55.3)#119 |
| 4. | Edgartown | 52.1% | 12.7%(+39.4)#4 | 11.0%(+41.1)#215 |
| 5. | Madaket | 38.5% | 12.7%(+25.9)#5 | 11.0%(+27.5)#475 |
| 6. | Monomoscoy Island | 38.2% | 12.7%(+25.6)#6 | 11.0%(+27.2)#485 |
| 7. | Boxford | 35.2% | 12.7%(+22.5)#7 | 11.0%(+24.2)#603 |
| 8. | North Pembroke | 30.7% | 12.7%(+18.0)#8 | 11.0%(+19.7)#851 |
| 9. | Sandwich | 28.2% | 12.7%(+15.5)#9 | 11.0%(+17.2)#1,071 |
| 10. | Onset | 28.0% | 12.7%(+15.3)#10 | 11.0%(+16.9)#1,094 |
| 11. | West Concord | 27.2% | 12.7%(+14.5)#11 | 11.0%(+16.1)#1,173 |
| 12. | Marshfield Hills | 26.5% | 12.7%(+13.8)#12 | 11.0%(+15.4)#1,280 |
| 13. | Dover | 24.2% | 12.7%(+11.6)#13 | 11.0%(+13.2)#1,661 |
| 14. | Marion Center | 24.2% | 12.7%(+11.6)#14 | 11.0%(+13.2)#1,663 |
| 15. | Scituate | 23.2% | 12.7%(+10.5)#15 | 11.0%(+12.2)#1,871 |
| 16. | Hingham | 23.2% | 12.7%(+10.5)#16 | 11.0%(+12.2)#1,873 |
| 17. | Millis Clicquot | 23.1% | 12.7%(+10.5)#17 | 11.0%(+12.1)#1,885 |
| 18. | Cochituate | 23.0% | 12.7%(+10.3)#18 | 11.0%(+12.0)#1,921 |
| 19. | Wellesley | 23.0% | 12.7%(+10.3)#19 | 11.0%(+12.0)#1,922 |
| 20. | Bourne | 22.4% | 12.7%(+9.74)#20 | 11.0%(+11.4)#2,042 |
| 21. | Harwich Center | 21.9% | 12.7%(+9.27)#21 | 11.0%(+10.9)#2,147 |
| 22. | Medfield | 21.6% | 12.7%(+8.93)#22 | 11.0%(+10.6)#2,244 |
| 23. | Swampscott | 21.2% | 12.7%(+8.53)#23 | 11.0%(+10.2)#2,367 |
| 24. | Winchester | 20.5% | 12.7%(+7.86)#24 | 11.0%(+9.51)#2,567 |
| 25. | Essex | 20.4% | 12.7%(+7.74)#25 | 11.0%(+9.39)#2,607 |
| 26. | Marblehead | 20.2% | 12.7%(+7.52)#26 | 11.0%(+9.17)#2,677 |
| 27. | South Deerfield | 20.0% | 12.7%(+7.34)#27 | 11.0%(+9.00)#2,723 |
| 28. | Needham | 20.0% | 12.7%(+7.29)#28 | 11.0%(+8.94)#2,786 |
| 29. | Pepperell | 19.9% | 12.7%(+7.24)#29 | 11.0%(+8.89)#2,800 |
| 30. | Green Harbor | 19.8% | 12.7%(+7.10)#30 | 11.0%(+8.75)#2,846 |
| 31. | Newburyport | 19.7% | 12.7%(+7.06)#31 | 11.0%(+8.72)#2,854 |
| 32. | Melrose | 19.5% | 12.7%(+6.86)#32 | 11.0%(+8.51)#2,926 |
| 33. | Sharon | 19.4% | 12.7%(+6.75)#33 | 11.0%(+8.41)#2,968 |
| 34. | The Pinehills | 19.4% | 12.7%(+6.71)#34 | 11.0%(+8.37)#2,990 |
| 35. | Rowley | 19.3% | 12.7%(+6.58)#35 | 11.0%(+8.23)#3,042 |
| 36. | North Seekonk | 18.9% | 12.7%(+6.25)#36 | 11.0%(+7.90)#3,166 |
| 37. | Seabrook | 18.9% | 12.7%(+6.18)#37 | 11.0%(+7.83)#3,196 |
| 38. | Walpole | 18.9% | 12.7%(+6.18)#38 | 11.0%(+7.83)#3,197 |
| 39. | Northborough | 18.8% | 12.7%(+6.14)#39 | 11.0%(+7.79)#3,214 |
| 40. | Cordaville | 18.7% | 12.7%(+6.06)#40 | 11.0%(+7.71)#3,248 |
| 41. | Lexington | 18.7% | 12.7%(+6.06)#41 | 11.0%(+7.71)#3,251 |
| 42. | Bellingham | 18.7% | 12.7%(+5.98)#42 | 11.0%(+7.63)#3,284 |
| 43. | Lynnfield | 18.6% | 12.7%(+5.95)#43 | 11.0%(+7.60)#3,298 |
| 44. | West Chatham | 18.6% | 12.7%(+5.92)#44 | 11.0%(+7.57)#3,312 |
| 45. | Barre | 18.5% | 12.7%(+5.83)#45 | 11.0%(+7.48)#3,353 |
| 46. | Duxbury | 18.4% | 12.7%(+5.76)#46 | 11.0%(+7.42)#3,385 |
| 47. | Stoneham | 18.1% | 12.7%(+5.45)#47 | 11.0%(+7.10)#3,572 |
| 48. | Andover | 18.0% | 12.7%(+5.28)#48 | 11.0%(+6.94)#3,638 |
| 49. | Belmont | 17.9% | 12.7%(+5.27)#49 | 11.0%(+6.93)#3,651 |
| 50. | Townsend | 17.9% | 12.7%(+5.27)#50 | 11.0%(+6.92)#3,653 |
| 51. | East Sandwich | 17.9% | 12.7%(+5.24)#51 | 11.0%(+6.89)#3,670 |
| 52. | Great Barrington | 17.8% | 12.7%(+5.16)#52 | 11.0%(+6.81)#3,718 |
| 53. | Fiskdale | 17.8% | 12.7%(+5.12)#53 | 11.0%(+6.78)#3,730 |
| 54. | Upton | 17.7% | 12.7%(+5.04)#54 | 11.0%(+6.69)#3,776 |
| 55. | North Scituate | 17.6% | 12.7%(+4.94)#55 | 11.0%(+6.59)#3,838 |
| 56. | Nantucket | 17.3% | 12.7%(+4.59)#56 | 11.0%(+6.25)#4,029 |
| 57. | Wakefield | 17.2% | 12.7%(+4.50)#57 | 11.0%(+6.16)#4,101 |
| 58. | Newton | 17.1% | 12.7%(+4.45)#58 | 11.0%(+6.10)#4,135 |
| 59. | Littleton Common | 17.1% | 12.7%(+4.40)#59 | 11.0%(+6.05)#4,155 |
| 60. | Lunenburg | 16.9% | 12.7%(+4.20)#60 | 11.0%(+5.85)#4,259 |
| 61. | Longmeadow | 16.9% | 12.7%(+4.19)#61 | 11.0%(+5.84)#4,264 |
| 62. | Burlington | 16.6% | 12.7%(+3.97)#62 | 11.0%(+5.62)#4,425 |
| 63. | Topsfield | 16.6% | 12.7%(+3.92)#63 | 11.0%(+5.57)#4,456 |
| 64. | Sturbridge | 16.3% | 12.7%(+3.65)#64 | 11.0%(+5.31)#4,597 |
| 65. | Wilmington | 16.3% | 12.7%(+3.65)#65 | 11.0%(+5.31)#4,601 |
| 66. | New Seabury | 16.3% | 12.7%(+3.64)#66 | 11.0%(+5.29)#4,608 |
| 67. | Hudson | 16.3% | 12.7%(+3.60)#67 | 11.0%(+5.25)#4,628 |
| 68. | Lee | 16.3% | 12.7%(+3.59)#68 | 11.0%(+5.25)#4,631 |
| 69. | Shirley | 16.2% | 12.7%(+3.48)#69 | 11.0%(+5.14)#4,696 |
| 70. | Watertown Town | 16.2% | 12.7%(+3.48)#70 | 11.0%(+5.13)#4,697 |
| 71. | Provincetown | 16.1% | 12.7%(+3.41)#71 | 11.0%(+5.06)#4,755 |
| 72. | Falmouth | 16.1% | 12.7%(+3.39)#72 | 11.0%(+5.04)#4,765 |
| 73. | Westborough | 16.0% | 12.7%(+3.34)#73 | 11.0%(+4.99)#4,792 |
| 74. | Yarmouth Port | 15.8% | 12.7%(+3.11)#74 | 11.0%(+4.76)#4,983 |
| 75. | Hatfield | 15.8% | 12.7%(+3.10)#75 | 11.0%(+4.75)#4,990 |
| 76. | Franklin Town | 15.8% | 12.7%(+3.09)#76 | 11.0%(+4.75)#4,992 |
| 77. | Millers Falls | 15.7% | 12.7%(+3.00)#77 | 11.0%(+4.65)#5,086 |
| 78. | Northwest Harwich | 15.6% | 12.7%(+2.91)#78 | 11.0%(+4.56)#5,156 |
| 79. | Ipswich | 15.6% | 12.7%(+2.89)#79 | 11.0%(+4.54)#5,173 |
| 80. | Milton | 15.5% | 12.7%(+2.87)#80 | 11.0%(+4.53)#5,194 |
| 81. | North Eastham | 15.5% | 12.7%(+2.80)#81 | 11.0%(+4.45)#5,246 |
| 82. | Hopedale | 15.3% | 12.7%(+2.66)#82 | 11.0%(+4.31)#5,366 |
| 83. | Holbrook | 15.3% | 12.7%(+2.65)#83 | 11.0%(+4.30)#5,376 |
| 84. | Reading | 15.3% | 12.7%(+2.58)#84 | 11.0%(+4.23)#5,439 |
| 85. | Arlington | 15.2% | 12.7%(+2.55)#85 | 11.0%(+4.20)#5,465 |
| 86. | Wilbraham | 15.2% | 12.7%(+2.49)#86 | 11.0%(+4.14)#5,510 |
| 87. | Marshfield | 15.0% | 12.7%(+2.35)#87 | 11.0%(+4.00)#5,617 |
| 88. | Weweantic | 15.0% | 12.7%(+2.28)#88 | 11.0%(+3.93)#5,667 |
| 89. | East Dennis | 14.9% | 12.7%(+2.25)#89 | 11.0%(+3.91)#5,693 |
| 90. | South Duxbury | 14.9% | 12.7%(+2.24)#90 | 11.0%(+3.89)#5,702 |
| 91. | Beverly | 14.9% | 12.7%(+2.19)#91 | 11.0%(+3.84)#5,742 |
| 92. | Amesbury Town | 14.5% | 12.7%(+1.86)#92 | 11.0%(+3.51)#6,017 |
| 93. | Danvers | 14.5% | 12.7%(+1.83)#93 | 11.0%(+3.48)#6,052 |
| 94. | Devens | 14.5% | 12.7%(+1.79)#94 | 11.0%(+3.44)#6,083 |
| 95. | South Ashburnham | 14.4% | 12.7%(+1.74)#95 | 11.0%(+3.39)#6,126 |
| 96. | Hull | 14.3% | 12.7%(+1.61)#96 | 11.0%(+3.27)#6,216 |
| 97. | Abington | 14.2% | 12.7%(+1.51)#97 | 11.0%(+3.16)#6,371 |
| 98. | East Falmouth | 14.2% | 12.7%(+1.49)#98 | 11.0%(+3.14)#6,389 |
| 99. | Woburn | 14.1% | 12.7%(+1.46)#99 | 11.0%(+3.11)#6,416 |
| 100. | Pinehurst | 14.1% | 12.7%(+1.42)#100 | 11.0%(+3.08)#6,449 |
Common Questions
What are the Top 10 Cities with the Highest Percentage of Population Employed in Management in Massachusetts?
Top 10 Cities with the Highest Percentage of Population Employed in Management in Massachusetts are:
#1
76.9%
#2
68.9%
#3
66.4%
#4
52.1%
#5
38.5%
#6
38.2%
#7
35.2%
#8
30.7%
#9
28.2%
#10
28.0%
What city has the Highest Percentage of Population Employed in Management in Massachusetts?
Popponesset Island has the Highest Percentage of Population Employed in Management in Massachusetts with 76.9%.
What is the Percentage of Population Employed in Management in the State of Massachusetts?
Percentage of Population Employed in Management in Massachusetts is 12.7%.
What is the Percentage of Population Employed in Management in the United States?
Percentage of Population Employed in Management in the United States is 11.0%.