Cities with the Highest Percentage of Immigrants from Japan in Massachusetts
RELATED REPORTS & OPTIONS
Japan
Massachusetts
Compare Cities
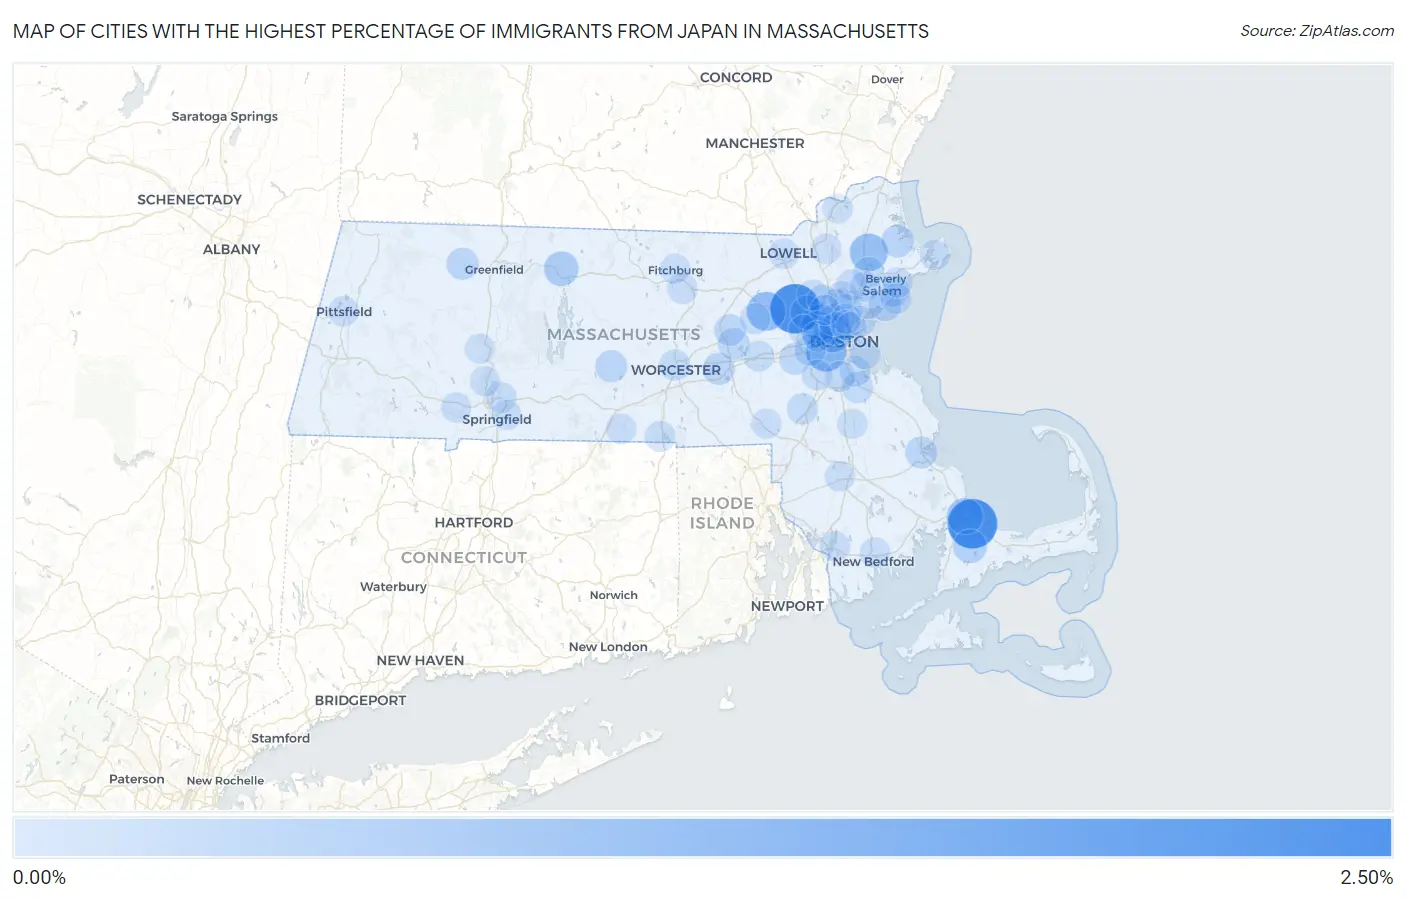
Map of Cities with the Highest Percentage of Immigrants from Japan in Massachusetts
0.00%
2.50%
Cities with the Highest Percentage of Immigrants from Japan in Massachusetts
| City | Japan | vs State | vs National | |
| 1. | Sandwich | 2.48% | 0.10%(+2.37)#1 | 0.10%(+2.37)#67 |
| 2. | Hanscom Afb | 2.47% | 0.10%(+2.36)#2 | 0.10%(+2.36)#69 |
| 3. | Brookline | 1.32% | 0.10%(+1.21)#3 | 0.10%(+1.21)#190 |
| 4. | West Concord | 1.09% | 0.10%(+0.981)#4 | 0.10%(+0.982)#250 |
| 5. | Topsfield | 0.96% | 0.10%(+0.860)#5 | 0.10%(+0.861)#299 |
| 6. | Cambridge | 0.90% | 0.10%(+0.799)#6 | 0.10%(+0.800)#324 |
| 7. | Sagamore | 0.76% | 0.10%(+0.652)#7 | 0.10%(+0.653)#415 |
| 8. | Arlington | 0.71% | 0.10%(+0.603)#8 | 0.10%(+0.605)#441 |
| 9. | Belmont | 0.61% | 0.10%(+0.507)#9 | 0.10%(+0.508)#521 |
| 10. | Orange | 0.56% | 0.10%(+0.458)#10 | 0.10%(+0.459)#574 |
| 11. | Lexington | 0.51% | 0.10%(+0.404)#11 | 0.10%(+0.405)#649 |
| 12. | Forestdale | 0.46% | 0.10%(+0.356)#12 | 0.10%(+0.357)#731 |
| 13. | Amherst | 0.35% | 0.10%(+0.243)#13 | 0.10%(+0.244)#939 |
| 14. | Ipswich | 0.31% | 0.10%(+0.203)#14 | 0.10%(+0.204)#1,045 |
| 15. | Swampscott | 0.29% | 0.10%(+0.186)#15 | 0.10%(+0.188)#1,094 |
| 16. | Somerville | 0.27% | 0.10%(+0.161)#16 | 0.10%(+0.163)#1,183 |
| 17. | Westborough | 0.25% | 0.10%(+0.147)#17 | 0.10%(+0.148)#1,248 |
| 18. | North Brookfield | 0.25% | 0.10%(+0.142)#18 | 0.10%(+0.143)#1,274 |
| 19. | Shelburne Falls | 0.24% | 0.10%(+0.131)#19 | 0.10%(+0.132)#1,326 |
| 20. | Kingston | 0.23% | 0.10%(+0.125)#20 | 0.10%(+0.126)#1,347 |
| 21. | Wellesley | 0.22% | 0.10%(+0.120)#21 | 0.10%(+0.121)#1,375 |
| 22. | Marlborough | 0.22% | 0.10%(+0.110)#22 | 0.10%(+0.112)#1,424 |
| 23. | Stoneham | 0.20% | 0.10%(+0.100)#23 | 0.10%(+0.101)#1,470 |
| 24. | Melrose | 0.20% | 0.10%(+0.096)#24 | 0.10%(+0.097)#1,495 |
| 25. | Hudson | 0.19% | 0.10%(+0.089)#25 | 0.10%(+0.090)#1,533 |
| 26. | Newton | 0.17% | 0.10%(+0.064)#26 | 0.10%(+0.065)#1,674 |
| 27. | Greenfield | 0.16% | 0.10%(+0.060)#27 | 0.10%(+0.061)#1,699 |
| 28. | Medford | 0.16% | 0.10%(+0.057)#28 | 0.10%(+0.059)#1,716 |
| 29. | Walpole | 0.14% | 0.10%(+0.037)#29 | 0.10%(+0.038)#1,883 |
| 30. | Braintree Town | 0.14% | 0.10%(+0.035)#30 | 0.10%(+0.036)#1,900 |
| 31. | Danvers | 0.13% | 0.10%(+0.028)#31 | 0.10%(+0.029)#1,951 |
| 32. | Worcester | 0.12% | 0.10%(+0.013)#32 | 0.10%(+0.014)#2,082 |
| 33. | Quincy | 0.12% | 0.10%(+0.012)#33 | 0.10%(+0.013)#2,088 |
| 34. | Salem | 0.11% | 0.10%(+0.010)#34 | 0.10%(+0.011)#2,109 |
| 35. | Maynard | 0.10% | 0.10%(-0.001)#35 | 0.10%(-0.000)#2,223 |
| 36. | Boston | 0.10% | 0.10%(-0.002)#36 | 0.10%(-0.000)#2,225 |
| 37. | Chicopee | 0.10% | 0.10%(-0.002)#37 | 0.10%(-0.001)#2,232 |
| 38. | Webster | 0.090% | 0.10%(-0.015)#38 | 0.10%(-0.014)#2,376 |
| 39. | Lynnfield | 0.085% | 0.10%(-0.019)#39 | 0.10%(-0.018)#2,420 |
| 40. | Milton | 0.084% | 0.10%(-0.020)#40 | 0.10%(-0.019)#2,434 |
| 41. | Burlington | 0.084% | 0.10%(-0.020)#41 | 0.10%(-0.019)#2,439 |
| 42. | Framingham | 0.084% | 0.10%(-0.021)#42 | 0.10%(-0.020)#2,448 |
| 43. | Dedham | 0.080% | 0.10%(-0.025)#43 | 0.10%(-0.024)#2,484 |
| 44. | Revere | 0.079% | 0.10%(-0.025)#44 | 0.10%(-0.024)#2,489 |
| 45. | Waltham | 0.076% | 0.10%(-0.029)#45 | 0.10%(-0.028)#2,541 |
| 46. | Chelsea | 0.075% | 0.10%(-0.029)#46 | 0.10%(-0.028)#2,546 |
| 47. | Woburn | 0.073% | 0.10%(-0.031)#47 | 0.10%(-0.030)#2,573 |
| 48. | Leominster | 0.060% | 0.10%(-0.045)#48 | 0.10%(-0.044)#2,743 |
| 49. | Marblehead | 0.059% | 0.10%(-0.046)#49 | 0.10%(-0.044)#2,760 |
| 50. | Pittsfield | 0.055% | 0.10%(-0.050)#50 | 0.10%(-0.049)#2,821 |
| 51. | Andover | 0.053% | 0.10%(-0.051)#51 | 0.10%(-0.050)#2,856 |
| 52. | Lowell | 0.052% | 0.10%(-0.052)#52 | 0.10%(-0.051)#2,874 |
| 53. | Watertown Town | 0.043% | 0.10%(-0.062)#53 | 0.10%(-0.061)#3,010 |
| 54. | Southbridge Town | 0.040% | 0.10%(-0.065)#54 | 0.10%(-0.064)#3,048 |
| 55. | Wakefield | 0.037% | 0.10%(-0.068)#55 | 0.10%(-0.066)#3,081 |
| 56. | Gloucester | 0.037% | 0.10%(-0.068)#56 | 0.10%(-0.067)#3,086 |
| 57. | Beverly | 0.035% | 0.10%(-0.069)#57 | 0.10%(-0.068)#3,110 |
| 58. | Winchester | 0.035% | 0.10%(-0.069)#58 | 0.10%(-0.068)#3,116 |
| 59. | Malden | 0.034% | 0.10%(-0.071)#59 | 0.10%(-0.070)#3,136 |
| 60. | Franklin Town | 0.034% | 0.10%(-0.071)#60 | 0.10%(-0.070)#3,139 |
| 61. | Fall River | 0.033% | 0.10%(-0.071)#61 | 0.10%(-0.070)#3,144 |
| 62. | New Bedford | 0.033% | 0.10%(-0.072)#62 | 0.10%(-0.071)#3,149 |
| 63. | Peabody | 0.030% | 0.10%(-0.075)#63 | 0.10%(-0.074)#3,187 |
| 64. | Westfield | 0.029% | 0.10%(-0.075)#64 | 0.10%(-0.074)#3,190 |
| 65. | Taunton | 0.027% | 0.10%(-0.078)#65 | 0.10%(-0.076)#3,237 |
| 66. | Brockton | 0.027% | 0.10%(-0.078)#66 | 0.10%(-0.077)#3,239 |
| 67. | Holyoke | 0.021% | 0.10%(-0.084)#67 | 0.10%(-0.082)#3,323 |
| 68. | Everett | 0.021% | 0.10%(-0.084)#68 | 0.10%(-0.083)#3,333 |
| 69. | Fitchburg | 0.019% | 0.10%(-0.085)#69 | 0.10%(-0.084)#3,351 |
| 70. | Lynn | 0.018% | 0.10%(-0.087)#70 | 0.10%(-0.086)#3,368 |
| 71. | Northampton | 0.011% | 0.10%(-0.094)#71 | 0.10%(-0.093)#3,470 |
| 72. | Haverhill | 0.010% | 0.10%(-0.094)#72 | 0.10%(-0.093)#3,475 |
| 73. | Springfield | 0.010% | 0.10%(-0.094)#73 | 0.10%(-0.093)#3,478 |
Common Questions
What are the Top 10 Cities with the Highest Percentage of Immigrants from Japan in Massachusetts?
Top 10 Cities with the Highest Percentage of Immigrants from Japan in Massachusetts are:
#1
2.48%
#2
2.47%
#3
1.32%
#4
1.09%
#5
0.96%
#6
0.90%
#7
0.76%
#8
0.71%
#9
0.61%
#10
0.56%
What city has the Highest Percentage of Immigrants from Japan in Massachusetts?
Sandwich has the Highest Percentage of Immigrants from Japan in Massachusetts with 2.48%.
What is the Percentage of Immigrants from Japan in the State of Massachusetts?
Percentage of Immigrants from Japan in Massachusetts is 0.10%.
What is the Percentage of Immigrants from Japan in the United States?
Percentage of Immigrants from Japan in the United States is 0.10%.