Cities with the Most Immigrants from South Africa in Massachusetts
RELATED REPORTS & OPTIONS
South Africa
Massachusetts
Compare Cities
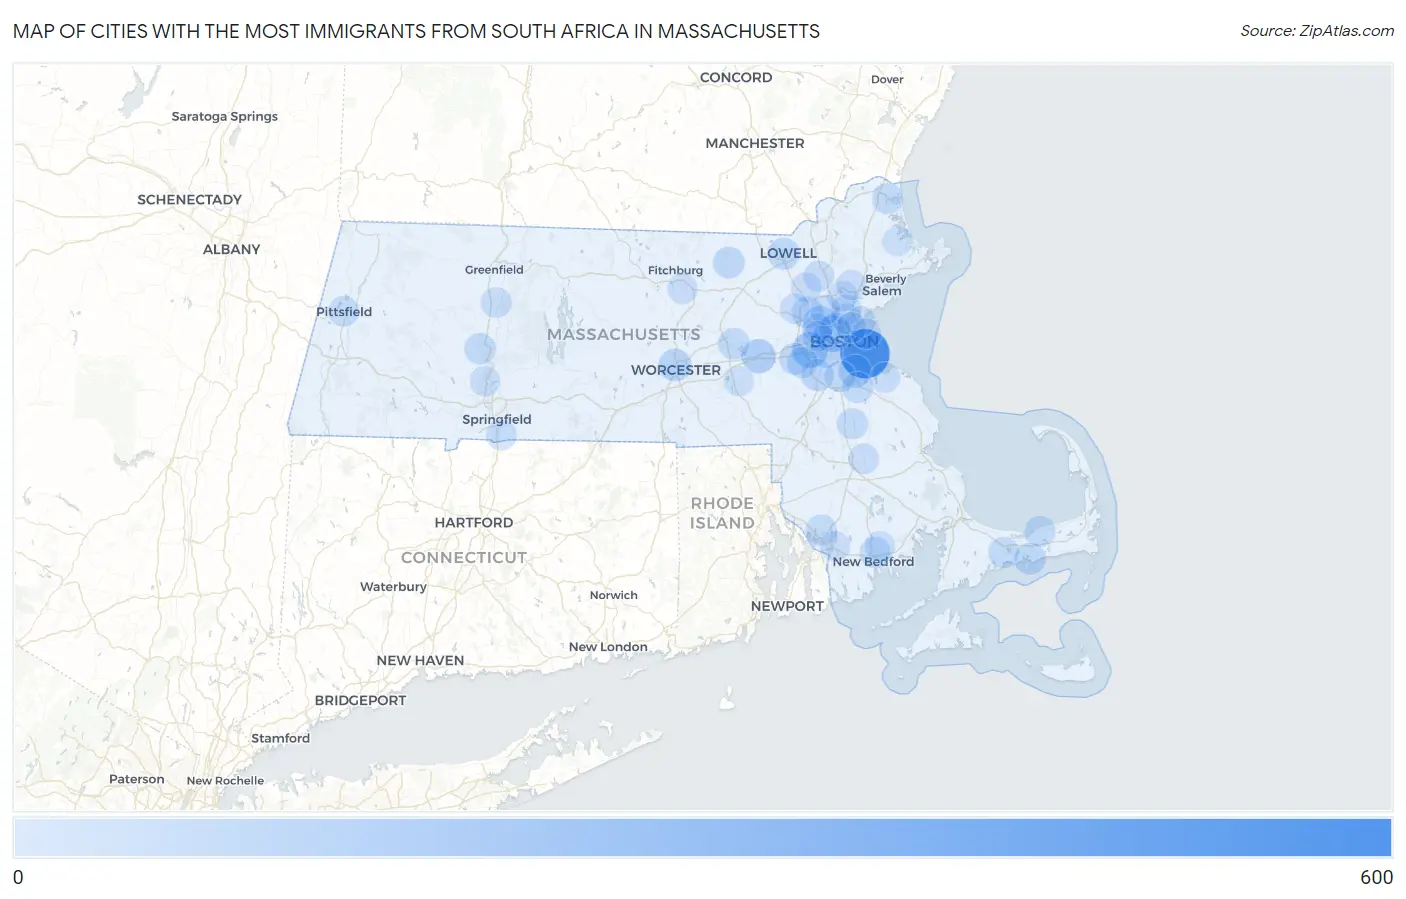
Map of Cities with the Most Immigrants from South Africa in Massachusetts
0
600
Cities with the Most Immigrants from South Africa in Massachusetts
| City | South Africa | vs State | vs National | |
| 1. | Boston | 581 | 3,270(17.77%)#1 | 117,055(0.50%)#13 |
| 2. | Cambridge | 187 | 3,270(5.72%)#2 | 117,055(0.16%)#72 |
| 3. | Newton | 163 | 3,270(4.98%)#3 | 117,055(0.14%)#85 |
| 4. | Framingham | 114 | 3,270(3.49%)#4 | 117,055(0.10%)#144 |
| 5. | Quincy | 89 | 3,270(2.72%)#5 | 117,055(0.08%)#219 |
| 6. | Arlington | 88 | 3,270(2.69%)#6 | 117,055(0.08%)#221 |
| 7. | Brookline | 76 | 3,270(2.32%)#7 | 117,055(0.06%)#273 |
| 8. | Worcester | 74 | 3,270(2.26%)#8 | 117,055(0.06%)#280 |
| 9. | Dedham | 60 | 3,270(1.83%)#9 | 117,055(0.05%)#369 |
| 10. | West Yarmouth | 52 | 3,270(1.59%)#10 | 117,055(0.04%)#430 |
| 11. | Lowell | 50 | 3,270(1.53%)#11 | 117,055(0.04%)#445 |
| 12. | Wellesley | 50 | 3,270(1.53%)#12 | 117,055(0.04%)#447 |
| 13. | Lexington | 45 | 3,270(1.38%)#13 | 117,055(0.04%)#500 |
| 14. | Groton | 45 | 3,270(1.38%)#14 | 117,055(0.04%)#507 |
| 15. | Somerville | 41 | 3,270(1.25%)#15 | 117,055(0.04%)#535 |
| 16. | Northampton | 41 | 3,270(1.25%)#16 | 117,055(0.04%)#543 |
| 17. | Marlborough | 40 | 3,270(1.22%)#17 | 117,055(0.03%)#558 |
| 18. | Needham | 35 | 3,270(1.07%)#18 | 117,055(0.03%)#636 |
| 19. | Milton | 33 | 3,270(1.01%)#19 | 117,055(0.03%)#681 |
| 20. | Braintree Town | 30 | 3,270(0.92%)#20 | 117,055(0.03%)#737 |
| 21. | Somerset | 30 | 3,270(0.92%)#21 | 117,055(0.03%)#743 |
| 22. | New Bedford | 29 | 3,270(0.89%)#22 | 117,055(0.02%)#751 |
| 23. | Newburyport | 29 | 3,270(0.89%)#23 | 117,055(0.02%)#760 |
| 24. | Brockton | 27 | 3,270(0.83%)#24 | 117,055(0.02%)#792 |
| 25. | Barnstable Town | 27 | 3,270(0.83%)#25 | 117,055(0.02%)#798 |
| 26. | Dennis | 25 | 3,270(0.76%)#26 | 117,055(0.02%)#855 |
| 27. | South Deerfield | 24 | 3,270(0.73%)#27 | 117,055(0.02%)#882 |
| 28. | Wilmington | 23 | 3,270(0.70%)#28 | 117,055(0.02%)#892 |
| 29. | Amherst | 20 | 3,270(0.61%)#29 | 117,055(0.02%)#968 |
| 30. | Melrose | 20 | 3,270(0.61%)#30 | 117,055(0.02%)#971 |
| 31. | Malden | 17 | 3,270(0.52%)#31 | 117,055(0.01%)#1,072 |
| 32. | Revere | 17 | 3,270(0.52%)#32 | 117,055(0.01%)#1,073 |
| 33. | Pittsfield | 16 | 3,270(0.49%)#33 | 117,055(0.01%)#1,125 |
| 34. | Longmeadow | 15 | 3,270(0.46%)#34 | 117,055(0.01%)#1,185 |
| 35. | Bridgewater Town | 14 | 3,270(0.43%)#35 | 117,055(0.01%)#1,218 |
| 36. | Wakefield | 14 | 3,270(0.43%)#36 | 117,055(0.01%)#1,220 |
| 37. | Fall River | 13 | 3,270(0.40%)#37 | 117,055(0.01%)#1,275 |
| 38. | Leominster | 13 | 3,270(0.40%)#38 | 117,055(0.01%)#1,286 |
| 39. | Belmont | 13 | 3,270(0.40%)#39 | 117,055(0.01%)#1,295 |
| 40. | Winthrop Town | 13 | 3,270(0.40%)#40 | 117,055(0.01%)#1,302 |
| 41. | Chelsea | 11 | 3,270(0.34%)#41 | 117,055(0.01%)#1,401 |
| 42. | Hingham | 11 | 3,270(0.34%)#42 | 117,055(0.01%)#1,426 |
| 43. | Watertown Town | 9 | 3,270(0.28%)#43 | 117,055(0.01%)#1,504 |
| 44. | Winchester | 9 | 3,270(0.28%)#44 | 117,055(0.01%)#1,514 |
| 45. | Lynnfield | 8 | 3,270(0.24%)#45 | 117,055(0.01%)#1,595 |
| 46. | Pinehurst | 8 | 3,270(0.24%)#46 | 117,055(0.01%)#1,608 |
| 47. | Holyoke | 6 | 3,270(0.18%)#47 | 117,055(0.01%)#1,693 |
| 48. | Hanscom Afb | 6 | 3,270(0.18%)#48 | 117,055(0.01%)#1,737 |
| 49. | Acushnet Center | 5 | 3,270(0.15%)#49 | 117,055(0.00%)#1,792 |
| 50. | Hopkinton | 3 | 3,270(0.09%)#50 | 117,055(0.00%)#1,910 |
| 51. | Ipswich | 1 | 3,270(0.03%)#51 | 117,055(0.00%)#2,016 |
Common Questions
What are the Top 10 Cities with the Most Immigrants from South Africa in Massachusetts?
Top 10 Cities with the Most Immigrants from South Africa in Massachusetts are:
#1
581
#2
187
#3
163
#4
114
#5
89
#6
88
#7
76
#8
74
#9
60
#10
52
What city has the Most Immigrants from South Africa in Massachusetts?
Boston has the Most Immigrants from South Africa in Massachusetts with 581.
What is the Total Immigrants from South Africa in the State of Massachusetts?
Total Immigrants from South Africa in Massachusetts is 3,270.
What is the Total Immigrants from South Africa in the United States?
Total Immigrants from South Africa in the United States is 117,055.