Cities with the Most Immigrants from Morocco in Massachusetts
RELATED REPORTS & OPTIONS
Morocco
Massachusetts
Compare Cities
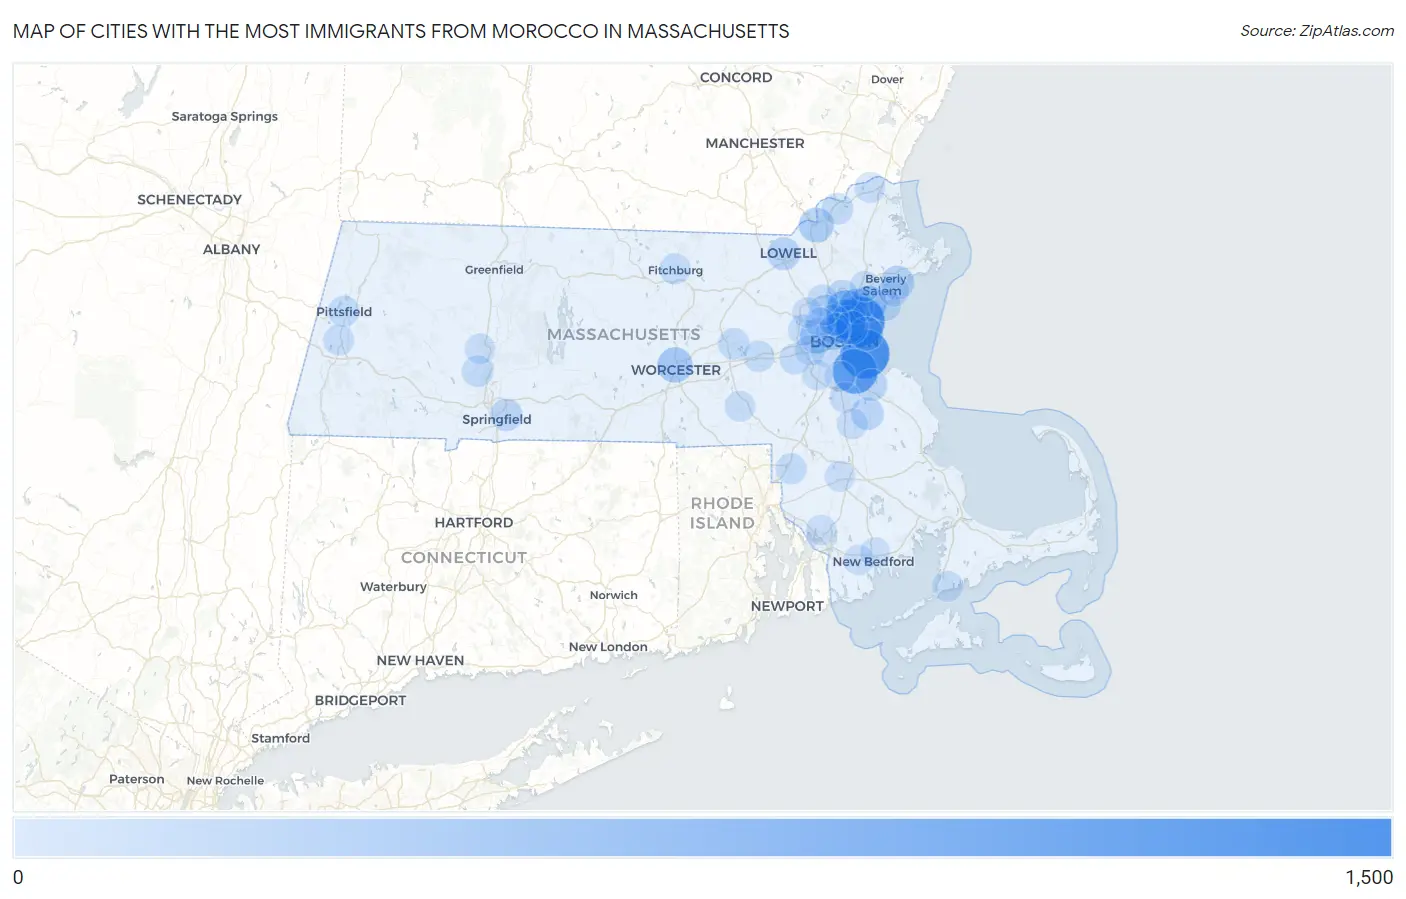
Map of Cities with the Most Immigrants from Morocco in Massachusetts
0
1,500
Cities with the Most Immigrants from Morocco in Massachusetts
| City | Morocco | vs State | vs National | |
| 1. | Revere | 1,031 | 8,562(12.04%)#1 | 88,055(1.17%)#8 |
| 2. | Boston | 1,005 | 8,562(11.74%)#2 | 88,055(1.14%)#9 |
| 3. | Quincy | 780 | 8,562(9.11%)#3 | 88,055(0.89%)#11 |
| 4. | Melrose | 491 | 8,562(5.73%)#4 | 88,055(0.56%)#17 |
| 5. | Malden | 477 | 8,562(5.57%)#5 | 88,055(0.54%)#18 |
| 6. | Everett | 437 | 8,562(5.10%)#6 | 88,055(0.50%)#21 |
| 7. | Lynn | 297 | 8,562(3.47%)#7 | 88,055(0.34%)#37 |
| 8. | Worcester | 268 | 8,562(3.13%)#8 | 88,055(0.30%)#44 |
| 9. | Saugus | 249 | 8,562(2.91%)#9 | 88,055(0.28%)#47 |
| 10. | Watertown Town | 237 | 8,562(2.77%)#10 | 88,055(0.27%)#50 |
| 11. | Methuen Town | 235 | 8,562(2.74%)#11 | 88,055(0.27%)#52 |
| 12. | Winthrop Town | 201 | 8,562(2.35%)#12 | 88,055(0.23%)#63 |
| 13. | Chelsea | 184 | 8,562(2.15%)#13 | 88,055(0.21%)#71 |
| 14. | Beverly | 177 | 8,562(2.07%)#14 | 88,055(0.20%)#72 |
| 15. | Lowell | 143 | 8,562(1.67%)#15 | 88,055(0.16%)#98 |
| 16. | Cambridge | 142 | 8,562(1.66%)#16 | 88,055(0.16%)#99 |
| 17. | Wakefield | 127 | 8,562(1.48%)#17 | 88,055(0.14%)#111 |
| 18. | Abington | 118 | 8,562(1.38%)#18 | 88,055(0.13%)#121 |
| 19. | Springfield | 108 | 8,562(1.26%)#19 | 88,055(0.12%)#134 |
| 20. | Swampscott | 102 | 8,562(1.19%)#20 | 88,055(0.12%)#149 |
| 21. | Weymouth Town | 99 | 8,562(1.16%)#21 | 88,055(0.11%)#151 |
| 22. | Somerville | 87 | 8,562(1.02%)#22 | 88,055(0.10%)#169 |
| 23. | Haverhill | 73 | 8,562(0.85%)#23 | 88,055(0.08%)#209 |
| 24. | Marlborough | 69 | 8,562(0.81%)#24 | 88,055(0.08%)#220 |
| 25. | Easthampton Town | 62 | 8,562(0.72%)#25 | 88,055(0.07%)#249 |
| 26. | Framingham | 56 | 8,562(0.65%)#26 | 88,055(0.06%)#276 |
| 27. | Fitchburg | 54 | 8,562(0.63%)#27 | 88,055(0.06%)#286 |
| 28. | Medford | 53 | 8,562(0.62%)#28 | 88,055(0.06%)#292 |
| 29. | Wellesley | 53 | 8,562(0.62%)#29 | 88,055(0.06%)#295 |
| 30. | Waltham | 52 | 8,562(0.61%)#30 | 88,055(0.06%)#296 |
| 31. | Brookline | 50 | 8,562(0.58%)#31 | 88,055(0.06%)#311 |
| 32. | Pittsfield | 49 | 8,562(0.57%)#32 | 88,055(0.06%)#320 |
| 33. | Attleboro | 44 | 8,562(0.51%)#33 | 88,055(0.05%)#359 |
| 34. | Woburn | 44 | 8,562(0.51%)#34 | 88,055(0.05%)#360 |
| 35. | North Attleborough | 44 | 8,562(0.51%)#35 | 88,055(0.05%)#361 |
| 36. | Lenox | 41 | 8,562(0.48%)#36 | 88,055(0.05%)#384 |
| 37. | Winchester | 36 | 8,562(0.42%)#37 | 88,055(0.04%)#419 |
| 38. | Falmouth | 36 | 8,562(0.42%)#38 | 88,055(0.04%)#424 |
| 39. | Amesbury Town | 35 | 8,562(0.41%)#39 | 88,055(0.04%)#434 |
| 40. | Randolph Town | 33 | 8,562(0.39%)#40 | 88,055(0.04%)#449 |
| 41. | Brockton | 32 | 8,562(0.37%)#41 | 88,055(0.04%)#458 |
| 42. | Salem | 30 | 8,562(0.35%)#42 | 88,055(0.03%)#478 |
| 43. | Milton | 29 | 8,562(0.34%)#43 | 88,055(0.03%)#502 |
| 44. | Peabody | 27 | 8,562(0.32%)#44 | 88,055(0.03%)#529 |
| 45. | Milford | 27 | 8,562(0.32%)#45 | 88,055(0.03%)#532 |
| 46. | Taunton | 25 | 8,562(0.29%)#46 | 88,055(0.03%)#564 |
| 47. | Newton | 23 | 8,562(0.27%)#47 | 88,055(0.03%)#599 |
| 48. | Northampton | 21 | 8,562(0.25%)#48 | 88,055(0.02%)#646 |
| 49. | Smith Mills | 21 | 8,562(0.25%)#49 | 88,055(0.02%)#652 |
| 50. | Lexington | 20 | 8,562(0.23%)#50 | 88,055(0.02%)#663 |
| 51. | Somerset | 18 | 8,562(0.21%)#51 | 88,055(0.02%)#710 |
| 52. | Arlington | 15 | 8,562(0.18%)#52 | 88,055(0.02%)#774 |
| 53. | Dedham | 12 | 8,562(0.14%)#53 | 88,055(0.01%)#862 |
| 54. | Amherst | 10 | 8,562(0.12%)#54 | 88,055(0.01%)#920 |
| 55. | New Bedford | 7 | 8,562(0.08%)#55 | 88,055(0.01%)#1,028 |
Common Questions
What are the Top 10 Cities with the Most Immigrants from Morocco in Massachusetts?
Top 10 Cities with the Most Immigrants from Morocco in Massachusetts are:
What city has the Most Immigrants from Morocco in Massachusetts?
Revere has the Most Immigrants from Morocco in Massachusetts with 1,031.
What is the Total Immigrants from Morocco in the State of Massachusetts?
Total Immigrants from Morocco in Massachusetts is 8,562.
What is the Total Immigrants from Morocco in the United States?
Total Immigrants from Morocco in the United States is 88,055.