Cities with the Highest Percentage of Immigrants from Jamaica in Massachusetts
RELATED REPORTS & OPTIONS
Jamaica
Massachusetts
Compare Cities
Map of Cities with the Highest Percentage of Immigrants from Jamaica in Massachusetts
0.00%
5.00%
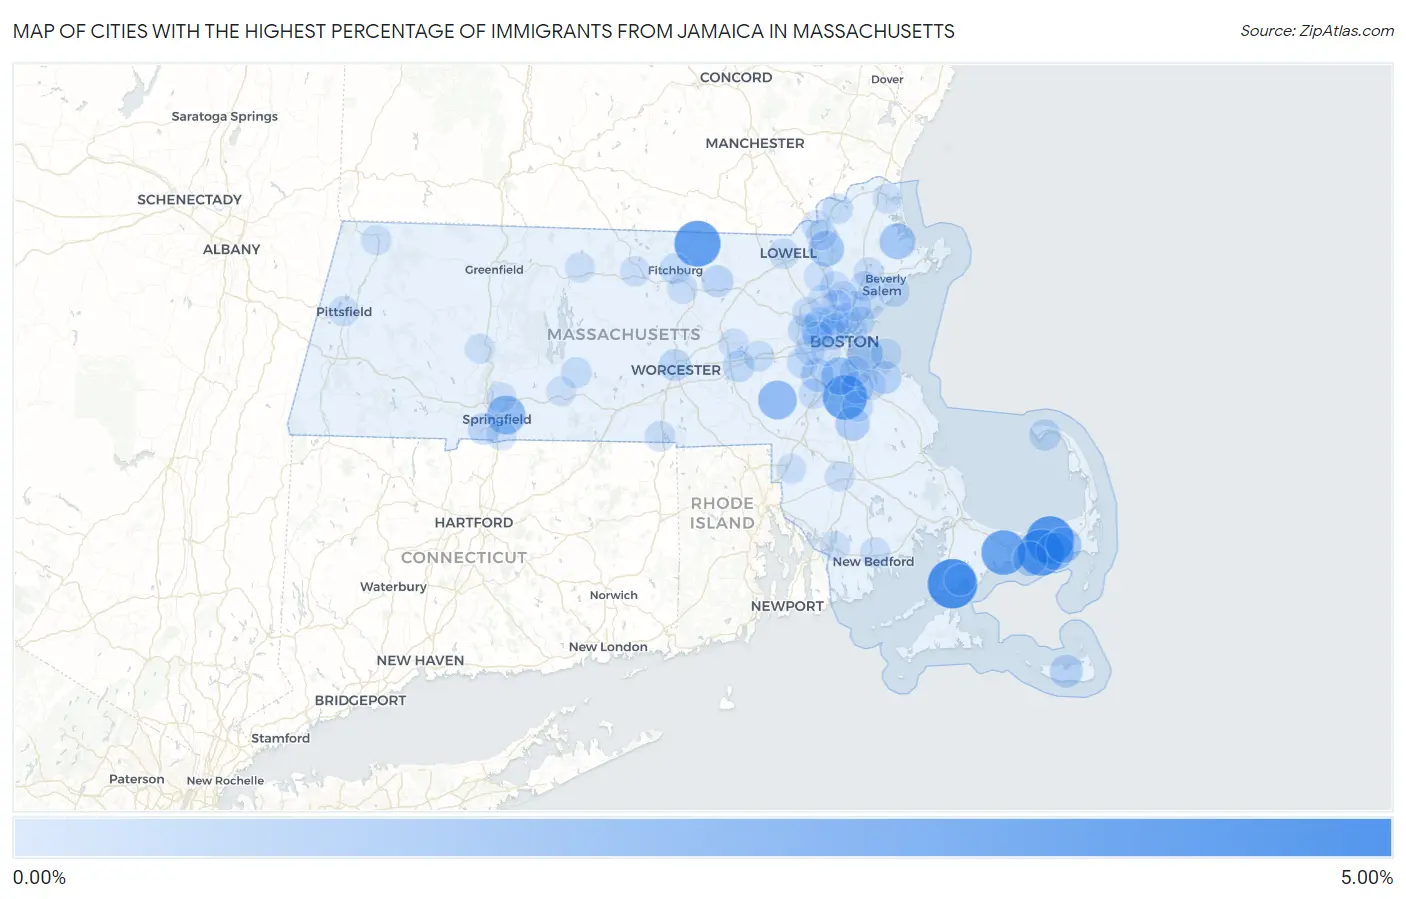
Cities with the Highest Percentage of Immigrants from Jamaica in Massachusetts
| City | Jamaica | vs State | vs National | |
| 1. | Teaticket | 4.10% | 0.31%(+3.79)#54 | 0.24%(+3.86)#5,426 |
| 2. | South Dennis | 3.71% | 0.31%(+3.40)#56 | 0.24%(+3.47)#5,614 |
| 3. | South Yarmouth | 3.43% | 0.31%(+3.12)#57 | 0.24%(+3.19)#5,615 |
| 4. | Townsend | 3.36% | 0.31%(+3.05)#76 | 0.24%(+3.12)#6,611 |
| 5. | Barnstable Town | 3.05% | 0.31%(+2.74)#77 | 0.24%(+2.81)#6,612 |
| 6. | Randolph Town | 2.98% | 0.31%(+2.67)#78 | 0.24%(+2.74)#6,613 |
| 7. | Springfield | 1.78% | 0.31%(+1.47)#79 | 0.24%(+1.54)#6,614 |
| 8. | Millis Clicquot | 1.78% | 0.31%(+1.47)#80 | 0.24%(+1.54)#6,774 |
| 9. | Dennis Port | 1.55% | 0.31%(+1.24)#91 | 0.24%(+1.31)#7,645 |
| 10. | Milton | 1.54% | 0.31%(+1.23)#92 | 0.24%(+1.30)#7,646 |
| 11. | Ipswich | 1.19% | 0.31%(+0.883)#93 | 0.24%(+0.953)#7,647 |
| 12. | Boston | 1.16% | 0.31%(+0.848)#94 | 0.24%(+0.918)#7,648 |
| 13. | Andover | 1.14% | 0.31%(+0.829)#95 | 0.24%(+0.899)#7,649 |
| 14. | Northwest Harwich | 1.13% | 0.31%(+0.821)#144 | 0.24%(+0.891)#11,405 |
| 15. | West Yarmouth | 0.95% | 0.31%(+0.644)#145 | 0.24%(+0.714)#11,406 |
| 16. | Brockton | 0.80% | 0.31%(+0.497)#146 | 0.24%(+0.567)#11,407 |
| 17. | Belmont | 0.61% | 0.31%(+0.300)#147 | 0.24%(+0.370)#11,408 |
| 18. | Hingham | 0.61% | 0.31%(+0.299)#148 | 0.24%(+0.369)#11,409 |
| 19. | Dedham | 0.60% | 0.31%(+0.297)#149 | 0.24%(+0.367)#11,410 |
| 20. | Nantucket | 0.59% | 0.31%(+0.284)#150 | 0.24%(+0.354)#11,411 |
| 21. | Braintree Town | 0.51% | 0.31%(+0.206)#151 | 0.24%(+0.276)#11,412 |
| 22. | Worcester | 0.44% | 0.31%(+0.129)#152 | 0.24%(+0.199)#11,413 |
| 23. | Devens | 0.40% | 0.31%(+0.090)#153 | 0.24%(+0.160)#11,414 |
| 24. | Agawam Town | 0.39% | 0.31%(+0.081)#154 | 0.24%(+0.151)#11,415 |
| 25. | Cordaville | 0.35% | 0.31%(+0.039)#155 | 0.24%(+0.109)#11,416 |
| 26. | North Attleborough | 0.34% | 0.31%(+0.031)#156 | 0.24%(+0.101)#11,417 |
| 27. | Provincetown | 0.32% | 0.31%(+0.013)#157 | 0.24%(+0.083)#11,418 |
| 28. | Cambridge | 0.32% | 0.31%(+0.010)#158 | 0.24%(+0.080)#11,419 |
| 29. | Waltham | 0.32% | 0.31%(+0.009)#159 | 0.24%(+0.079)#11,420 |
| 30. | Salem | 0.32% | 0.31%(+0.009)#160 | 0.24%(+0.079)#11,421 |
| 31. | East Falmouth | 0.29% | 0.31%(-0.018)#181 | 0.24%(+0.052)#14,669 |
| 32. | Needham | 0.25% | 0.31%(-0.054)#182 | 0.24%(+0.016)#14,670 |
| 33. | Holbrook | 0.23% | 0.31%(-0.078)#183 | 0.24%(-0.008)#14,671 |
| 34. | Chelsea | 0.22% | 0.31%(-0.084)#184 | 0.24%(-0.014)#14,672 |
| 35. | Fitchburg | 0.21% | 0.31%(-0.094)#185 | 0.24%(-0.024)#14,673 |
| 36. | Ware | 0.19% | 0.31%(-0.115)#186 | 0.24%(-0.045)#14,674 |
| 37. | Haverhill | 0.17% | 0.31%(-0.135)#187 | 0.24%(-0.065)#14,675 |
| 38. | Arlington | 0.16% | 0.31%(-0.144)#188 | 0.24%(-0.074)#14,676 |
| 39. | Somerville | 0.16% | 0.31%(-0.147)#189 | 0.24%(-0.077)#14,677 |
| 40. | Hull | 0.16% | 0.31%(-0.149)#190 | 0.24%(-0.079)#14,704 |
| 41. | Quincy | 0.15% | 0.31%(-0.157)#191 | 0.24%(-0.087)#14,705 |
| 42. | Lynn | 0.14% | 0.31%(-0.170)#192 | 0.24%(-0.100)#14,706 |
| 43. | Framingham | 0.14% | 0.31%(-0.171)#193 | 0.24%(-0.101)#14,707 |
| 44. | Malden | 0.12% | 0.31%(-0.185)#194 | 0.24%(-0.115)#14,708 |
| 45. | Lawrence | 0.12% | 0.31%(-0.187)#195 | 0.24%(-0.117)#14,709 |
| 46. | Lexington | 0.12% | 0.31%(-0.188)#196 | 0.24%(-0.118)#14,710 |
| 47. | Norwood | 0.12% | 0.31%(-0.189)#197 | 0.24%(-0.119)#14,711 |
| 48. | Reading | 0.12% | 0.31%(-0.189)#198 | 0.24%(-0.119)#14,712 |
| 49. | Webster | 0.11% | 0.31%(-0.193)#199 | 0.24%(-0.123)#14,713 |
| 50. | Lowell | 0.11% | 0.31%(-0.196)#200 | 0.24%(-0.126)#14,714 |
| 51. | Danvers | 0.11% | 0.31%(-0.200)#201 | 0.24%(-0.130)#14,715 |
| 52. | Longmeadow | 0.10% | 0.31%(-0.206)#202 | 0.24%(-0.136)#14,716 |
| 53. | Peabody | 0.098% | 0.31%(-0.210)#203 | 0.24%(-0.140)#14,717 |
| 54. | Marlborough | 0.087% | 0.31%(-0.220)#204 | 0.24%(-0.150)#14,718 |
| 55. | Medford | 0.081% | 0.31%(-0.226)#205 | 0.24%(-0.156)#14,719 |
| 56. | Revere | 0.073% | 0.31%(-0.235)#206 | 0.24%(-0.165)#14,720 |
| 57. | New Bedford | 0.067% | 0.31%(-0.241)#207 | 0.24%(-0.171)#14,721 |
| 58. | Saugus | 0.063% | 0.31%(-0.244)#208 | 0.24%(-0.174)#14,722 |
| 59. | Wakefield | 0.059% | 0.31%(-0.248)#209 | 0.24%(-0.178)#14,723 |
| 60. | Taunton | 0.057% | 0.31%(-0.250)#210 | 0.24%(-0.180)#14,724 |
| 61. | Stoneham | 0.057% | 0.31%(-0.251)#211 | 0.24%(-0.181)#14,725 |
| 62. | Leominster | 0.055% | 0.31%(-0.252)#212 | 0.24%(-0.182)#14,726 |
| 63. | North Adams | 0.054% | 0.31%(-0.253)#213 | 0.24%(-0.183)#14,727 |
| 64. | Weymouth Town | 0.054% | 0.31%(-0.253)#214 | 0.24%(-0.183)#14,728 |
| 65. | Amherst | 0.054% | 0.31%(-0.253)#215 | 0.24%(-0.183)#14,729 |
| 66. | Chicopee | 0.045% | 0.31%(-0.262)#216 | 0.24%(-0.192)#14,730 |
| 67. | Gardner | 0.043% | 0.31%(-0.265)#217 | 0.24%(-0.195)#14,731 |
| 68. | Newton | 0.041% | 0.31%(-0.267)#218 | 0.24%(-0.197)#14,732 |
| 69. | Pittsfield | 0.039% | 0.31%(-0.269)#219 | 0.24%(-0.199)#14,733 |
| 70. | Fall River | 0.029% | 0.31%(-0.279)#220 | 0.24%(-0.209)#14,734 |
| 71. | Methuen Town | 0.028% | 0.31%(-0.279)#221 | 0.24%(-0.209)#14,735 |
| 72. | Northampton | 0.018% | 0.31%(-0.290)#222 | 0.24%(-0.220)#14,736 |
| 73. | Watertown Town | 0.017% | 0.31%(-0.290)#223 | 0.24%(-0.220)#14,737 |
| 74. | Newburyport | 0.016% | 0.31%(-0.291)#224 | 0.24%(-0.221)#14,738 |
| 75. | Brookline | 0.016% | 0.31%(-0.291)#225 | 0.24%(-0.221)#14,739 |
| 76. | Athol | 0.011% | 0.31%(-0.296)#226 | 0.24%(-0.226)#14,740 |
| 77. | Attleboro | 0.011% | 0.31%(-0.297)#227 | 0.24%(-0.227)#14,741 |
| 78. | Woburn | 0.0098% | 0.31%(-0.298)#228 | 0.24%(-0.228)#14,742 |
| 79. | Palmer Town | 0.0081% | 0.31%(-0.299)#229 | 0.24%(-0.229)#15,761 |
| 80. | Wilmington | 0.0043% | 0.31%(-0.303)#230 | 0.24%(-0.233)#15,762 |
Common Questions
What are the Top 10 Cities with the Highest Percentage of Immigrants from Jamaica in Massachusetts?
Top 10 Cities with the Highest Percentage of Immigrants from Jamaica in Massachusetts are:
#1
4.10%
#2
3.71%
#3
3.43%
#4
3.36%
#5
3.05%
#6
2.98%
#7
1.78%
#8
1.78%
#9
1.55%
#10
1.54%
What city has the Highest Percentage of Immigrants from Jamaica in Massachusetts?
Teaticket has the Highest Percentage of Immigrants from Jamaica in Massachusetts with 4.10%.
What is the Percentage of Immigrants from Jamaica in the State of Massachusetts?
Percentage of Immigrants from Jamaica in Massachusetts is 0.31%.
What is the Percentage of Immigrants from Jamaica in the United States?
Percentage of Immigrants from Jamaica in the United States is 0.24%.