Cities with the Highest Wage/Income Gap (%) in Massachusetts
RELATED REPORTS & OPTIONS
Highest Wage/Income Gap (%)
Massachusetts
Compare Cities
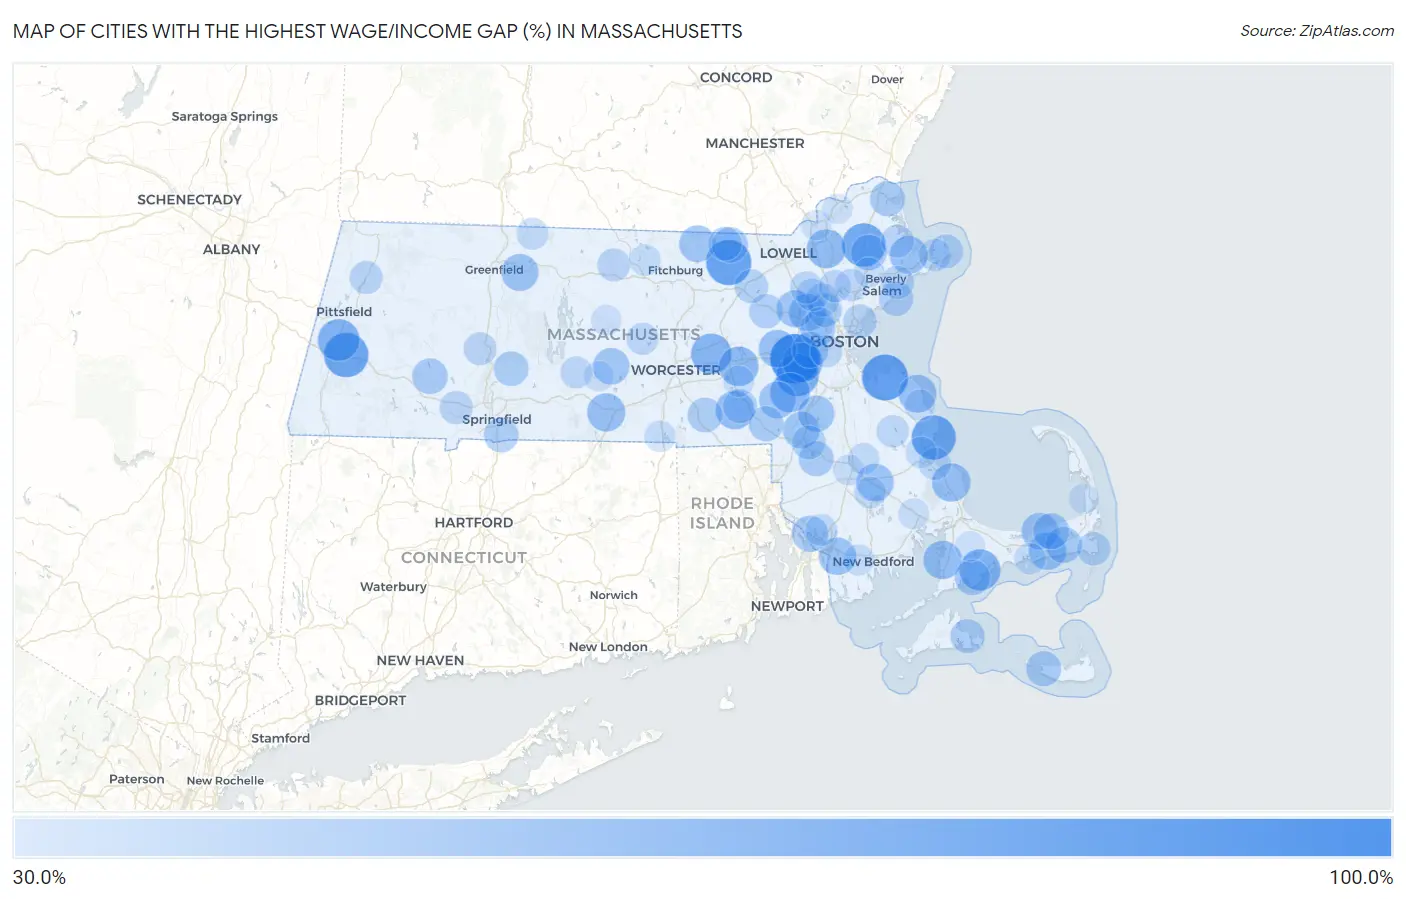
Map of Cities with the Highest Wage/Income Gap (%) in Massachusetts
0.0%
100.0%
Cities with the Highest Wage/Income Gap (%) in Massachusetts
| City | Wage/Income Gap (%) | vs State | vs National | |
| 1. | Wellesley | 81.7% | 26.8%(+0.549)#1 | 28.0%(+0.537)#161 |
| 2. | Hingham | 72.1% | 26.8%(+0.453)#2 | 28.0%(+0.441)#412 |
| 3. | Groton | 69.9% | 26.8%(+0.432)#3 | 28.0%(+0.419)#510 |
| 4. | Lee | 68.0% | 26.8%(+0.413)#4 | 28.0%(+0.400)#645 |
| 5. | Duxbury | 67.6% | 26.8%(+0.408)#5 | 28.0%(+0.396)#681 |
| 6. | Boxford | 65.5% | 26.8%(+0.387)#6 | 28.0%(+0.375)#839 |
| 7. | Dover | 62.5% | 26.8%(+0.357)#7 | 28.0%(+0.345)#1,153 |
| 8. | Lenox | 60.6% | 26.8%(+0.338)#8 | 28.0%(+0.326)#1,372 |
| 9. | Mashpee Neck | 59.3% | 26.8%(+0.325)#9 | 28.0%(+0.313)#1,540 |
| 10. | Northborough | 57.3% | 26.8%(+0.306)#10 | 28.0%(+0.294)#1,848 |
| 11. | Needham | 55.6% | 26.8%(+0.289)#11 | 28.0%(+0.276)#2,176 |
| 12. | Medfield | 54.9% | 26.8%(+0.282)#12 | 28.0%(+0.270)#2,300 |
| 13. | Cordaville | 54.7% | 26.8%(+0.280)#13 | 28.0%(+0.267)#2,348 |
| 14. | Andover | 53.1% | 26.8%(+0.263)#14 | 28.0%(+0.251)#2,720 |
| 15. | Hopedale | 52.5% | 26.8%(+0.257)#15 | 28.0%(+0.245)#2,850 |
| 16. | The Pinehills | 52.1% | 26.8%(+0.253)#16 | 28.0%(+0.241)#2,962 |
| 17. | North Falmouth | 51.8% | 26.8%(+0.251)#17 | 28.0%(+0.238)#3,023 |
| 18. | Fiskdale | 51.1% | 26.8%(+0.243)#18 | 28.0%(+0.231)#3,204 |
| 19. | Scituate | 50.5% | 26.8%(+0.237)#19 | 28.0%(+0.225)#3,360 |
| 20. | Essex | 50.3% | 26.8%(+0.236)#20 | 28.0%(+0.224)#3,394 |
| 21. | Cochituate | 49.8% | 26.8%(+0.230)#21 | 28.0%(+0.218)#3,551 |
| 22. | Middleborough Center | 49.3% | 26.8%(+0.226)#22 | 28.0%(+0.213)#3,673 |
| 23. | West Dennis | 49.3% | 26.8%(+0.225)#23 | 28.0%(+0.213)#3,696 |
| 24. | North Westport | 49.0% | 26.8%(+0.223)#24 | 28.0%(+0.211)#3,770 |
| 25. | Millers Falls | 48.6% | 26.8%(+0.218)#25 | 28.0%(+0.206)#3,906 |
| 26. | Lexington | 48.1% | 26.8%(+0.214)#26 | 28.0%(+0.201)#4,053 |
| 27. | Dennis | 47.8% | 26.8%(+0.211)#27 | 28.0%(+0.199)#4,147 |
| 28. | Millis Clicquot | 47.7% | 26.8%(+0.209)#28 | 28.0%(+0.197)#4,192 |
| 29. | Hanscom Afb | 47.7% | 26.8%(+0.209)#29 | 28.0%(+0.197)#4,205 |
| 30. | Townsend | 47.3% | 26.8%(+0.205)#30 | 28.0%(+0.193)#4,337 |
| 31. | Foxborough | 47.0% | 26.8%(+0.203)#31 | 28.0%(+0.190)#4,409 |
| 32. | North Brookfield | 46.9% | 26.8%(+0.202)#32 | 28.0%(+0.189)#4,449 |
| 33. | Sharon | 46.6% | 26.8%(+0.199)#33 | 28.0%(+0.187)#4,556 |
| 34. | Ocean Grove | 46.1% | 26.8%(+0.194)#34 | 28.0%(+0.181)#4,707 |
| 35. | Northwest Harwich | 46.0% | 26.8%(+0.192)#35 | 28.0%(+0.180)#4,764 |
| 36. | Newton | 45.6% | 26.8%(+0.189)#36 | 28.0%(+0.177)#4,895 |
| 37. | East Dennis | 45.6% | 26.8%(+0.188)#37 | 28.0%(+0.176)#4,927 |
| 38. | Topsfield | 44.9% | 26.8%(+0.181)#38 | 28.0%(+0.169)#5,184 |
| 39. | East Pepperell | 44.6% | 26.8%(+0.178)#39 | 28.0%(+0.166)#5,314 |
| 40. | Huntington | 44.4% | 26.8%(+0.176)#40 | 28.0%(+0.164)#5,368 |
| 41. | Seabrook | 44.3% | 26.8%(+0.176)#41 | 28.0%(+0.163)#5,398 |
| 42. | Belmont | 43.6% | 26.8%(+0.168)#42 | 28.0%(+0.156)#5,704 |
| 43. | Madaket | 43.0% | 26.8%(+0.163)#43 | 28.0%(+0.150)#5,944 |
| 44. | Franklin Town | 42.9% | 26.8%(+0.162)#44 | 28.0%(+0.150)#5,979 |
| 45. | Newburyport | 42.9% | 26.8%(+0.161)#45 | 28.0%(+0.149)#6,016 |
| 46. | Norton Center | 42.8% | 26.8%(+0.161)#46 | 28.0%(+0.149)#6,033 |
| 47. | Whitinsville | 42.2% | 26.8%(+0.155)#47 | 28.0%(+0.143)#6,282 |
| 48. | Granby | 42.2% | 26.8%(+0.154)#48 | 28.0%(+0.142)#6,316 |
| 49. | Longmeadow | 42.0% | 26.8%(+0.152)#49 | 28.0%(+0.140)#6,389 |
| 50. | Edgartown | 41.1% | 26.8%(+0.143)#50 | 28.0%(+0.131)#6,779 |
| 51. | Marblehead | 40.9% | 26.8%(+0.142)#51 | 28.0%(+0.129)#6,833 |
| 52. | Milford | 40.6% | 26.8%(+0.139)#52 | 28.0%(+0.126)#6,968 |
| 53. | West Concord | 40.5% | 26.8%(+0.138)#53 | 28.0%(+0.125)#6,996 |
| 54. | Mansfield Center | 40.1% | 26.8%(+0.133)#54 | 28.0%(+0.121)#7,186 |
| 55. | Winchester | 40.0% | 26.8%(+0.132)#55 | 28.0%(+0.120)#7,245 |
| 56. | Rockport | 39.8% | 26.8%(+0.130)#56 | 28.0%(+0.118)#7,340 |
| 57. | Pepperell | 39.6% | 26.8%(+0.129)#57 | 28.0%(+0.116)#7,403 |
| 58. | Littleton Common | 39.5% | 26.8%(+0.127)#58 | 28.0%(+0.115)#7,474 |
| 59. | Revere | 38.9% | 26.8%(+0.121)#59 | 28.0%(+0.109)#7,754 |
| 60. | Woburn | 38.7% | 26.8%(+0.120)#60 | 28.0%(+0.108)#7,811 |
| 61. | Chatham | 38.7% | 26.8%(+0.119)#61 | 28.0%(+0.107)#7,851 |
| 62. | Westfield | 38.4% | 26.8%(+0.117)#62 | 28.0%(+0.104)#7,951 |
| 63. | Beverly | 38.2% | 26.8%(+0.114)#63 | 28.0%(+0.102)#8,076 |
| 64. | Cheshire | 37.8% | 26.8%(+0.110)#64 | 28.0%(+0.098)#8,264 |
| 65. | Northampton | 37.5% | 26.8%(+0.107)#65 | 28.0%(+0.095)#8,433 |
| 66. | Baldwinville | 37.4% | 26.8%(+0.106)#66 | 28.0%(+0.094)#8,459 |
| 67. | Ipswich | 36.9% | 26.8%(+0.102)#67 | 28.0%(+0.089)#8,711 |
| 68. | Burlington | 36.5% | 26.8%(+0.098)#68 | 28.0%(+0.085)#8,911 |
| 69. | Plymouth | 36.4% | 26.8%(+0.097)#69 | 28.0%(+0.085)#8,957 |
| 70. | Gloucester | 36.3% | 26.8%(+0.095)#70 | 28.0%(+0.083)#9,040 |
| 71. | West Warren | 36.3% | 26.8%(+0.095)#71 | 28.0%(+0.083)#9,052 |
| 72. | Pinehurst | 36.2% | 26.8%(+0.094)#72 | 28.0%(+0.082)#9,098 |
| 73. | Brookline | 35.9% | 26.8%(+0.091)#73 | 28.0%(+0.079)#9,226 |
| 74. | Hanson | 35.8% | 26.8%(+0.091)#74 | 28.0%(+0.079)#9,250 |
| 75. | Lynnfield | 35.7% | 26.8%(+0.089)#75 | 28.0%(+0.077)#9,328 |
| 76. | Reading | 35.6% | 26.8%(+0.088)#76 | 28.0%(+0.076)#9,391 |
| 77. | Rutland | 35.5% | 26.8%(+0.087)#77 | 28.0%(+0.075)#9,428 |
| 78. | Ware | 35.2% | 26.8%(+0.084)#78 | 28.0%(+0.072)#9,585 |
| 79. | Northfield | 34.9% | 26.8%(+0.081)#79 | 28.0%(+0.069)#9,791 |
| 80. | North Attleborough | 34.9% | 26.8%(+0.081)#80 | 28.0%(+0.069)#9,792 |
| 81. | Somerset | 34.8% | 26.8%(+0.080)#81 | 28.0%(+0.068)#9,846 |
| 82. | North Lakeville | 34.7% | 26.8%(+0.079)#82 | 28.0%(+0.067)#9,900 |
| 83. | Kingston | 34.1% | 26.8%(+0.074)#83 | 28.0%(+0.061)#10,176 |
| 84. | West Yarmouth | 33.9% | 26.8%(+0.072)#84 | 28.0%(+0.059)#10,286 |
| 85. | Bridgewater Town | 33.6% | 26.8%(+0.069)#85 | 28.0%(+0.057)#10,441 |
| 86. | South Ashburnham | 33.4% | 26.8%(+0.066)#86 | 28.0%(+0.054)#10,598 |
| 87. | Webster | 33.0% | 26.8%(+0.063)#87 | 28.0%(+0.051)#10,782 |
| 88. | Hopkinton | 33.0% | 26.8%(+0.062)#88 | 28.0%(+0.050)#10,812 |
| 89. | Smith Mills | 32.9% | 26.8%(+0.061)#89 | 28.0%(+0.049)#10,854 |
| 90. | Marshfield Hills | 32.4% | 26.8%(+0.057)#90 | 28.0%(+0.044)#11,094 |
| 91. | West Wareham | 32.4% | 26.8%(+0.057)#91 | 28.0%(+0.044)#11,098 |
| 92. | Raynham Center | 32.0% | 26.8%(+0.053)#92 | 28.0%(+0.040)#11,324 |
| 93. | Barre | 31.3% | 26.8%(+0.046)#93 | 28.0%(+0.034)#11,694 |
| 94. | Methuen Town | 30.9% | 26.8%(+0.042)#94 | 28.0%(+0.030)#11,896 |
| 95. | West Brookfield | 30.9% | 26.8%(+0.041)#95 | 28.0%(+0.029)#11,924 |
| 96. | Arlington | 30.6% | 26.8%(+0.038)#96 | 28.0%(+0.026)#12,064 |
| 97. | North Eastham | 30.5% | 26.8%(+0.038)#97 | 28.0%(+0.025)#12,104 |
| 98. | Forestdale | 30.5% | 26.8%(+0.037)#98 | 28.0%(+0.025)#12,121 |
| 99. | Haverhill | 30.5% | 26.8%(+0.037)#99 | 28.0%(+0.025)#12,122 |
| 100. | Danvers | 30.4% | 26.8%(+0.036)#100 | 28.0%(+0.024)#12,203 |
Common Questions
What are the Top 10 Cities with the Highest Wage/Income Gap (%) in Massachusetts?
Top 10 Cities with the Highest Wage/Income Gap (%) in Massachusetts are:
#1
81.7%
#2
72.1%
#3
69.9%
#4
68.0%
#5
67.6%
#6
65.5%
#7
62.5%
#8
60.6%
#9
59.3%
#10
57.3%
What city has the Highest Wage/Income Gap (%) in Massachusetts?
Wellesley has the Highest Wage/Income Gap (%) in Massachusetts with 81.7%.
What is the Wage / Income Gap in Percentage Terms in the State of Massachusetts?
Wage / Income Gap in Percentage Terms in Massachusetts is 26.8%.
What is the Wage / Income Gap in Percentage Terms in the United States?
Wage / Income Gap in Percentage Terms in the United States is 28.0%.