Cities with the Highest Percentage of Population with a Degree in Engineering in Massachusetts
RELATED REPORTS & OPTIONS
Engineering
Massachusetts
Compare Cities
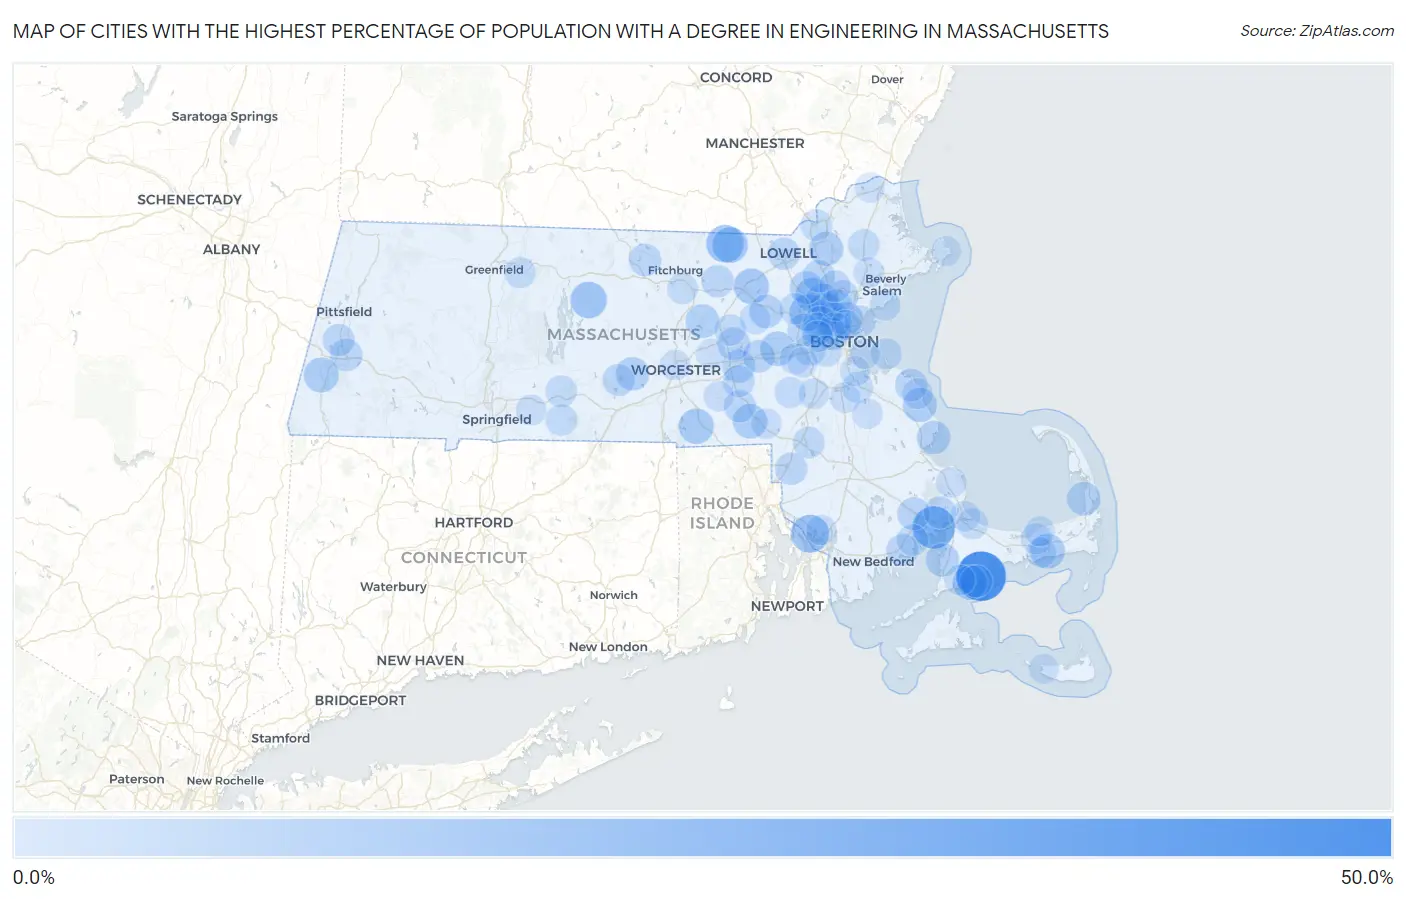
Map of Cities with the Highest Percentage of Population with a Degree in Engineering in Massachusetts
0.0%
50.0%
Cities with the Highest Percentage of Population with a Degree in Engineering in Massachusetts
| City | % Graduates | vs State | vs National | |
| 1. | Popponesset Island | 40.8% | 8.7%(+32.1)#1 | 7.6%(+33.2)#256 |
| 2. | Onset | 28.2% | 8.7%(+19.5)#2 | 7.6%(+20.6)#518 |
| 3. | Ocean Grove | 20.5% | 8.7%(+11.8)#3 | 7.6%(+12.9)#993 |
| 4. | Pepperell | 19.4% | 8.7%(+10.7)#4 | 7.6%(+11.7)#1,118 |
| 5. | Petersham | 17.8% | 8.7%(+9.10)#5 | 7.6%(+10.2)#1,310 |
| 6. | Lexington | 17.4% | 8.7%(+8.67)#6 | 7.6%(+9.75)#1,368 |
| 7. | East Pepperell | 16.6% | 8.7%(+7.91)#7 | 7.6%(+8.98)#1,541 |
| 8. | Littleton Common | 15.9% | 8.7%(+7.22)#8 | 7.6%(+8.29)#1,669 |
| 9. | East Douglas | 15.8% | 8.7%(+7.11)#9 | 7.6%(+8.18)#1,694 |
| 10. | West Dennis | 15.2% | 8.7%(+6.51)#10 | 7.6%(+7.58)#1,823 |
| 11. | Housatonic | 15.1% | 8.7%(+6.39)#11 | 7.6%(+7.47)#1,847 |
| 12. | Seconsett Island | 14.7% | 8.7%(+5.99)#12 | 7.6%(+7.06)#1,936 |
| 13. | Cochituate | 14.7% | 8.7%(+5.95)#13 | 7.6%(+7.03)#1,941 |
| 14. | Bellingham | 14.6% | 8.7%(+5.88)#14 | 7.6%(+6.95)#1,958 |
| 15. | Burlington | 14.5% | 8.7%(+5.83)#15 | 7.6%(+6.90)#1,967 |
| 16. | Medford | 14.4% | 8.7%(+5.63)#16 | 7.6%(+6.70)#2,009 |
| 17. | Marshfield Hills | 13.9% | 8.7%(+5.21)#17 | 7.6%(+6.28)#2,169 |
| 18. | Andover | 13.9% | 8.7%(+5.15)#18 | 7.6%(+6.22)#2,195 |
| 19. | Winchester | 13.6% | 8.7%(+4.89)#19 | 7.6%(+5.96)#2,271 |
| 20. | Clinton | 13.4% | 8.7%(+4.71)#20 | 7.6%(+5.78)#2,330 |
| 21. | Duxbury | 12.9% | 8.7%(+4.20)#21 | 7.6%(+5.27)#2,525 |
| 22. | West Concord | 12.9% | 8.7%(+4.18)#22 | 7.6%(+5.25)#2,533 |
| 23. | North Eastham | 12.9% | 8.7%(+4.14)#23 | 7.6%(+5.21)#2,544 |
| 24. | Spencer | 12.7% | 8.7%(+3.98)#24 | 7.6%(+5.06)#2,599 |
| 25. | Malden | 12.7% | 8.7%(+3.98)#25 | 7.6%(+5.05)#2,601 |
| 26. | North Falmouth | 12.6% | 8.7%(+3.92)#26 | 7.6%(+5.00)#2,624 |
| 27. | Woburn | 12.3% | 8.7%(+3.61)#27 | 7.6%(+4.69)#2,762 |
| 28. | Cordaville | 12.1% | 8.7%(+3.34)#28 | 7.6%(+4.42)#2,866 |
| 29. | Pinehurst | 12.0% | 8.7%(+3.25)#29 | 7.6%(+4.33)#2,902 |
| 30. | Marlborough | 11.8% | 8.7%(+3.08)#30 | 7.6%(+4.15)#2,982 |
| 31. | West Wareham | 11.8% | 8.7%(+3.04)#31 | 7.6%(+4.12)#2,994 |
| 32. | Arlington | 11.7% | 8.7%(+3.00)#32 | 7.6%(+4.07)#3,019 |
| 33. | Cambridge | 11.5% | 8.7%(+2.78)#33 | 7.6%(+3.85)#3,124 |
| 34. | Lee | 11.4% | 8.7%(+2.65)#34 | 7.6%(+3.73)#3,180 |
| 35. | Waltham | 11.4% | 8.7%(+2.64)#35 | 7.6%(+3.71)#3,196 |
| 36. | Framingham | 11.2% | 8.7%(+2.50)#36 | 7.6%(+3.57)#3,259 |
| 37. | North Scituate | 11.2% | 8.7%(+2.47)#37 | 7.6%(+3.54)#3,282 |
| 38. | Somerville | 11.2% | 8.7%(+2.46)#38 | 7.6%(+3.53)#3,288 |
| 39. | Belmont | 11.1% | 8.7%(+2.37)#39 | 7.6%(+3.44)#3,361 |
| 40. | South Ashburnham | 11.0% | 8.7%(+2.29)#40 | 7.6%(+3.36)#3,396 |
| 41. | Lowell | 10.9% | 8.7%(+2.15)#41 | 7.6%(+3.22)#3,484 |
| 42. | Devens | 10.8% | 8.7%(+2.13)#42 | 7.6%(+3.20)#3,491 |
| 43. | Milford | 10.8% | 8.7%(+2.11)#43 | 7.6%(+3.19)#3,503 |
| 44. | Wilmington | 10.8% | 8.7%(+2.10)#44 | 7.6%(+3.18)#3,507 |
| 45. | White Island Shores | 10.7% | 8.7%(+1.95)#45 | 7.6%(+3.02)#3,610 |
| 46. | New Seabury | 10.7% | 8.7%(+1.94)#46 | 7.6%(+3.01)#3,614 |
| 47. | Attleboro | 10.6% | 8.7%(+1.93)#47 | 7.6%(+3.00)#3,618 |
| 48. | Mattapoisett Center | 10.5% | 8.7%(+1.81)#48 | 7.6%(+2.88)#3,686 |
| 49. | East Brookfield | 10.4% | 8.7%(+1.68)#49 | 7.6%(+2.76)#3,788 |
| 50. | Wakefield | 10.4% | 8.7%(+1.68)#50 | 7.6%(+2.75)#3,795 |
| 51. | Lenox | 10.3% | 8.7%(+1.58)#51 | 7.6%(+2.65)#3,873 |
| 52. | Stoneham | 10.2% | 8.7%(+1.49)#52 | 7.6%(+2.56)#3,929 |
| 53. | Hopkinton | 10.1% | 8.7%(+1.41)#53 | 7.6%(+2.49)#3,982 |
| 54. | Revere | 9.9% | 8.7%(+1.23)#54 | 7.6%(+2.30)#4,131 |
| 55. | Mansfield Center | 9.7% | 8.7%(+1.02)#55 | 7.6%(+2.09)#4,289 |
| 56. | Reading | 9.7% | 8.7%(+1.01)#56 | 7.6%(+2.09)#4,295 |
| 57. | Methuen Town | 9.6% | 8.7%(+0.905)#57 | 7.6%(+1.98)#4,365 |
| 58. | Marion Center | 9.6% | 8.7%(+0.891)#58 | 7.6%(+1.96)#4,381 |
| 59. | Palmer Town | 9.6% | 8.7%(+0.862)#59 | 7.6%(+1.93)#4,402 |
| 60. | Boxford | 9.5% | 8.7%(+0.818)#60 | 7.6%(+1.89)#4,431 |
| 61. | Monson Center | 9.4% | 8.7%(+0.703)#61 | 7.6%(+1.77)#4,532 |
| 62. | Hanscom Afb | 9.4% | 8.7%(+0.664)#62 | 7.6%(+1.74)#4,561 |
| 63. | Newton | 9.3% | 8.7%(+0.583)#63 | 7.6%(+1.65)#4,630 |
| 64. | Hudson | 9.3% | 8.7%(+0.538)#64 | 7.6%(+1.61)#4,671 |
| 65. | Brookline | 9.1% | 8.7%(+0.357)#65 | 7.6%(+1.43)#4,834 |
| 66. | Watertown Town | 9.0% | 8.7%(+0.270)#66 | 7.6%(+1.34)#4,925 |
| 67. | Medfield | 8.8% | 8.7%(+0.124)#67 | 7.6%(+1.20)#5,072 |
| 68. | Swampscott | 8.8% | 8.7%(+0.110)#68 | 7.6%(+1.18)#5,084 |
| 69. | Braintree Town | 8.8% | 8.7%(+0.108)#69 | 7.6%(+1.18)#5,085 |
| 70. | Sandwich | 8.7% | 8.7%(+0.013)#70 | 7.6%(+1.09)#5,174 |
| 71. | Millers Falls | 8.7% | 8.7%(-0.024)#71 | 7.6%(+1.05)#5,201 |
| 72. | Leominster | 8.7% | 8.7%(-0.028)#72 | 7.6%(+1.04)#5,227 |
| 73. | Maynard | 8.7% | 8.7%(-0.047)#73 | 7.6%(+1.02)#5,242 |
| 74. | Hull | 8.6% | 8.7%(-0.073)#74 | 7.6%(+1.000)#5,254 |
| 75. | North Attleborough | 8.5% | 8.7%(-0.173)#75 | 7.6%(+0.900)#5,356 |
| 76. | Scituate | 8.5% | 8.7%(-0.184)#76 | 7.6%(+0.888)#5,365 |
| 77. | Wellesley | 8.5% | 8.7%(-0.219)#77 | 7.6%(+0.853)#5,395 |
| 78. | Yarmouth Port | 8.5% | 8.7%(-0.265)#78 | 7.6%(+0.807)#5,443 |
| 79. | Norwood | 8.3% | 8.7%(-0.383)#79 | 7.6%(+0.689)#5,543 |
| 80. | East Falmouth | 8.2% | 8.7%(-0.523)#80 | 7.6%(+0.549)#5,734 |
| 81. | Franklin Town | 8.2% | 8.7%(-0.543)#81 | 7.6%(+0.530)#5,759 |
| 82. | Randolph Town | 8.0% | 8.7%(-0.712)#82 | 7.6%(+0.360)#5,951 |
| 83. | Sagamore | 7.9% | 8.7%(-0.853)#83 | 7.6%(+0.219)#6,129 |
| 84. | Upton | 7.8% | 8.7%(-0.873)#84 | 7.6%(+0.199)#6,148 |
| 85. | Abington | 7.8% | 8.7%(-0.894)#85 | 7.6%(+0.178)#6,184 |
| 86. | Wilbraham | 7.7% | 8.7%(-0.993)#86 | 7.6%(+0.079)#6,292 |
| 87. | Worcester | 7.7% | 8.7%(-1.03)#87 | 7.6%(+0.046)#6,328 |
| 88. | Danvers | 7.7% | 8.7%(-1.05)#88 | 7.6%(+0.019)#6,398 |
| 89. | South Yarmouth | 7.7% | 8.7%(-1.06)#89 | 7.6%(+0.016)#6,402 |
| 90. | Somerset | 7.6% | 8.7%(-1.09)#90 | 7.6%(-0.017)#6,440 |
| 91. | Needham | 7.6% | 8.7%(-1.10)#91 | 7.6%(-0.023)#6,449 |
| 92. | The Pinehills | 7.6% | 8.7%(-1.13)#92 | 7.6%(-0.056)#6,488 |
| 93. | Dennis | 7.5% | 8.7%(-1.22)#93 | 7.6%(-0.150)#6,602 |
| 94. | Boston | 7.5% | 8.7%(-1.24)#94 | 7.6%(-0.171)#6,623 |
| 95. | Everett | 7.4% | 8.7%(-1.29)#95 | 7.6%(-0.213)#6,666 |
| 96. | Amesbury Town | 7.4% | 8.7%(-1.34)#96 | 7.6%(-0.271)#6,755 |
| 97. | Madaket | 7.3% | 8.7%(-1.38)#97 | 7.6%(-0.308)#6,801 |
| 98. | Northborough | 7.3% | 8.7%(-1.40)#98 | 7.6%(-0.327)#6,821 |
| 99. | Rockport | 7.3% | 8.7%(-1.41)#99 | 7.6%(-0.342)#6,851 |
| 100. | Quincy | 7.2% | 8.7%(-1.54)#100 | 7.6%(-0.467)#7,012 |
Common Questions
What are the Top 10 Cities with the Highest Percentage of Population with a Degree in Engineering in Massachusetts?
Top 10 Cities with the Highest Percentage of Population with a Degree in Engineering in Massachusetts are:
#1
40.8%
#2
28.2%
#3
20.5%
#4
19.4%
#5
17.8%
#6
17.4%
#7
16.6%
#8
15.9%
#9
15.8%
#10
15.2%
What city has the Highest Percentage of Population with a Degree in Engineering in Massachusetts?
Popponesset Island has the Highest Percentage of Population with a Degree in Engineering in Massachusetts with 40.8%.
What is the Percentage of Population with a Degree in Engineering in the State of Massachusetts?
Percentage of Population with a Degree in Engineering in Massachusetts is 8.7%.
What is the Percentage of Population with a Degree in Engineering in the United States?
Percentage of Population with a Degree in Engineering in the United States is 7.6%.