Cities with the Highest Percentage of Scandinavian Population in Massachusetts
RELATED REPORTS & OPTIONS
Scandinavian
Massachusetts
Compare Cities
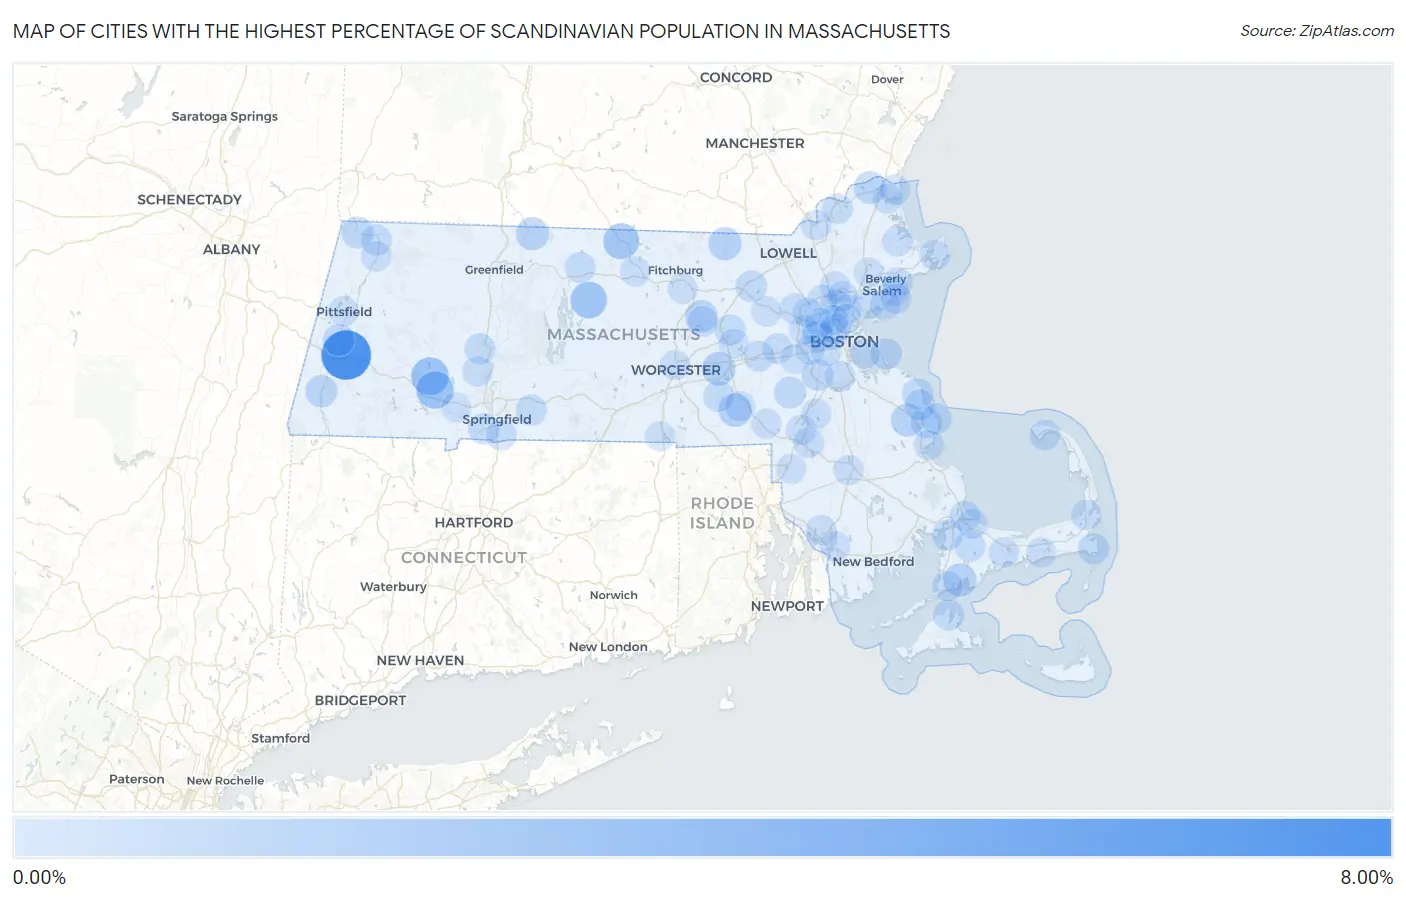
Map of Cities with the Highest Percentage of Scandinavian Population in Massachusetts
0.00%
8.00%
Cities with the Highest Percentage of Scandinavian Population in Massachusetts
| City | Scandinavian | vs State | vs National | |
| 1. | Lee | 7.96% | 0.17%(+7.79)#1 | 0.30%(+7.66)#165 |
| 2. | Huntington | 3.01% | 0.17%(+2.84)#2 | 0.30%(+2.70)#742 |
| 3. | Russell | 2.97% | 0.17%(+2.80)#3 | 0.30%(+2.66)#756 |
| 4. | Petersham | 2.55% | 0.17%(+2.38)#4 | 0.30%(+2.24)#948 |
| 5. | Winchendon | 2.33% | 0.17%(+2.16)#5 | 0.30%(+2.03)#1,055 |
| 6. | Westborough | 1.42% | 0.17%(+1.25)#6 | 0.30%(+1.11)#1,969 |
| 7. | Hopedale | 1.35% | 0.17%(+1.19)#7 | 0.30%(+1.05)#2,063 |
| 8. | East Falmouth | 1.28% | 0.17%(+1.11)#8 | 0.30%(+0.977)#2,210 |
| 9. | Pepperell | 1.22% | 0.17%(+1.06)#9 | 0.30%(+0.920)#2,327 |
| 10. | Northfield | 1.21% | 0.17%(+1.04)#10 | 0.30%(+0.907)#2,356 |
| 11. | North Pembroke | 1.16% | 0.17%(+0.995)#11 | 0.30%(+0.859)#2,451 |
| 12. | South Lancaster | 0.97% | 0.17%(+0.806)#12 | 0.30%(+0.670)#2,922 |
| 13. | Amesbury Town | 0.96% | 0.17%(+0.792)#13 | 0.30%(+0.656)#2,956 |
| 14. | Great Barrington | 0.90% | 0.17%(+0.731)#14 | 0.30%(+0.595)#3,137 |
| 15. | Williamstown | 0.78% | 0.17%(+0.610)#15 | 0.30%(+0.474)#3,602 |
| 16. | Medfield | 0.76% | 0.17%(+0.591)#16 | 0.30%(+0.455)#3,677 |
| 17. | Lenox | 0.75% | 0.17%(+0.582)#17 | 0.30%(+0.446)#3,708 |
| 18. | Dedham | 0.68% | 0.17%(+0.511)#18 | 0.30%(+0.376)#4,017 |
| 19. | Chatham | 0.61% | 0.17%(+0.442)#19 | 0.30%(+0.307)#4,341 |
| 20. | Littleton Common | 0.59% | 0.17%(+0.424)#20 | 0.30%(+0.288)#4,438 |
| 21. | Marshfield | 0.58% | 0.17%(+0.407)#21 | 0.30%(+0.271)#4,539 |
| 22. | Hull | 0.56% | 0.17%(+0.395)#22 | 0.30%(+0.259)#4,603 |
| 23. | Agawam Town | 0.51% | 0.17%(+0.345)#23 | 0.30%(+0.210)#4,895 |
| 24. | Forestdale | 0.51% | 0.17%(+0.343)#24 | 0.30%(+0.207)#4,915 |
| 25. | Vineyard Haven | 0.51% | 0.17%(+0.339)#25 | 0.30%(+0.203)#4,941 |
| 26. | Monument Beach | 0.50% | 0.17%(+0.328)#26 | 0.30%(+0.192)#5,018 |
| 27. | Wilbraham | 0.49% | 0.17%(+0.326)#27 | 0.30%(+0.191)#5,025 |
| 28. | Hudson | 0.49% | 0.17%(+0.322)#28 | 0.30%(+0.186)#5,057 |
| 29. | Scituate | 0.48% | 0.17%(+0.309)#29 | 0.30%(+0.173)#5,149 |
| 30. | North Adams | 0.47% | 0.17%(+0.303)#30 | 0.30%(+0.167)#5,198 |
| 31. | Upton | 0.46% | 0.17%(+0.294)#31 | 0.30%(+0.158)#5,268 |
| 32. | Hanscom Afb | 0.45% | 0.17%(+0.280)#32 | 0.30%(+0.144)#5,378 |
| 33. | Belmont | 0.45% | 0.17%(+0.280)#33 | 0.30%(+0.144)#5,384 |
| 34. | Watertown Town | 0.43% | 0.17%(+0.261)#34 | 0.30%(+0.125)#5,548 |
| 35. | Marshfield Hills | 0.41% | 0.17%(+0.238)#35 | 0.30%(+0.103)#5,752 |
| 36. | Athol | 0.40% | 0.17%(+0.236)#36 | 0.30%(+0.100)#5,777 |
| 37. | Sagamore | 0.40% | 0.17%(+0.235)#37 | 0.30%(+0.099)#5,785 |
| 38. | Northampton | 0.39% | 0.17%(+0.225)#38 | 0.30%(+0.089)#5,863 |
| 39. | Ocean Bluff Brant Rock | 0.39% | 0.17%(+0.220)#39 | 0.30%(+0.084)#5,911 |
| 40. | Salisbury | 0.36% | 0.17%(+0.192)#40 | 0.30%(+0.056)#6,196 |
| 41. | Stoneham | 0.36% | 0.17%(+0.188)#41 | 0.30%(+0.052)#6,232 |
| 42. | Provincetown | 0.35% | 0.17%(+0.181)#42 | 0.30%(+0.045)#6,305 |
| 43. | Clinton | 0.34% | 0.17%(+0.171)#43 | 0.30%(+0.035)#6,409 |
| 44. | Greenfield | 0.33% | 0.17%(+0.165)#44 | 0.30%(+0.030)#6,465 |
| 45. | Haverhill | 0.32% | 0.17%(+0.150)#45 | 0.30%(+0.014)#6,626 |
| 46. | Framingham | 0.31% | 0.17%(+0.139)#46 | 0.30%(+0.003)#6,725 |
| 47. | Milton | 0.31% | 0.17%(+0.137)#47 | 0.30%(+0.001)#6,751 |
| 48. | Gloucester | 0.30% | 0.17%(+0.133)#48 | 0.30%(-0.003)#6,804 |
| 49. | Mansfield Center | 0.29% | 0.17%(+0.118)#49 | 0.30%(-0.018)#6,996 |
| 50. | Amherst | 0.28% | 0.17%(+0.107)#50 | 0.30%(-0.029)#7,120 |
| 51. | Cochituate | 0.27% | 0.17%(+0.105)#51 | 0.30%(-0.030)#7,143 |
| 52. | Longmeadow | 0.27% | 0.17%(+0.104)#52 | 0.30%(-0.032)#7,162 |
| 53. | Falmouth | 0.26% | 0.17%(+0.089)#53 | 0.30%(-0.047)#7,376 |
| 54. | Foxborough | 0.25% | 0.17%(+0.085)#54 | 0.30%(-0.051)#7,451 |
| 55. | Milford | 0.25% | 0.17%(+0.078)#55 | 0.30%(-0.058)#7,545 |
| 56. | Reading | 0.24% | 0.17%(+0.076)#56 | 0.30%(-0.060)#7,594 |
| 57. | Orleans | 0.24% | 0.17%(+0.072)#57 | 0.30%(-0.064)#7,653 |
| 58. | Salem | 0.23% | 0.17%(+0.063)#58 | 0.30%(-0.073)#7,781 |
| 59. | Adams | 0.23% | 0.17%(+0.059)#59 | 0.30%(-0.077)#7,844 |
| 60. | Methuen Town | 0.22% | 0.17%(+0.055)#60 | 0.30%(-0.081)#7,895 |
| 61. | Cambridge | 0.22% | 0.17%(+0.055)#61 | 0.30%(-0.081)#7,904 |
| 62. | Melrose | 0.22% | 0.17%(+0.049)#62 | 0.30%(-0.087)#7,992 |
| 63. | Easthampton Town | 0.22% | 0.17%(+0.048)#63 | 0.30%(-0.087)#7,999 |
| 64. | Beverly | 0.21% | 0.17%(+0.041)#64 | 0.30%(-0.094)#8,102 |
| 65. | Ipswich | 0.21% | 0.17%(+0.037)#65 | 0.30%(-0.099)#8,170 |
| 66. | Sandwich | 0.20% | 0.17%(+0.035)#66 | 0.30%(-0.101)#8,196 |
| 67. | Woburn | 0.20% | 0.17%(+0.034)#67 | 0.30%(-0.102)#8,210 |
| 68. | West Concord | 0.20% | 0.17%(+0.033)#68 | 0.30%(-0.103)#8,223 |
| 69. | Lynn | 0.20% | 0.17%(+0.030)#69 | 0.30%(-0.106)#8,250 |
| 70. | Somerset | 0.20% | 0.17%(+0.029)#70 | 0.30%(-0.107)#8,273 |
| 71. | Gardner | 0.19% | 0.17%(+0.021)#71 | 0.30%(-0.115)#8,389 |
| 72. | Swampscott | 0.18% | 0.17%(+0.010)#72 | 0.30%(-0.126)#8,536 |
| 73. | Barnstable Town | 0.18% | 0.17%(+0.009)#73 | 0.30%(-0.126)#8,556 |
| 74. | South Duxbury | 0.18% | 0.17%(+0.008)#74 | 0.30%(-0.128)#8,577 |
| 75. | Marblehead | 0.17% | 0.17%(+0.004)#75 | 0.30%(-0.132)#8,639 |
| 76. | Brookline | 0.17% | 0.17%(+0.002)#76 | 0.30%(-0.134)#8,664 |
| 77. | Boston | 0.17% | 0.17%(-0.001)#77 | 0.30%(-0.136)#8,705 |
| 78. | Sharon | 0.17% | 0.17%(-0.001)#78 | 0.30%(-0.137)#8,710 |
| 79. | Raynham Center | 0.16% | 0.17%(-0.011)#79 | 0.30%(-0.147)#8,854 |
| 80. | Somerville | 0.16% | 0.17%(-0.013)#80 | 0.30%(-0.149)#8,903 |
| 81. | Fall River | 0.15% | 0.17%(-0.021)#81 | 0.30%(-0.157)#9,038 |
| 82. | Wakefield | 0.14% | 0.17%(-0.024)#82 | 0.30%(-0.160)#9,079 |
| 83. | Franklin Town | 0.14% | 0.17%(-0.025)#83 | 0.30%(-0.161)#9,092 |
| 84. | Pittsfield | 0.14% | 0.17%(-0.029)#84 | 0.30%(-0.165)#9,148 |
| 85. | Worcester | 0.13% | 0.17%(-0.037)#85 | 0.30%(-0.173)#9,238 |
| 86. | Newburyport | 0.13% | 0.17%(-0.043)#86 | 0.30%(-0.179)#9,341 |
| 87. | Marlborough | 0.12% | 0.17%(-0.045)#87 | 0.30%(-0.181)#9,371 |
| 88. | Danvers | 0.11% | 0.17%(-0.054)#88 | 0.30%(-0.190)#9,481 |
| 89. | Medford | 0.10% | 0.17%(-0.065)#89 | 0.30%(-0.201)#9,645 |
| 90. | Waltham | 0.096% | 0.17%(-0.073)#90 | 0.30%(-0.208)#9,754 |
| 91. | Lexington | 0.094% | 0.17%(-0.075)#91 | 0.30%(-0.211)#9,789 |
| 92. | Leominster | 0.089% | 0.17%(-0.079)#92 | 0.30%(-0.215)#9,832 |
| 93. | Wellesley | 0.084% | 0.17%(-0.085)#93 | 0.30%(-0.221)#9,906 |
| 94. | Attleboro | 0.078% | 0.17%(-0.091)#94 | 0.30%(-0.227)#9,976 |
| 95. | South Yarmouth | 0.076% | 0.17%(-0.092)#95 | 0.30%(-0.228)#9,997 |
| 96. | Arlington | 0.070% | 0.17%(-0.099)#96 | 0.30%(-0.235)#10,086 |
| 97. | Newton | 0.069% | 0.17%(-0.099)#97 | 0.30%(-0.235)#10,097 |
| 98. | Westfield | 0.069% | 0.17%(-0.100)#98 | 0.30%(-0.236)#10,101 |
| 99. | Webster | 0.065% | 0.17%(-0.103)#99 | 0.30%(-0.239)#10,146 |
| 100. | Malden | 0.058% | 0.17%(-0.110)#100 | 0.30%(-0.246)#10,222 |
Common Questions
What are the Top 10 Cities with the Highest Percentage of Scandinavian Population in Massachusetts?
Top 10 Cities with the Highest Percentage of Scandinavian Population in Massachusetts are:
#1
7.96%
#2
3.01%
#3
2.97%
#4
2.55%
#5
2.33%
#6
1.42%
#7
1.35%
#8
1.28%
#9
1.22%
#10
1.21%
What city has the Highest Percentage of Scandinavian Population in Massachusetts?
Lee has the Highest Percentage of Scandinavian Population in Massachusetts with 7.96%.
What is the Percentage of Scandinavian Population in the State of Massachusetts?
Percentage of Scandinavian Population in Massachusetts is 0.17%.
What is the Percentage of Scandinavian Population in the United States?
Percentage of Scandinavian Population in the United States is 0.30%.