Cities with the Highest Percentage of Population Employed in Cleaning & Maintenance in Massachusetts
RELATED REPORTS & OPTIONS
Cleaning & Maintenance
Massachusetts
Compare Cities
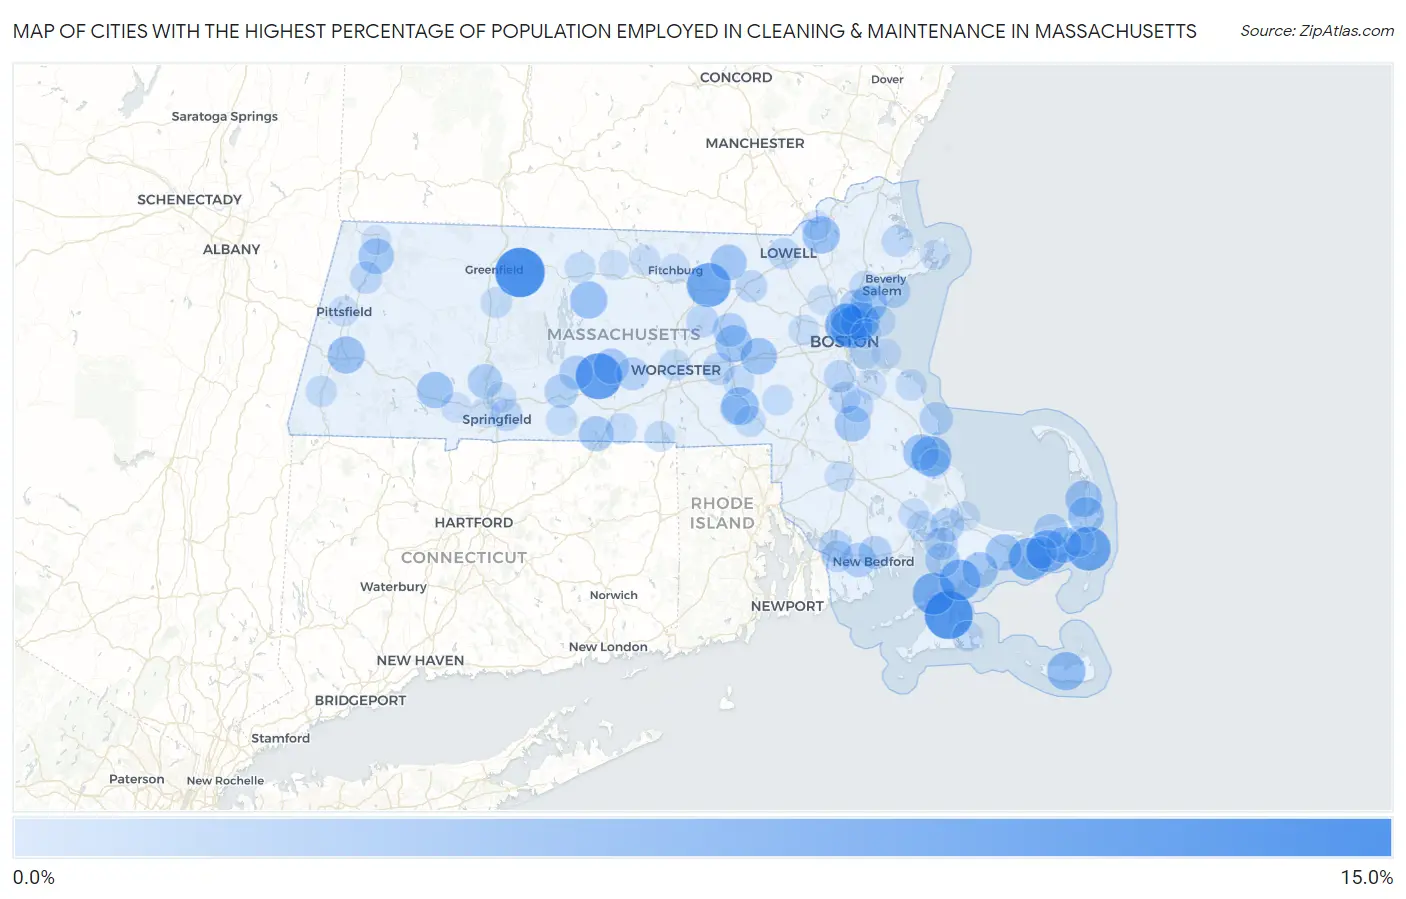
Map of Cities with the Highest Percentage of Population Employed in Cleaning & Maintenance in Massachusetts
0.0%
15.0%
Cities with the Highest Percentage of Population Employed in Cleaning & Maintenance in Massachusetts
| City | % Employed | vs State | vs National | |
| 1. | Millers Falls | 14.0% | 3.1%(+10.9)#1 | 3.5%(+10.5)#1,295 |
| 2. | Vineyard Haven | 13.1% | 3.1%(+10.0)#2 | 3.5%(+9.65)#1,500 |
| 3. | West Brookfield | 12.0% | 3.1%(+8.91)#3 | 3.5%(+8.51)#1,863 |
| 4. | Oak Bluffs | 11.0% | 3.1%(+7.89)#4 | 3.5%(+7.50)#2,211 |
| 5. | West Chatham | 10.7% | 3.1%(+7.61)#5 | 3.5%(+7.21)#2,330 |
| 6. | Shirley | 10.6% | 3.1%(+7.57)#6 | 3.5%(+7.17)#2,341 |
| 7. | West Yarmouth | 9.7% | 3.1%(+6.59)#7 | 3.5%(+6.19)#2,804 |
| 8. | Woods Hole | 9.6% | 3.1%(+6.56)#8 | 3.5%(+6.16)#2,817 |
| 9. | Everett | 9.6% | 3.1%(+6.50)#9 | 3.5%(+6.10)#2,850 |
| 10. | West Dennis | 9.6% | 3.1%(+6.47)#10 | 3.5%(+6.07)#2,866 |
| 11. | Chelsea | 9.4% | 3.1%(+6.29)#11 | 3.5%(+5.89)#2,960 |
| 12. | East Falmouth | 9.0% | 3.1%(+5.87)#12 | 3.5%(+5.47)#3,203 |
| 13. | North Plymouth | 8.6% | 3.1%(+5.56)#13 | 3.5%(+5.16)#3,445 |
| 14. | Revere | 7.9% | 3.1%(+4.82)#14 | 3.5%(+4.42)#4,053 |
| 15. | Nantucket | 7.5% | 3.1%(+4.41)#15 | 3.5%(+4.01)#4,422 |
| 16. | Milford | 7.3% | 3.1%(+4.17)#16 | 3.5%(+3.77)#4,676 |
| 17. | Lawrence | 6.9% | 3.1%(+3.86)#17 | 3.5%(+3.46)#4,993 |
| 18. | Petersham | 6.9% | 3.1%(+3.81)#18 | 3.5%(+3.41)#5,049 |
| 19. | Lee | 6.8% | 3.1%(+3.73)#19 | 3.5%(+3.33)#5,184 |
| 20. | Marlborough | 6.7% | 3.1%(+3.59)#20 | 3.5%(+3.19)#5,345 |
| 21. | Framingham | 6.5% | 3.1%(+3.45)#21 | 3.5%(+3.05)#5,539 |
| 22. | North Eastham | 6.5% | 3.1%(+3.42)#22 | 3.5%(+3.02)#5,591 |
| 23. | Kingston | 6.4% | 3.1%(+3.35)#23 | 3.5%(+2.95)#5,687 |
| 24. | Russell | 6.4% | 3.1%(+3.28)#24 | 3.5%(+2.88)#5,789 |
| 25. | Lynn | 6.4% | 3.1%(+3.27)#25 | 3.5%(+2.87)#5,795 |
| 26. | Barnstable Town | 6.3% | 3.1%(+3.26)#26 | 3.5%(+2.86)#5,816 |
| 27. | Orleans | 6.3% | 3.1%(+3.18)#27 | 3.5%(+2.78)#5,945 |
| 28. | Groton | 6.2% | 3.1%(+3.10)#28 | 3.5%(+2.70)#6,086 |
| 29. | Northwest Harwich | 6.2% | 3.1%(+3.07)#29 | 3.5%(+2.67)#6,132 |
| 30. | Mashpee Neck | 6.0% | 3.1%(+2.94)#30 | 3.5%(+2.54)#6,330 |
| 31. | Adams | 6.0% | 3.1%(+2.93)#31 | 3.5%(+2.53)#6,356 |
| 32. | Brockton | 6.0% | 3.1%(+2.88)#32 | 3.5%(+2.48)#6,443 |
| 33. | North Brookfield | 6.0% | 3.1%(+2.87)#33 | 3.5%(+2.47)#6,464 |
| 34. | Holland | 5.7% | 3.1%(+2.57)#34 | 3.5%(+2.17)#6,943 |
| 35. | East Dennis | 5.4% | 3.1%(+2.29)#35 | 3.5%(+1.89)#7,446 |
| 36. | North Falmouth | 5.4% | 3.1%(+2.28)#36 | 3.5%(+1.88)#7,455 |
| 37. | Smith Mills | 5.3% | 3.1%(+2.18)#37 | 3.5%(+1.78)#7,627 |
| 38. | Holyoke | 5.3% | 3.1%(+2.17)#38 | 3.5%(+1.77)#7,694 |
| 39. | Hudson | 5.1% | 3.1%(+1.97)#39 | 3.5%(+1.57)#8,149 |
| 40. | Ware | 5.0% | 3.1%(+1.96)#40 | 3.5%(+1.56)#8,181 |
| 41. | Palmer Town | 5.0% | 3.1%(+1.90)#41 | 3.5%(+1.50)#8,294 |
| 42. | Saugus | 4.8% | 3.1%(+1.74)#42 | 3.5%(+1.34)#8,656 |
| 43. | Ocean Bluff Brant Rock | 4.8% | 3.1%(+1.71)#43 | 3.5%(+1.31)#8,739 |
| 44. | Buzzards Bay | 4.8% | 3.1%(+1.70)#44 | 3.5%(+1.30)#8,760 |
| 45. | Salem | 4.8% | 3.1%(+1.68)#45 | 3.5%(+1.28)#8,805 |
| 46. | Greenfield | 4.8% | 3.1%(+1.67)#46 | 3.5%(+1.27)#8,848 |
| 47. | New Bedford | 4.7% | 3.1%(+1.60)#47 | 3.5%(+1.20)#9,000 |
| 48. | Spencer | 4.6% | 3.1%(+1.53)#48 | 3.5%(+1.13)#9,181 |
| 49. | Fall River | 4.4% | 3.1%(+1.35)#49 | 3.5%(+0.951)#9,689 |
| 50. | Pocasset | 4.4% | 3.1%(+1.34)#50 | 3.5%(+0.937)#9,732 |
| 51. | Clinton | 4.3% | 3.1%(+1.21)#51 | 3.5%(+0.806)#10,117 |
| 52. | Cheshire | 4.2% | 3.1%(+1.15)#52 | 3.5%(+0.755)#10,260 |
| 53. | Westborough | 4.2% | 3.1%(+1.14)#53 | 3.5%(+0.744)#10,291 |
| 54. | Milton | 4.2% | 3.1%(+1.13)#54 | 3.5%(+0.733)#10,328 |
| 55. | Springfield | 4.1% | 3.1%(+1.06)#55 | 3.5%(+0.665)#10,539 |
| 56. | Malden | 4.1% | 3.1%(+1.05)#56 | 3.5%(+0.653)#10,573 |
| 57. | Holbrook | 4.1% | 3.1%(+1.01)#57 | 3.5%(+0.614)#10,703 |
| 58. | South Yarmouth | 4.0% | 3.1%(+0.891)#58 | 3.5%(+0.491)#11,077 |
| 59. | Littleton Common | 4.0% | 3.1%(+0.890)#59 | 3.5%(+0.491)#11,078 |
| 60. | Randolph Town | 3.9% | 3.1%(+0.851)#60 | 3.5%(+0.451)#11,206 |
| 61. | North Westport | 3.9% | 3.1%(+0.847)#61 | 3.5%(+0.447)#11,219 |
| 62. | Ipswich | 3.9% | 3.1%(+0.781)#62 | 3.5%(+0.381)#11,399 |
| 63. | Lowell | 3.9% | 3.1%(+0.771)#63 | 3.5%(+0.372)#11,423 |
| 64. | Hopkinton | 3.7% | 3.1%(+0.623)#64 | 3.5%(+0.223)#11,885 |
| 65. | East Harwich | 3.7% | 3.1%(+0.612)#65 | 3.5%(+0.213)#11,938 |
| 66. | Boston | 3.7% | 3.1%(+0.601)#66 | 3.5%(+0.202)#11,974 |
| 67. | Wareham Center | 3.7% | 3.1%(+0.592)#67 | 3.5%(+0.193)#12,007 |
| 68. | Bellingham | 3.7% | 3.1%(+0.581)#68 | 3.5%(+0.181)#12,043 |
| 69. | Great Barrington | 3.6% | 3.1%(+0.567)#69 | 3.5%(+0.167)#12,081 |
| 70. | North Scituate | 3.6% | 3.1%(+0.566)#70 | 3.5%(+0.167)#12,084 |
| 71. | Peabody | 3.6% | 3.1%(+0.534)#71 | 3.5%(+0.134)#12,198 |
| 72. | Worcester | 3.6% | 3.1%(+0.522)#72 | 3.5%(+0.122)#12,241 |
| 73. | Southbridge Town | 3.6% | 3.1%(+0.517)#73 | 3.5%(+0.117)#12,264 |
| 74. | South Deerfield | 3.6% | 3.1%(+0.479)#74 | 3.5%(+0.080)#12,403 |
| 75. | Millis Clicquot | 3.4% | 3.1%(+0.363)#75 | 3.5%(-0.037)#12,819 |
| 76. | Monson Center | 3.4% | 3.1%(+0.337)#76 | 3.5%(-0.063)#12,911 |
| 77. | Athol | 3.4% | 3.1%(+0.322)#77 | 3.5%(-0.077)#12,966 |
| 78. | Nahant | 3.4% | 3.1%(+0.309)#78 | 3.5%(-0.091)#13,017 |
| 79. | Webster | 3.4% | 3.1%(+0.296)#79 | 3.5%(-0.104)#13,067 |
| 80. | West Wareham | 3.4% | 3.1%(+0.287)#80 | 3.5%(-0.113)#13,107 |
| 81. | Edgartown | 3.4% | 3.1%(+0.278)#81 | 3.5%(-0.121)#13,131 |
| 82. | Waltham | 3.3% | 3.1%(+0.254)#82 | 3.5%(-0.146)#13,221 |
| 83. | South Ashburnham | 3.3% | 3.1%(+0.176)#83 | 3.5%(-0.224)#13,527 |
| 84. | Chicopee | 3.2% | 3.1%(+0.147)#84 | 3.5%(-0.253)#13,610 |
| 85. | Taunton | 3.2% | 3.1%(+0.134)#85 | 3.5%(-0.265)#13,681 |
| 86. | Fitchburg | 3.1% | 3.1%(+0.050)#86 | 3.5%(-0.349)#13,978 |
| 87. | Pittsfield | 3.1% | 3.1%(+0.044)#87 | 3.5%(-0.356)#13,996 |
| 88. | Westfield | 3.1% | 3.1%(+0.042)#88 | 3.5%(-0.357)#13,999 |
| 89. | Methuen Town | 3.1% | 3.1%(+0.031)#89 | 3.5%(-0.368)#14,053 |
| 90. | Winthrop Town | 3.1% | 3.1%(+0.017)#90 | 3.5%(-0.383)#14,105 |
| 91. | Weymouth Town | 3.1% | 3.1%(-0.023)#91 | 3.5%(-0.423)#14,251 |
| 92. | Gloucester | 3.0% | 3.1%(-0.057)#92 | 3.5%(-0.457)#14,390 |
| 93. | Plymouth | 3.0% | 3.1%(-0.085)#93 | 3.5%(-0.485)#14,505 |
| 94. | Woburn | 3.0% | 3.1%(-0.092)#94 | 3.5%(-0.492)#14,525 |
| 95. | West Springfield Town | 3.0% | 3.1%(-0.096)#95 | 3.5%(-0.495)#14,535 |
| 96. | Baldwinville | 3.0% | 3.1%(-0.113)#96 | 3.5%(-0.512)#14,596 |
| 97. | Hull | 3.0% | 3.1%(-0.126)#97 | 3.5%(-0.525)#14,645 |
| 98. | Hopedale | 3.0% | 3.1%(-0.126)#98 | 3.5%(-0.525)#14,647 |
| 99. | Sagamore | 2.9% | 3.1%(-0.134)#99 | 3.5%(-0.533)#14,676 |
| 100. | North Adams | 2.9% | 3.1%(-0.171)#100 | 3.5%(-0.571)#14,808 |
Common Questions
What are the Top 10 Cities with the Highest Percentage of Population Employed in Cleaning & Maintenance in Massachusetts?
Top 10 Cities with the Highest Percentage of Population Employed in Cleaning & Maintenance in Massachusetts are:
#1
14.0%
#2
13.1%
#3
12.0%
#4
10.7%
#5
10.6%
#6
9.7%
#7
9.6%
#8
9.6%
#9
9.6%
#10
9.4%
What city has the Highest Percentage of Population Employed in Cleaning & Maintenance in Massachusetts?
Millers Falls has the Highest Percentage of Population Employed in Cleaning & Maintenance in Massachusetts with 14.0%.
What is the Percentage of Population Employed in Cleaning & Maintenance in the State of Massachusetts?
Percentage of Population Employed in Cleaning & Maintenance in Massachusetts is 3.1%.
What is the Percentage of Population Employed in Cleaning & Maintenance in the United States?
Percentage of Population Employed in Cleaning & Maintenance in the United States is 3.5%.