Cities with the Most Immigrants from Malaysia in Massachusetts
RELATED REPORTS & OPTIONS
Malaysia
Massachusetts
Compare Cities
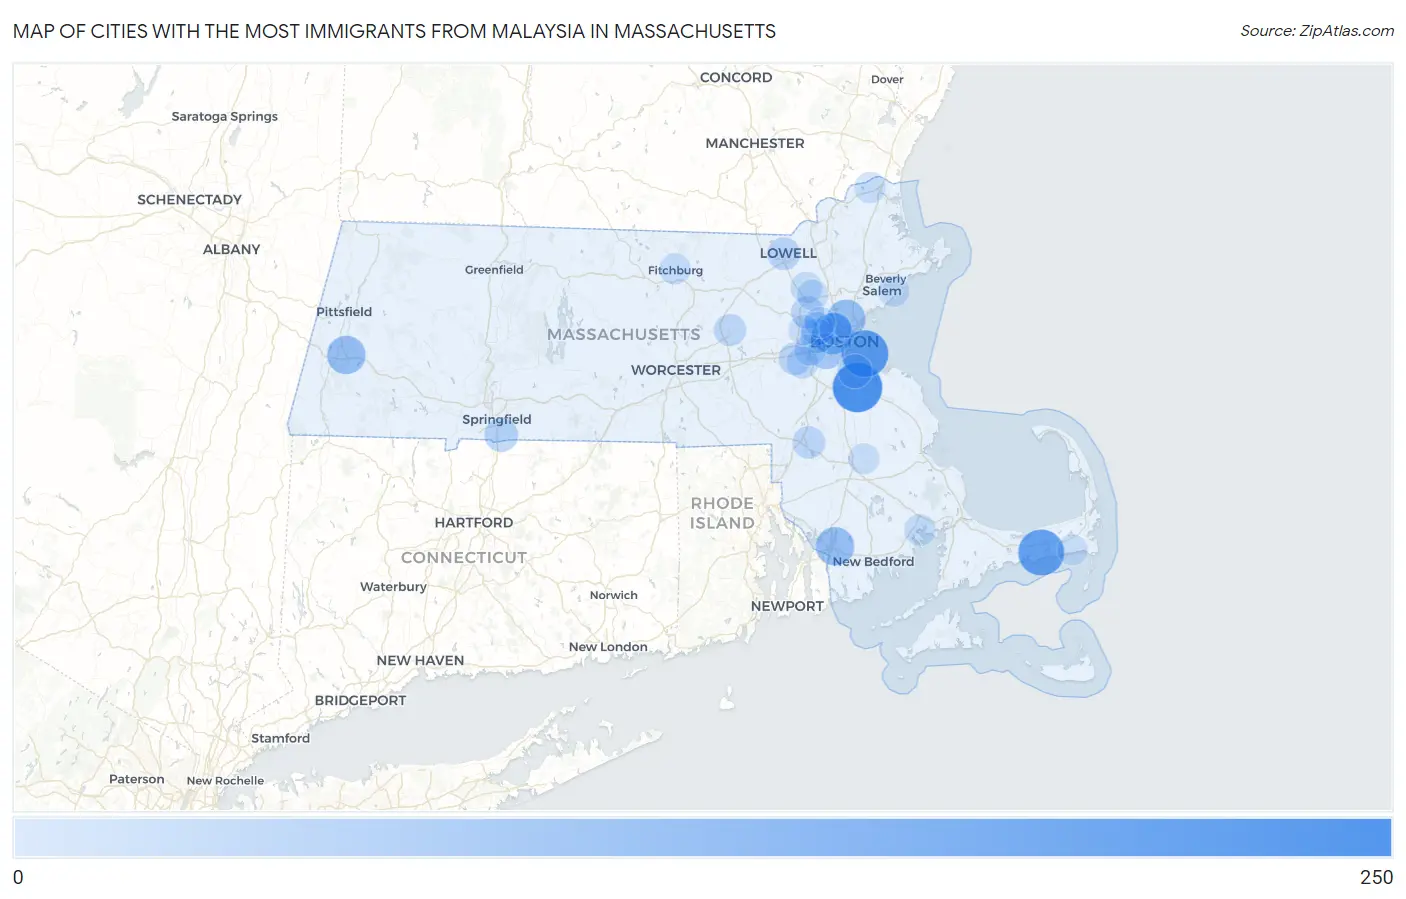
Map of Cities with the Most Immigrants from Malaysia in Massachusetts
0
250
Cities with the Most Immigrants from Malaysia in Massachusetts
| City | Malaysia | vs State | vs National | |
| 1. | Braintree Town | 241 | 1,959(12.30%)#1 | 82,574(0.29%)#40 |
| 2. | Boston | 207 | 1,959(10.57%)#2 | 82,574(0.25%)#52 |
| 3. | South Yarmouth | 196 | 1,959(10.01%)#3 | 82,574(0.24%)#57 |
| 4. | Cambridge | 132 | 1,959(6.74%)#4 | 82,574(0.16%)#99 |
| 5. | Fall River | 102 | 1,959(5.21%)#5 | 82,574(0.12%)#130 |
| 6. | Lee | 101 | 1,959(5.16%)#6 | 82,574(0.12%)#135 |
| 7. | Malden | 100 | 1,959(5.10%)#7 | 82,574(0.12%)#136 |
| 8. | Brookline | 67 | 1,959(3.42%)#8 | 82,574(0.08%)#208 |
| 9. | Quincy | 48 | 1,959(2.45%)#9 | 82,574(0.06%)#304 |
| 10. | Watertown Town | 45 | 1,959(2.30%)#10 | 82,574(0.05%)#322 |
| 11. | Longmeadow | 43 | 1,959(2.19%)#11 | 82,574(0.05%)#334 |
| 12. | Belmont | 36 | 1,959(1.84%)#12 | 82,574(0.04%)#394 |
| 13. | Lexington | 34 | 1,959(1.74%)#13 | 82,574(0.04%)#415 |
| 14. | Somerville | 33 | 1,959(1.68%)#14 | 82,574(0.04%)#426 |
| 15. | Lowell | 32 | 1,959(1.63%)#15 | 82,574(0.04%)#435 |
| 16. | Wellesley | 31 | 1,959(1.58%)#16 | 82,574(0.04%)#458 |
| 17. | Mansfield Center | 30 | 1,959(1.53%)#17 | 82,574(0.04%)#465 |
| 18. | Hudson | 25 | 1,959(1.28%)#18 | 82,574(0.03%)#521 |
| 19. | Needham | 21 | 1,959(1.07%)#19 | 82,574(0.03%)#583 |
| 20. | Amherst | 18 | 1,959(0.92%)#20 | 82,574(0.02%)#640 |
| 21. | Newton | 16 | 1,959(0.82%)#21 | 82,574(0.02%)#687 |
| 22. | Weweantic | 16 | 1,959(0.82%)#22 | 82,574(0.02%)#714 |
| 23. | Pinehurst | 15 | 1,959(0.77%)#23 | 82,574(0.02%)#748 |
| 24. | Burlington | 13 | 1,959(0.66%)#24 | 82,574(0.02%)#810 |
| 25. | Salem | 12 | 1,959(0.61%)#25 | 82,574(0.01%)#842 |
| 26. | Fitchburg | 12 | 1,959(0.61%)#26 | 82,574(0.01%)#843 |
| 27. | Greenfield | 12 | 1,959(0.61%)#27 | 82,574(0.01%)#859 |
| 28. | Amesbury Town | 12 | 1,959(0.61%)#28 | 82,574(0.01%)#860 |
| 29. | Arlington | 11 | 1,959(0.56%)#29 | 82,574(0.01%)#892 |
| 30. | Bridgewater Town | 10 | 1,959(0.51%)#30 | 82,574(0.01%)#941 |
| 31. | Waltham | 6 | 1,959(0.31%)#31 | 82,574(0.01%)#1,100 |
| 32. | Harwich Port | 5 | 1,959(0.26%)#32 | 82,574(0.01%)#1,183 |
Common Questions
What are the Top 10 Cities with the Most Immigrants from Malaysia in Massachusetts?
Top 10 Cities with the Most Immigrants from Malaysia in Massachusetts are:
#1
241
#2
207
#3
196
#4
132
#5
102
#6
101
#7
100
#8
67
#9
48
#10
45
What city has the Most Immigrants from Malaysia in Massachusetts?
Braintree Town has the Most Immigrants from Malaysia in Massachusetts with 241.
What is the Total Immigrants from Malaysia in the State of Massachusetts?
Total Immigrants from Malaysia in Massachusetts is 1,959.
What is the Total Immigrants from Malaysia in the United States?
Total Immigrants from Malaysia in the United States is 82,574.