Cities with the Highest Percentage of Immigrants from Peru in Massachusetts
RELATED REPORTS & OPTIONS
Peru
Massachusetts
Compare Cities
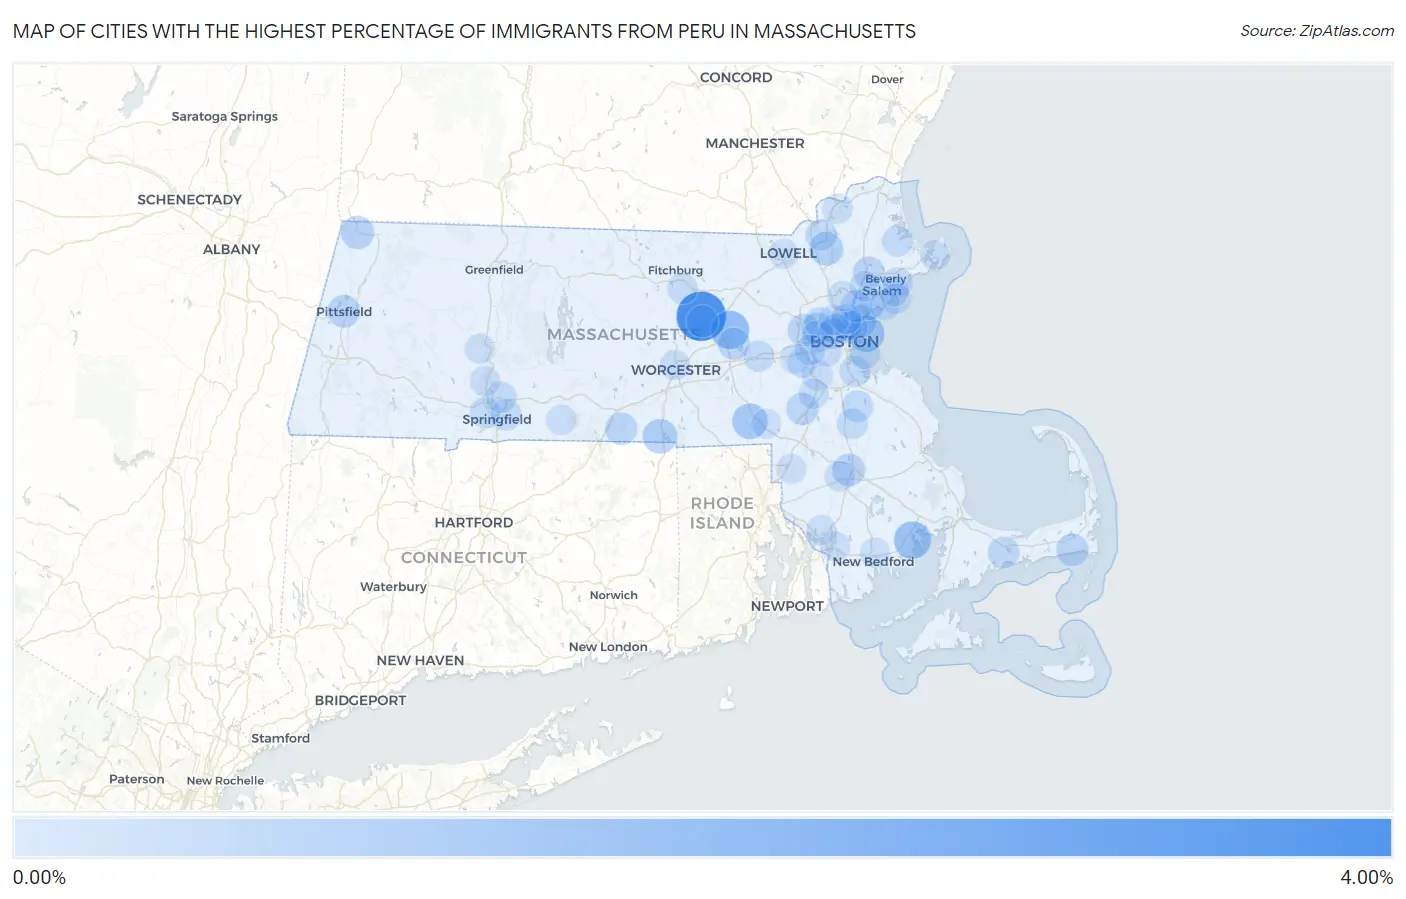
Map of Cities with the Highest Percentage of Immigrants from Peru in Massachusetts
0.00%
4.00%
Cities with the Highest Percentage of Immigrants from Peru in Massachusetts
| City | Peru | vs State | vs National | |
| 1. | South Lancaster | 3.65% | 0.11%(+3.55)#-1 | 0.14%(+3.51)#0 |
| 2. | Hudson | 1.52% | 0.11%(+1.41)#0 | 0.14%(+1.38)#1 |
| 3. | Marion Center | 1.33% | 0.11%(+1.22)#1 | 0.14%(+1.19)#2 |
| 4. | Winthrop Town | 1.13% | 0.11%(+1.03)#2 | 0.14%(+0.996)#3 |
| 5. | Bellingham | 0.99% | 0.11%(+0.887)#3 | 0.14%(+0.853)#4 |
| 6. | Webster | 0.81% | 0.11%(+0.702)#4 | 0.14%(+0.668)#5 |
| 7. | Andover | 0.69% | 0.11%(+0.585)#5 | 0.14%(+0.551)#6 |
| 8. | Williamstown | 0.56% | 0.11%(+0.451)#6 | 0.14%(+0.416)#7 |
| 9. | Raynham Center | 0.49% | 0.11%(+0.387)#7 | 0.14%(+0.353)#8 |
| 10. | Revere | 0.48% | 0.11%(+0.378)#8 | 0.14%(+0.344)#9 |
| 11. | Pittsfield | 0.47% | 0.11%(+0.361)#9 | 0.14%(+0.327)#10 |
| 12. | Lynn | 0.46% | 0.11%(+0.353)#10 | 0.14%(+0.319)#717 |
| 13. | Harwich Port | 0.44% | 0.11%(+0.339)#11 | 0.14%(+0.305)#718 |
| 14. | Waltham | 0.44% | 0.11%(+0.337)#12 | 0.14%(+0.303)#719 |
| 15. | Walpole | 0.42% | 0.11%(+0.318)#13 | 0.14%(+0.284)#720 |
| 16. | Southbridge Town | 0.42% | 0.11%(+0.314)#14 | 0.14%(+0.279)#721 |
| 17. | Chelsea | 0.39% | 0.11%(+0.288)#15 | 0.14%(+0.254)#784 |
| 18. | Everett | 0.38% | 0.11%(+0.277)#16 | 0.14%(+0.243)#1,324 |
| 19. | Belmont | 0.38% | 0.11%(+0.276)#17 | 0.14%(+0.242)#1,325 |
| 20. | Clinton | 0.35% | 0.11%(+0.248)#18 | 0.14%(+0.214)#1,326 |
| 21. | Danvers | 0.35% | 0.11%(+0.242)#19 | 0.14%(+0.208)#1,327 |
| 22. | Marlborough | 0.34% | 0.11%(+0.233)#20 | 0.14%(+0.199)#1,328 |
| 23. | Barnstable Town | 0.33% | 0.11%(+0.226)#21 | 0.14%(+0.192)#1,329 |
| 24. | Saugus | 0.32% | 0.11%(+0.210)#22 | 0.14%(+0.176)#1,330 |
| 25. | Holbrook | 0.26% | 0.11%(+0.159)#23 | 0.14%(+0.125)#1,331 |
| 26. | Lawrence | 0.25% | 0.11%(+0.149)#24 | 0.14%(+0.115)#1,332 |
| 27. | Quincy | 0.24% | 0.11%(+0.136)#25 | 0.14%(+0.102)#1,333 |
| 28. | Watertown Town | 0.20% | 0.11%(+0.099)#26 | 0.14%(+0.065)#1,334 |
| 29. | Springfield | 0.20% | 0.11%(+0.091)#27 | 0.14%(+0.056)#1,338 |
| 30. | Arlington | 0.18% | 0.11%(+0.071)#28 | 0.14%(+0.037)#1,339 |
| 31. | West Springfield Town | 0.17% | 0.11%(+0.069)#29 | 0.14%(+0.035)#1,340 |
| 32. | Chicopee | 0.17% | 0.11%(+0.068)#30 | 0.14%(+0.034)#1,341 |
| 33. | Framingham | 0.17% | 0.11%(+0.066)#31 | 0.14%(+0.032)#1,342 |
| 34. | Ipswich | 0.16% | 0.11%(+0.059)#32 | 0.14%(+0.025)#1,343 |
| 35. | Brockton | 0.16% | 0.11%(+0.056)#33 | 0.14%(+0.022)#1,540 |
| 36. | Boston | 0.16% | 0.11%(+0.051)#34 | 0.14%(+0.017)#1,541 |
| 37. | Dedham | 0.15% | 0.11%(+0.042)#35 | 0.14%(+0.008)#1,542 |
| 38. | Brookline | 0.15% | 0.11%(+0.042)#36 | 0.14%(+0.007)#1,543 |
| 39. | Cambridge | 0.15% | 0.11%(+0.041)#37 | 0.14%(+0.007)#1,544 |
| 40. | Leominster | 0.12% | 0.11%(+0.019)#38 | 0.14%(-0.016)#1,545 |
| 41. | Beverly | 0.11% | 0.11%(+0.006)#39 | 0.14%(-0.029)#1,546 |
| 42. | Needham | 0.097% | 0.11%(-0.008)#40 | 0.14%(-0.042)#1,547 |
| 43. | Peabody | 0.092% | 0.11%(-0.013)#41 | 0.14%(-0.047)#1,548 |
| 44. | Worcester | 0.090% | 0.11%(-0.016)#42 | 0.14%(-0.050)#1,549 |
| 45. | Medford | 0.089% | 0.11%(-0.016)#43 | 0.14%(-0.050)#1,550 |
| 46. | Taunton | 0.084% | 0.11%(-0.021)#44 | 0.14%(-0.055)#1,551 |
| 47. | Haverhill | 0.082% | 0.11%(-0.023)#45 | 0.14%(-0.058)#1,552 |
| 48. | Somerville | 0.080% | 0.11%(-0.026)#46 | 0.14%(-0.060)#1,553 |
| 49. | Marblehead | 0.079% | 0.11%(-0.027)#47 | 0.14%(-0.061)#1,554 |
| 50. | Newton | 0.078% | 0.11%(-0.027)#48 | 0.14%(-0.061)#1,555 |
| 51. | Swampscott | 0.073% | 0.11%(-0.032)#49 | 0.14%(-0.067)#1,556 |
| 52. | Salem | 0.063% | 0.11%(-0.042)#50 | 0.14%(-0.076)#1,557 |
| 53. | Malden | 0.063% | 0.11%(-0.043)#51 | 0.14%(-0.077)#1,558 |
| 54. | Monson Center | 0.060% | 0.11%(-0.045)#52 | 0.14%(-0.080)#1,559 |
| 55. | Holyoke | 0.058% | 0.11%(-0.048)#53 | 0.14%(-0.082)#1,560 |
| 56. | Norwood | 0.045% | 0.11%(-0.061)#54 | 0.14%(-0.095)#1,561 |
| 57. | Amherst | 0.042% | 0.11%(-0.063)#55 | 0.14%(-0.097)#1,562 |
| 58. | Wakefield | 0.037% | 0.11%(-0.068)#56 | 0.14%(-0.102)#1,563 |
| 59. | Gloucester | 0.037% | 0.11%(-0.068)#57 | 0.14%(-0.102)#1,564 |
| 60. | North Attleborough | 0.036% | 0.11%(-0.069)#58 | 0.14%(-0.104)#1,565 |
| 61. | Northampton | 0.028% | 0.11%(-0.077)#59 | 0.14%(-0.111)#1,566 |
| 62. | Fall River | 0.027% | 0.11%(-0.079)#60 | 0.14%(-0.113)#1,567 |
| 63. | Lowell | 0.024% | 0.11%(-0.081)#61 | 0.14%(-0.115)#1,568 |
| 64. | Somerset | 0.022% | 0.11%(-0.083)#62 | 0.14%(-0.117)#1,569 |
| 65. | Attleboro | 0.022% | 0.11%(-0.084)#63 | 0.14%(-0.118)#1,570 |
| 66. | Wellesley | 0.020% | 0.11%(-0.085)#64 | 0.14%(-0.119)#1,571 |
| 67. | Franklin Town | 0.0092% | 0.11%(-0.096)#65 | 0.14%(-0.130)#1,572 |
| 68. | New Bedford | 0.00099% | 0.11%(-0.104)#66 | 0.14%(-0.138)#1,573 |
Common Questions
What are the Top 10 Cities with the Highest Percentage of Immigrants from Peru in Massachusetts?
Top 10 Cities with the Highest Percentage of Immigrants from Peru in Massachusetts are:
#1
3.65%
#2
1.52%
#3
1.33%
#4
1.13%
#5
0.99%
#6
0.81%
#7
0.69%
#8
0.56%
#9
0.49%
#10
0.48%
What city has the Highest Percentage of Immigrants from Peru in Massachusetts?
South Lancaster has the Highest Percentage of Immigrants from Peru in Massachusetts with 3.65%.
What is the Percentage of Immigrants from Peru in the State of Massachusetts?
Percentage of Immigrants from Peru in Massachusetts is 0.11%.
What is the Percentage of Immigrants from Peru in the United States?
Percentage of Immigrants from Peru in the United States is 0.14%.