Cities with the Most Immigrants from Asia in Massachusetts
RELATED REPORTS & OPTIONS
Asia
Massachusetts
Compare Cities
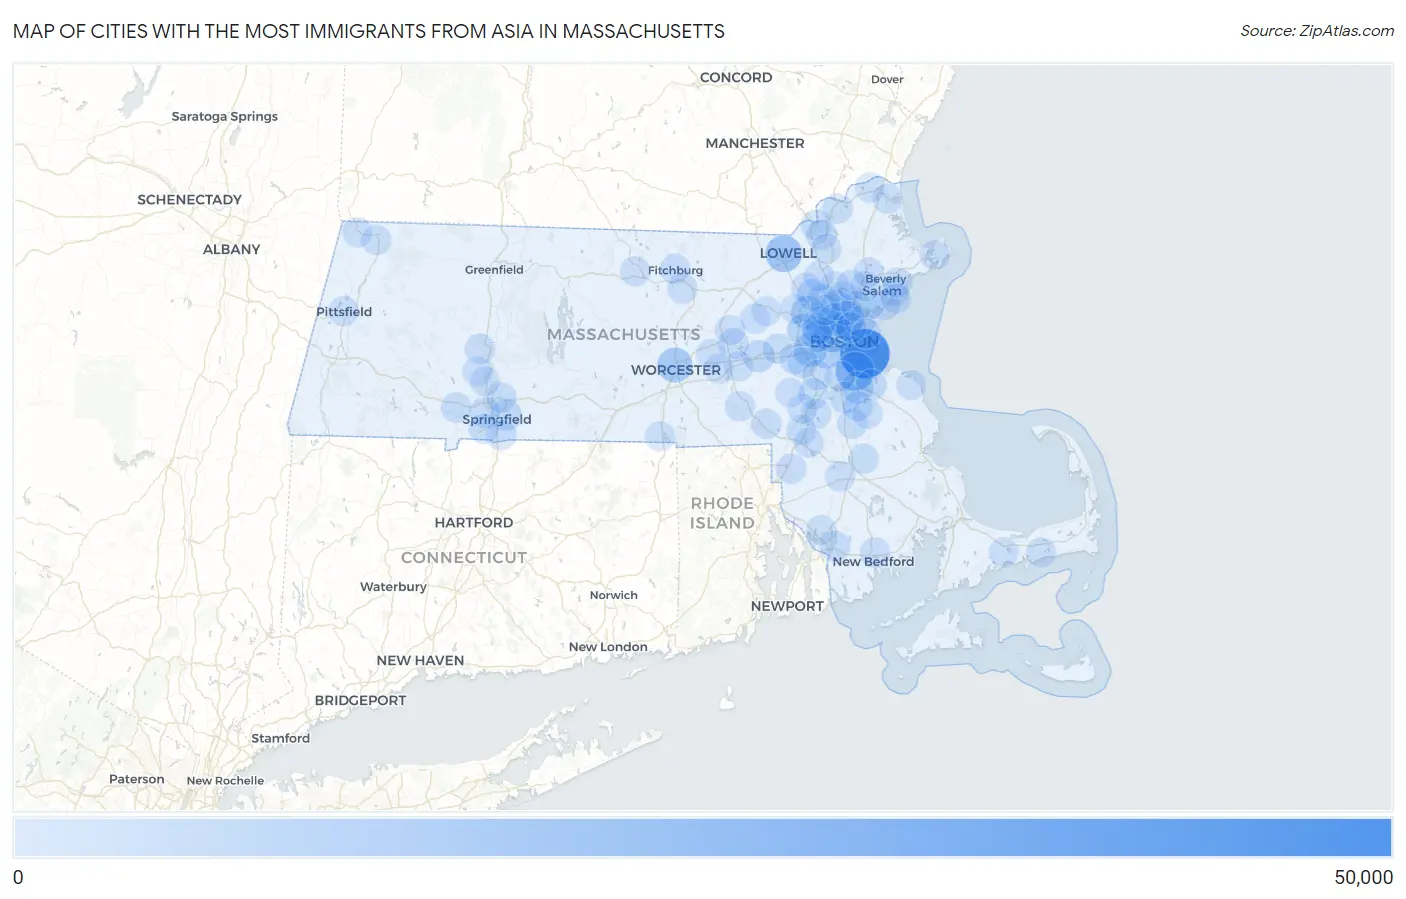
Map of Cities with the Most Immigrants from Asia in Massachusetts
0
50,000
Cities with the Most Immigrants from Asia in Massachusetts
| City | Asia | vs State | vs National | |
| 1. | Boston | 49,800 | 374,834(13.29%)#1 | 14,105,933(0.35%)#20 |
| 2. | Quincy | 21,965 | 374,834(5.86%)#2 | 14,105,933(0.16%)#75 |
| 3. | Cambridge | 16,525 | 374,834(4.41%)#3 | 14,105,933(0.12%)#106 |
| 4. | Lowell | 16,421 | 374,834(4.38%)#4 | 14,105,933(0.12%)#107 |
| 5. | Malden | 13,595 | 374,834(3.63%)#5 | 14,105,933(0.10%)#143 |
| 6. | Worcester | 12,269 | 374,834(3.27%)#6 | 14,105,933(0.09%)#166 |
| 7. | Brookline | 10,322 | 374,834(2.75%)#7 | 14,105,933(0.07%)#196 |
| 8. | Newton | 9,135 | 374,834(2.44%)#8 | 14,105,933(0.06%)#218 |
| 9. | Lexington | 8,270 | 374,834(2.21%)#9 | 14,105,933(0.06%)#248 |
| 10. | Waltham | 7,397 | 374,834(1.97%)#10 | 14,105,933(0.05%)#279 |
| 11. | Somerville | 5,653 | 374,834(1.51%)#11 | 14,105,933(0.04%)#376 |
| 12. | Medford | 5,617 | 374,834(1.50%)#12 | 14,105,933(0.04%)#382 |
| 13. | Braintree Town | 5,165 | 374,834(1.38%)#13 | 14,105,933(0.04%)#409 |
| 14. | Arlington | 4,727 | 374,834(1.26%)#14 | 14,105,933(0.03%)#457 |
| 15. | Framingham | 4,549 | 374,834(1.21%)#15 | 14,105,933(0.03%)#474 |
| 16. | Watertown Town | 4,154 | 374,834(1.11%)#16 | 14,105,933(0.03%)#514 |
| 17. | Belmont | 3,978 | 374,834(1.06%)#17 | 14,105,933(0.03%)#529 |
| 18. | Lynn | 3,835 | 374,834(1.02%)#18 | 14,105,933(0.03%)#548 |
| 19. | Randolph Town | 3,656 | 374,834(0.98%)#19 | 14,105,933(0.03%)#581 |
| 20. | Everett | 3,466 | 374,834(0.92%)#20 | 14,105,933(0.02%)#608 |
| 21. | Springfield | 3,461 | 374,834(0.92%)#21 | 14,105,933(0.02%)#609 |
| 22. | Weymouth Town | 3,210 | 374,834(0.86%)#22 | 14,105,933(0.02%)#647 |
| 23. | Burlington | 3,133 | 374,834(0.84%)#23 | 14,105,933(0.02%)#663 |
| 24. | Amherst | 2,989 | 374,834(0.80%)#24 | 14,105,933(0.02%)#687 |
| 25. | Woburn | 2,963 | 374,834(0.79%)#25 | 14,105,933(0.02%)#691 |
| 26. | Revere | 2,716 | 374,834(0.72%)#26 | 14,105,933(0.02%)#751 |
| 27. | Wellesley | 2,539 | 374,834(0.68%)#27 | 14,105,933(0.02%)#797 |
| 28. | West Springfield Town | 2,453 | 374,834(0.65%)#28 | 14,105,933(0.02%)#814 |
| 29. | Winchester | 2,311 | 374,834(0.62%)#29 | 14,105,933(0.02%)#858 |
| 30. | Methuen Town | 2,174 | 374,834(0.58%)#30 | 14,105,933(0.02%)#901 |
| 31. | Norwood | 2,127 | 374,834(0.57%)#31 | 14,105,933(0.02%)#915 |
| 32. | Marlborough | 2,031 | 374,834(0.54%)#32 | 14,105,933(0.01%)#955 |
| 33. | Needham | 1,903 | 374,834(0.51%)#33 | 14,105,933(0.01%)#1,018 |
| 34. | Melrose | 1,853 | 374,834(0.49%)#34 | 14,105,933(0.01%)#1,037 |
| 35. | Fall River | 1,653 | 374,834(0.44%)#35 | 14,105,933(0.01%)#1,136 |
| 36. | Westfield | 1,599 | 374,834(0.43%)#36 | 14,105,933(0.01%)#1,173 |
| 37. | Lawrence | 1,488 | 374,834(0.40%)#37 | 14,105,933(0.01%)#1,228 |
| 38. | Brockton | 1,414 | 374,834(0.38%)#38 | 14,105,933(0.01%)#1,277 |
| 39. | Chicopee | 1,395 | 374,834(0.37%)#39 | 14,105,933(0.01%)#1,290 |
| 40. | Stoneham | 1,362 | 374,834(0.36%)#40 | 14,105,933(0.01%)#1,309 |
| 41. | Franklin Town | 1,295 | 374,834(0.35%)#41 | 14,105,933(0.01%)#1,348 |
| 42. | North Attleborough | 1,229 | 374,834(0.33%)#42 | 14,105,933(0.01%)#1,394 |
| 43. | Reading | 1,149 | 374,834(0.31%)#43 | 14,105,933(0.01%)#1,454 |
| 44. | Salem | 1,140 | 374,834(0.30%)#44 | 14,105,933(0.01%)#1,463 |
| 45. | Attleboro | 1,123 | 374,834(0.30%)#45 | 14,105,933(0.01%)#1,477 |
| 46. | New Bedford | 1,114 | 374,834(0.30%)#46 | 14,105,933(0.01%)#1,486 |
| 47. | Wakefield | 987 | 374,834(0.26%)#47 | 14,105,933(0.01%)#1,605 |
| 48. | Chelsea | 952 | 374,834(0.25%)#48 | 14,105,933(0.01%)#1,659 |
| 49. | Longmeadow | 951 | 374,834(0.25%)#49 | 14,105,933(0.01%)#1,663 |
| 50. | Taunton | 914 | 374,834(0.24%)#50 | 14,105,933(0.01%)#1,705 |
| 51. | Wilmington | 902 | 374,834(0.24%)#51 | 14,105,933(0.01%)#1,722 |
| 52. | Leominster | 879 | 374,834(0.23%)#52 | 14,105,933(0.01%)#1,749 |
| 53. | Swampscott | 877 | 374,834(0.23%)#53 | 14,105,933(0.01%)#1,755 |
| 54. | Milton | 872 | 374,834(0.23%)#54 | 14,105,933(0.01%)#1,762 |
| 55. | Northampton | 804 | 374,834(0.21%)#55 | 14,105,933(0.01%)#1,857 |
| 56. | Saugus | 801 | 374,834(0.21%)#56 | 14,105,933(0.01%)#1,860 |
| 57. | Lynnfield | 781 | 374,834(0.21%)#57 | 14,105,933(0.01%)#1,892 |
| 58. | Peabody | 778 | 374,834(0.21%)#58 | 14,105,933(0.01%)#1,896 |
| 59. | Haverhill | 770 | 374,834(0.21%)#59 | 14,105,933(0.01%)#1,907 |
| 60. | Beverly | 708 | 374,834(0.19%)#60 | 14,105,933(0.01%)#1,996 |
| 61. | Agawam Town | 659 | 374,834(0.18%)#61 | 14,105,933(0.00%)#2,080 |
| 62. | Cochituate | 658 | 374,834(0.18%)#62 | 14,105,933(0.00%)#2,083 |
| 63. | Dedham | 653 | 374,834(0.17%)#63 | 14,105,933(0.00%)#2,093 |
| 64. | Milford | 633 | 374,834(0.17%)#64 | 14,105,933(0.00%)#2,131 |
| 65. | Bridgewater Town | 630 | 374,834(0.17%)#65 | 14,105,933(0.00%)#2,141 |
| 66. | Andover | 628 | 374,834(0.17%)#66 | 14,105,933(0.00%)#2,148 |
| 67. | Danvers | 615 | 374,834(0.16%)#67 | 14,105,933(0.00%)#2,172 |
| 68. | Fitchburg | 581 | 374,834(0.16%)#68 | 14,105,933(0.00%)#2,246 |
| 69. | Gardner | 569 | 374,834(0.15%)#69 | 14,105,933(0.00%)#2,282 |
| 70. | Hudson | 567 | 374,834(0.15%)#70 | 14,105,933(0.00%)#2,289 |
| 71. | Sharon | 545 | 374,834(0.15%)#71 | 14,105,933(0.00%)#2,329 |
| 72. | Pinehurst | 505 | 374,834(0.13%)#72 | 14,105,933(0.00%)#2,423 |
| 73. | Gloucester | 501 | 374,834(0.13%)#73 | 14,105,933(0.00%)#2,438 |
| 74. | Foxborough | 493 | 374,834(0.13%)#74 | 14,105,933(0.00%)#2,463 |
| 75. | North Adams | 474 | 374,834(0.13%)#75 | 14,105,933(0.00%)#2,526 |
| 76. | Mansfield Center | 432 | 374,834(0.12%)#76 | 14,105,933(0.00%)#2,664 |
| 77. | Holbrook | 416 | 374,834(0.11%)#77 | 14,105,933(0.00%)#2,721 |
| 78. | Barnstable Town | 405 | 374,834(0.11%)#78 | 14,105,933(0.00%)#2,754 |
| 79. | Maynard | 404 | 374,834(0.11%)#79 | 14,105,933(0.00%)#2,758 |
| 80. | South Yarmouth | 398 | 374,834(0.11%)#80 | 14,105,933(0.00%)#2,782 |
| 81. | Easthampton Town | 395 | 374,834(0.11%)#81 | 14,105,933(0.00%)#2,792 |
| 82. | Abington | 384 | 374,834(0.10%)#82 | 14,105,933(0.00%)#2,845 |
| 83. | Pittsfield | 353 | 374,834(0.09%)#83 | 14,105,933(0.00%)#2,978 |
| 84. | Cordaville | 320 | 374,834(0.09%)#84 | 14,105,933(0.00%)#3,151 |
| 85. | Amesbury Town | 299 | 374,834(0.08%)#85 | 14,105,933(0.00%)#3,276 |
| 86. | Winthrop Town | 287 | 374,834(0.08%)#86 | 14,105,933(0.00%)#3,340 |
| 87. | Westborough | 272 | 374,834(0.07%)#87 | 14,105,933(0.00%)#3,426 |
| 88. | Marblehead | 257 | 374,834(0.07%)#88 | 14,105,933(0.00%)#3,495 |
| 89. | Somerset | 254 | 374,834(0.07%)#89 | 14,105,933(0.00%)#3,517 |
| 90. | Newburyport | 253 | 374,834(0.07%)#90 | 14,105,933(0.00%)#3,526 |
| 91. | North Scituate | 250 | 374,834(0.07%)#91 | 14,105,933(0.00%)#3,557 |
| 92. | Northborough | 238 | 374,834(0.06%)#92 | 14,105,933(0.00%)#3,652 |
| 93. | Williamstown | 237 | 374,834(0.06%)#93 | 14,105,933(0.00%)#3,664 |
| 94. | Holyoke | 234 | 374,834(0.06%)#94 | 14,105,933(0.00%)#3,680 |
| 95. | Walpole | 232 | 374,834(0.06%)#95 | 14,105,933(0.00%)#3,701 |
| 96. | Webster | 225 | 374,834(0.06%)#96 | 14,105,933(0.00%)#3,745 |
| 97. | West Concord | 218 | 374,834(0.06%)#97 | 14,105,933(0.00%)#3,811 |
| 98. | Greenfield | 202 | 374,834(0.05%)#98 | 14,105,933(0.00%)#3,943 |
| 99. | Medfield | 198 | 374,834(0.05%)#99 | 14,105,933(0.00%)#3,987 |
| 100. | Hanscom Afb | 198 | 374,834(0.05%)#100 | 14,105,933(0.00%)#3,990 |
Common Questions
What are the Top 10 Cities with the Most Immigrants from Asia in Massachusetts?
Top 10 Cities with the Most Immigrants from Asia in Massachusetts are:
What city has the Most Immigrants from Asia in Massachusetts?
Boston has the Most Immigrants from Asia in Massachusetts with 49,800.
What is the Total Immigrants from Asia in the State of Massachusetts?
Total Immigrants from Asia in Massachusetts is 374,834.
What is the Total Immigrants from Asia in the United States?
Total Immigrants from Asia in the United States is 14,105,933.