Cities with the Highest Percentage of Immigrants from Southern Europe in Massachusetts
RELATED REPORTS & OPTIONS
Southern Europe
Massachusetts
Compare Cities
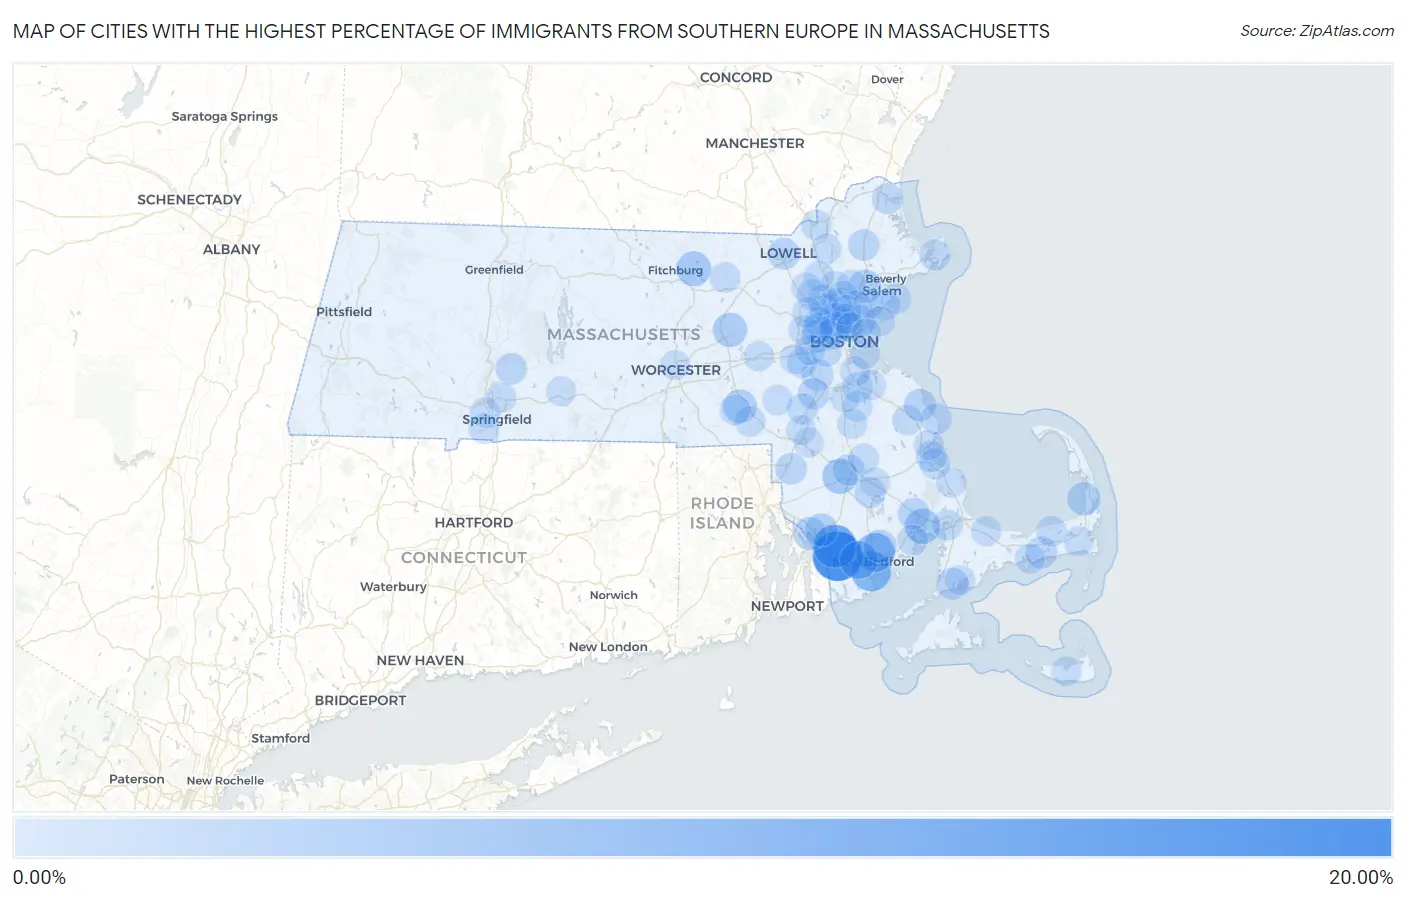
Map of Cities with the Highest Percentage of Immigrants from Southern Europe in Massachusetts
0.00%
20.00%
Cities with the Highest Percentage of Immigrants from Southern Europe in Massachusetts
| City | Southern Europe | vs State | vs National | |
| 1. | North Westport | 16.93% | 1.17%(+15.8)#1 | 0.22%(+16.7)#5 |
| 2. | Fall River | 11.34% | 1.17%(+10.2)#2 | 0.22%(+11.1)#13 |
| 3. | Bliss Corner | 8.87% | 1.17%(+7.70)#3 | 0.22%(+8.65)#29 |
| 4. | New Bedford | 7.83% | 1.17%(+6.66)#4 | 0.22%(+7.61)#35 |
| 5. | Smith Mills | 6.96% | 1.17%(+5.78)#5 | 0.22%(+6.74)#43 |
| 6. | Wareham Center | 4.90% | 1.17%(+3.72)#6 | 0.22%(+4.68)#74 |
| 7. | Taunton | 4.80% | 1.17%(+3.62)#7 | 0.22%(+4.58)#78 |
| 8. | Lunenburg | 4.51% | 1.17%(+3.34)#8 | 0.22%(+4.29)#83 |
| 9. | Hudson | 4.03% | 1.17%(+2.85)#9 | 0.22%(+3.81)#93 |
| 10. | Milford | 3.48% | 1.17%(+2.31)#10 | 0.22%(+3.26)#113 |
| 11. | Peabody | 3.13% | 1.17%(+1.96)#11 | 0.22%(+2.91)#141 |
| 12. | Ocean Grove | 3.08% | 1.17%(+1.91)#12 | 0.22%(+2.86)#147 |
| 13. | North Eastham | 2.99% | 1.17%(+1.82)#13 | 0.22%(+2.77)#157 |
| 14. | Somerset | 2.81% | 1.17%(+1.64)#14 | 0.22%(+2.59)#170 |
| 15. | Acushnet Center | 2.81% | 1.17%(+1.64)#15 | 0.22%(+2.59)#171 |
| 16. | Medford | 2.78% | 1.17%(+1.60)#16 | 0.22%(+2.56)#174 |
| 17. | Somerville | 2.62% | 1.17%(+1.45)#17 | 0.22%(+2.40)#192 |
| 18. | Marshfield Hills | 2.32% | 1.17%(+1.15)#18 | 0.22%(+2.10)#232 |
| 19. | Revere | 2.26% | 1.17%(+1.08)#19 | 0.22%(+2.04)#243 |
| 20. | West Wareham | 2.11% | 1.17%(+0.938)#20 | 0.22%(+1.89)#266 |
| 21. | South Yarmouth | 2.02% | 1.17%(+0.851)#21 | 0.22%(+1.80)#280 |
| 22. | Teaticket | 1.99% | 1.17%(+0.812)#22 | 0.22%(+1.77)#283 |
| 23. | Dedham | 1.94% | 1.17%(+0.771)#23 | 0.22%(+1.72)#294 |
| 24. | Lowell | 1.90% | 1.17%(+0.726)#24 | 0.22%(+1.68)#307 |
| 25. | Everett | 1.89% | 1.17%(+0.718)#25 | 0.22%(+1.67)#309 |
| 26. | Norwood | 1.89% | 1.17%(+0.712)#26 | 0.22%(+1.67)#313 |
| 27. | Watertown Town | 1.77% | 1.17%(+0.600)#27 | 0.22%(+1.55)#347 |
| 28. | Raynham Center | 1.75% | 1.17%(+0.580)#28 | 0.22%(+1.53)#353 |
| 29. | Granby | 1.70% | 1.17%(+0.527)#29 | 0.22%(+1.48)#367 |
| 30. | Boxford | 1.66% | 1.17%(+0.484)#30 | 0.22%(+1.44)#380 |
| 31. | Attleboro | 1.66% | 1.17%(+0.482)#31 | 0.22%(+1.44)#381 |
| 32. | Saugus | 1.55% | 1.17%(+0.377)#32 | 0.22%(+1.33)#416 |
| 33. | Winchester | 1.49% | 1.17%(+0.312)#33 | 0.22%(+1.27)#441 |
| 34. | North Lakeville | 1.43% | 1.17%(+0.257)#34 | 0.22%(+1.21)#458 |
| 35. | Gloucester | 1.40% | 1.17%(+0.231)#35 | 0.22%(+1.18)#474 |
| 36. | Ocean Bluff Brant Rock | 1.40% | 1.17%(+0.228)#36 | 0.22%(+1.18)#475 |
| 37. | Cambridge | 1.37% | 1.17%(+0.200)#37 | 0.22%(+1.15)#487 |
| 38. | North Plymouth | 1.34% | 1.17%(+0.162)#38 | 0.22%(+1.12)#511 |
| 39. | Burlington | 1.31% | 1.17%(+0.141)#39 | 0.22%(+1.09)#533 |
| 40. | Brookline | 1.29% | 1.17%(+0.113)#40 | 0.22%(+1.07)#547 |
| 41. | Newburyport | 1.29% | 1.17%(+0.112)#41 | 0.22%(+1.07)#549 |
| 42. | Stoneham | 1.20% | 1.17%(+0.022)#42 | 0.22%(+0.976)#598 |
| 43. | Arlington | 1.19% | 1.17%(+0.013)#43 | 0.22%(+0.967)#608 |
| 44. | Bellingham | 1.19% | 1.17%(+0.013)#44 | 0.22%(+0.966)#610 |
| 45. | Belmont | 1.19% | 1.17%(+0.012)#45 | 0.22%(+0.965)#611 |
| 46. | Walpole | 1.18% | 1.17%(+0.003)#46 | 0.22%(+0.957)#614 |
| 47. | Buzzards Bay | 1.14% | 1.17%(-0.038)#47 | 0.22%(+0.916)#650 |
| 48. | Marion Center | 1.12% | 1.17%(-0.051)#48 | 0.22%(+0.902)#664 |
| 49. | Plymouth | 1.10% | 1.17%(-0.076)#49 | 0.22%(+0.878)#686 |
| 50. | Needham | 1.06% | 1.17%(-0.113)#50 | 0.22%(+0.841)#720 |
| 51. | Woburn | 1.06% | 1.17%(-0.115)#51 | 0.22%(+0.839)#721 |
| 52. | East Dennis | 1.05% | 1.17%(-0.123)#52 | 0.22%(+0.831)#726 |
| 53. | Methuen Town | 1.05% | 1.17%(-0.125)#53 | 0.22%(+0.829)#729 |
| 54. | North Pembroke | 1.01% | 1.17%(-0.162)#54 | 0.22%(+0.792)#766 |
| 55. | Ayer | 1.01% | 1.17%(-0.163)#55 | 0.22%(+0.790)#769 |
| 56. | Hopedale | 0.99% | 1.17%(-0.183)#56 | 0.22%(+0.771)#792 |
| 57. | Millis Clicquot | 0.95% | 1.17%(-0.220)#57 | 0.22%(+0.734)#826 |
| 58. | Swampscott | 0.95% | 1.17%(-0.228)#58 | 0.22%(+0.725)#837 |
| 59. | Marblehead | 0.94% | 1.17%(-0.235)#59 | 0.22%(+0.719)#844 |
| 60. | Reading | 0.93% | 1.17%(-0.241)#60 | 0.22%(+0.712)#851 |
| 61. | Lexington | 0.93% | 1.17%(-0.242)#61 | 0.22%(+0.712)#852 |
| 62. | Wakefield | 0.89% | 1.17%(-0.283)#62 | 0.22%(+0.671)#899 |
| 63. | Agawam Town | 0.89% | 1.17%(-0.286)#63 | 0.22%(+0.668)#903 |
| 64. | Framingham | 0.85% | 1.17%(-0.321)#64 | 0.22%(+0.632)#930 |
| 65. | West Springfield Town | 0.85% | 1.17%(-0.329)#65 | 0.22%(+0.625)#939 |
| 66. | Holbrook | 0.84% | 1.17%(-0.336)#66 | 0.22%(+0.618)#948 |
| 67. | Wellesley | 0.83% | 1.17%(-0.347)#67 | 0.22%(+0.607)#957 |
| 68. | Bridgewater Town | 0.82% | 1.17%(-0.357)#68 | 0.22%(+0.597)#980 |
| 69. | Andover | 0.81% | 1.17%(-0.367)#69 | 0.22%(+0.587)#992 |
| 70. | Newton | 0.80% | 1.17%(-0.376)#70 | 0.22%(+0.578)#1,007 |
| 71. | Chicopee | 0.80% | 1.17%(-0.377)#71 | 0.22%(+0.577)#1,008 |
| 72. | Wilmington | 0.79% | 1.17%(-0.380)#72 | 0.22%(+0.573)#1,013 |
| 73. | East Harwich | 0.79% | 1.17%(-0.383)#73 | 0.22%(+0.570)#1,021 |
| 74. | Braintree Town | 0.77% | 1.17%(-0.402)#74 | 0.22%(+0.552)#1,048 |
| 75. | Brockton | 0.73% | 1.17%(-0.447)#75 | 0.22%(+0.507)#1,123 |
| 76. | Waltham | 0.72% | 1.17%(-0.451)#76 | 0.22%(+0.503)#1,131 |
| 77. | West Yarmouth | 0.72% | 1.17%(-0.452)#77 | 0.22%(+0.501)#1,135 |
| 78. | East Sandwich | 0.71% | 1.17%(-0.461)#78 | 0.22%(+0.493)#1,148 |
| 79. | Lynnfield | 0.70% | 1.17%(-0.470)#79 | 0.22%(+0.484)#1,178 |
| 80. | The Pinehills | 0.70% | 1.17%(-0.472)#80 | 0.22%(+0.482)#1,183 |
| 81. | Malden | 0.69% | 1.17%(-0.482)#81 | 0.22%(+0.472)#1,201 |
| 82. | Boston | 0.66% | 1.17%(-0.510)#82 | 0.22%(+0.444)#1,263 |
| 83. | Palmer Town | 0.66% | 1.17%(-0.514)#83 | 0.22%(+0.440)#1,279 |
| 84. | Melrose | 0.66% | 1.17%(-0.516)#84 | 0.22%(+0.438)#1,285 |
| 85. | Pinehurst | 0.65% | 1.17%(-0.520)#85 | 0.22%(+0.434)#1,294 |
| 86. | Randolph Town | 0.63% | 1.17%(-0.543)#86 | 0.22%(+0.411)#1,345 |
| 87. | Lynn | 0.62% | 1.17%(-0.557)#87 | 0.22%(+0.397)#1,380 |
| 88. | South Duxbury | 0.62% | 1.17%(-0.558)#88 | 0.22%(+0.396)#1,384 |
| 89. | Quincy | 0.61% | 1.17%(-0.559)#89 | 0.22%(+0.395)#1,387 |
| 90. | Mansfield Center | 0.61% | 1.17%(-0.563)#90 | 0.22%(+0.391)#1,397 |
| 91. | Weymouth Town | 0.59% | 1.17%(-0.586)#91 | 0.22%(+0.368)#1,440 |
| 92. | Chelsea | 0.58% | 1.17%(-0.592)#92 | 0.22%(+0.362)#1,457 |
| 93. | Nahant | 0.57% | 1.17%(-0.604)#93 | 0.22%(+0.349)#1,482 |
| 94. | Middleborough Center | 0.56% | 1.17%(-0.610)#94 | 0.22%(+0.344)#1,503 |
| 95. | North Attleborough | 0.56% | 1.17%(-0.611)#95 | 0.22%(+0.343)#1,506 |
| 96. | Foxborough | 0.55% | 1.17%(-0.619)#96 | 0.22%(+0.334)#1,532 |
| 97. | Nantucket | 0.54% | 1.17%(-0.630)#97 | 0.22%(+0.324)#1,559 |
| 98. | Winthrop Town | 0.54% | 1.17%(-0.633)#98 | 0.22%(+0.321)#1,568 |
| 99. | Worcester | 0.54% | 1.17%(-0.636)#99 | 0.22%(+0.318)#1,577 |
| 100. | East Falmouth | 0.53% | 1.17%(-0.640)#100 | 0.22%(+0.314)#1,582 |
Common Questions
What are the Top 10 Cities with the Highest Percentage of Immigrants from Southern Europe in Massachusetts?
Top 10 Cities with the Highest Percentage of Immigrants from Southern Europe in Massachusetts are:
#1
16.93%
#2
11.34%
#3
8.87%
#4
7.83%
#5
6.96%
#6
4.90%
#7
4.80%
#8
4.51%
#9
4.03%
#10
3.48%
What city has the Highest Percentage of Immigrants from Southern Europe in Massachusetts?
North Westport has the Highest Percentage of Immigrants from Southern Europe in Massachusetts with 16.93%.
What is the Percentage of Immigrants from Southern Europe in the State of Massachusetts?
Percentage of Immigrants from Southern Europe in Massachusetts is 1.17%.
What is the Percentage of Immigrants from Southern Europe in the United States?
Percentage of Immigrants from Southern Europe in the United States is 0.22%.