Cities with the Highest Percentage of Immigrants from China in Massachusetts
RELATED REPORTS & OPTIONS
China
Massachusetts
Compare Cities
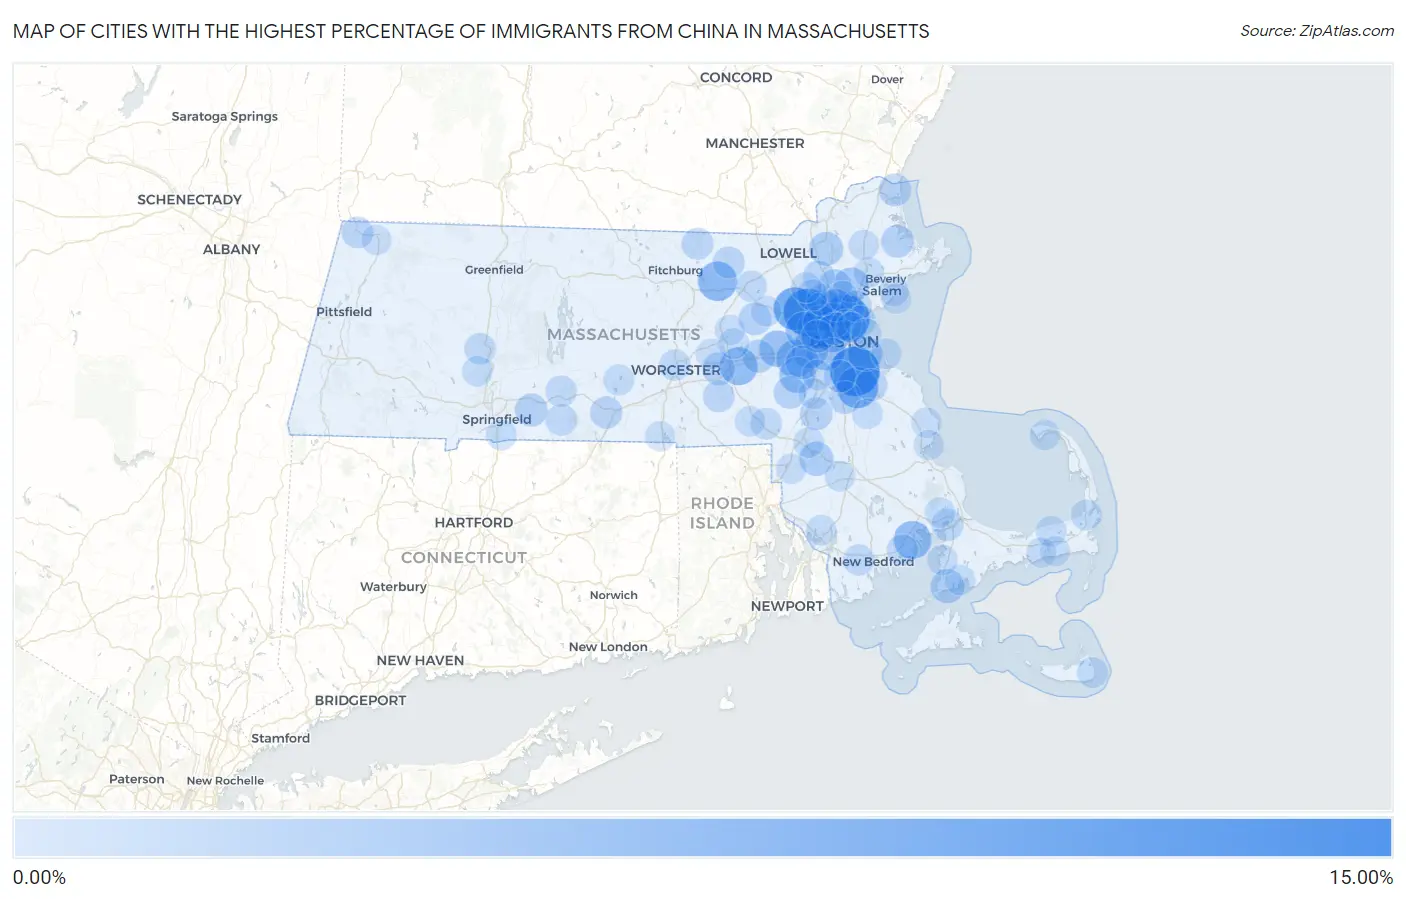
Map of Cities with the Highest Percentage of Immigrants from China in Massachusetts
0.00%
15.00%
Cities with the Highest Percentage of Immigrants from China in Massachusetts
| City | China | vs State | vs National | |
| 1. | Quincy | 13.13% | 1.72%(+11.4)#1 | 0.85%(+12.3)#40 |
| 2. | Lexington | 11.74% | 1.72%(+10.0)#2 | 0.85%(+10.9)#53 |
| 3. | Malden | 11.50% | 1.72%(+9.78)#3 | 0.85%(+10.6)#54 |
| 4. | Hanscom Afb | 8.63% | 1.72%(+6.91)#4 | 0.85%(+7.78)#92 |
| 5. | Braintree Town | 7.62% | 1.72%(+5.90)#5 | 0.85%(+6.76)#126 |
| 6. | Belmont | 6.83% | 1.72%(+5.11)#6 | 0.85%(+5.98)#156 |
| 7. | Winchester | 6.33% | 1.72%(+4.61)#7 | 0.85%(+5.47)#180 |
| 8. | Devens | 6.24% | 1.72%(+4.52)#8 | 0.85%(+5.38)#185 |
| 9. | Brookline | 5.47% | 1.72%(+3.75)#9 | 0.85%(+4.62)#226 |
| 10. | Cordaville | 5.41% | 1.72%(+3.69)#10 | 0.85%(+4.55)#228 |
| 11. | Marion Center | 5.41% | 1.72%(+3.69)#11 | 0.85%(+4.55)#229 |
| 12. | Cambridge | 5.16% | 1.72%(+3.44)#12 | 0.85%(+4.30)#247 |
| 13. | Wellesley | 5.00% | 1.72%(+3.28)#13 | 0.85%(+4.14)#254 |
| 14. | Newton | 4.59% | 1.72%(+2.88)#14 | 0.85%(+3.74)#299 |
| 15. | Cochituate | 4.50% | 1.72%(+2.78)#15 | 0.85%(+3.64)#309 |
| 16. | Waltham | 4.35% | 1.72%(+2.63)#16 | 0.85%(+3.49)#326 |
| 17. | Dover | 4.26% | 1.72%(+2.54)#17 | 0.85%(+3.41)#335 |
| 18. | Melrose | 3.85% | 1.72%(+2.13)#18 | 0.85%(+3.00)#386 |
| 19. | Lynnfield | 3.54% | 1.72%(+1.82)#19 | 0.85%(+2.68)#432 |
| 20. | Medford | 3.41% | 1.72%(+1.69)#20 | 0.85%(+2.56)#453 |
| 21. | Boston | 3.32% | 1.72%(+1.60)#21 | 0.85%(+2.47)#469 |
| 22. | Amherst | 3.21% | 1.72%(+1.49)#22 | 0.85%(+2.35)#493 |
| 23. | Arlington | 2.93% | 1.72%(+1.21)#23 | 0.85%(+2.07)#552 |
| 24. | Norton Center | 2.91% | 1.72%(+1.19)#24 | 0.85%(+2.05)#556 |
| 25. | Falmouth | 2.81% | 1.72%(+1.09)#25 | 0.85%(+1.95)#595 |
| 26. | Needham | 2.76% | 1.72%(+1.04)#26 | 0.85%(+1.91)#607 |
| 27. | Andover | 2.74% | 1.72%(+1.02)#27 | 0.85%(+1.88)#610 |
| 28. | Reading | 2.70% | 1.72%(+0.977)#28 | 0.85%(+1.84)#620 |
| 29. | Framingham | 2.20% | 1.72%(+0.486)#29 | 0.85%(+1.35)#771 |
| 30. | Wilbraham | 2.11% | 1.72%(+0.391)#30 | 0.85%(+1.26)#808 |
| 31. | Westborough | 2.05% | 1.72%(+0.336)#31 | 0.85%(+1.20)#838 |
| 32. | Maynard | 2.02% | 1.72%(+0.305)#32 | 0.85%(+1.17)#853 |
| 33. | Stoneham | 2.02% | 1.72%(+0.304)#33 | 0.85%(+1.17)#855 |
| 34. | Randolph Town | 2.00% | 1.72%(+0.282)#34 | 0.85%(+1.15)#871 |
| 35. | Ipswich | 1.99% | 1.72%(+0.272)#35 | 0.85%(+1.14)#875 |
| 36. | Somerville | 1.99% | 1.72%(+0.270)#36 | 0.85%(+1.13)#877 |
| 37. | Salisbury | 1.97% | 1.72%(+0.255)#37 | 0.85%(+1.12)#884 |
| 38. | Sharon | 1.97% | 1.72%(+0.254)#38 | 0.85%(+1.12)#886 |
| 39. | Medfield | 1.95% | 1.72%(+0.228)#39 | 0.85%(+1.09)#902 |
| 40. | Watertown Town | 1.93% | 1.72%(+0.208)#40 | 0.85%(+1.07)#914 |
| 41. | Weymouth Town | 1.78% | 1.72%(+0.065)#41 | 0.85%(+0.929)#996 |
| 42. | Milton | 1.70% | 1.72%(-0.014)#42 | 0.85%(+0.850)#1,046 |
| 43. | Fiskdale | 1.66% | 1.72%(-0.056)#43 | 0.85%(+0.808)#1,076 |
| 44. | Buzzards Bay | 1.64% | 1.72%(-0.082)#44 | 0.85%(+0.783)#1,098 |
| 45. | Groton | 1.56% | 1.72%(-0.156)#45 | 0.85%(+0.708)#1,140 |
| 46. | Townsend | 1.41% | 1.72%(-0.304)#46 | 0.85%(+0.560)#1,271 |
| 47. | Upton | 1.39% | 1.72%(-0.332)#47 | 0.85%(+0.532)#1,305 |
| 48. | Woburn | 1.28% | 1.72%(-0.438)#48 | 0.85%(+0.426)#1,427 |
| 49. | Williamstown | 1.27% | 1.72%(-0.451)#49 | 0.85%(+0.413)#1,441 |
| 50. | Wilmington | 1.26% | 1.72%(-0.455)#50 | 0.85%(+0.409)#1,446 |
| 51. | Monson Center | 1.20% | 1.72%(-0.523)#51 | 0.85%(+0.341)#1,520 |
| 52. | Revere | 1.19% | 1.72%(-0.527)#52 | 0.85%(+0.337)#1,525 |
| 53. | Northampton | 1.19% | 1.72%(-0.533)#53 | 0.85%(+0.332)#1,530 |
| 54. | Franklin Town | 1.18% | 1.72%(-0.541)#54 | 0.85%(+0.323)#1,547 |
| 55. | Palmer Town | 1.12% | 1.72%(-0.600)#55 | 0.85%(+0.265)#1,611 |
| 56. | Mattapoisett Center | 1.10% | 1.72%(-0.622)#56 | 0.85%(+0.242)#1,634 |
| 57. | Saugus | 1.09% | 1.72%(-0.627)#57 | 0.85%(+0.238)#1,641 |
| 58. | Littleton Common | 1.08% | 1.72%(-0.639)#58 | 0.85%(+0.226)#1,666 |
| 59. | Worcester | 1.06% | 1.72%(-0.654)#59 | 0.85%(+0.210)#1,687 |
| 60. | Burlington | 1.06% | 1.72%(-0.656)#60 | 0.85%(+0.208)#1,696 |
| 61. | Smith Mills | 1.05% | 1.72%(-0.665)#61 | 0.85%(+0.199)#1,708 |
| 62. | Everett | 1.04% | 1.72%(-0.677)#62 | 0.85%(+0.187)#1,726 |
| 63. | East Brookfield | 0.97% | 1.72%(-0.752)#63 | 0.85%(+0.112)#1,847 |
| 64. | Siasconset | 0.87% | 1.72%(-0.849)#64 | 0.85%(+0.015)#2,019 |
| 65. | North Attleborough | 0.81% | 1.72%(-0.909)#65 | 0.85%(-0.045)#2,131 |
| 66. | Pinehurst | 0.79% | 1.72%(-0.925)#66 | 0.85%(-0.061)#2,180 |
| 67. | Orleans | 0.78% | 1.72%(-0.938)#67 | 0.85%(-0.074)#2,206 |
| 68. | Mansfield Center | 0.77% | 1.72%(-0.951)#68 | 0.85%(-0.087)#2,240 |
| 69. | Longmeadow | 0.76% | 1.72%(-0.959)#69 | 0.85%(-0.094)#2,259 |
| 70. | East Dennis | 0.75% | 1.72%(-0.964)#70 | 0.85%(-0.100)#2,277 |
| 71. | Hull | 0.75% | 1.72%(-0.967)#71 | 0.85%(-0.103)#2,285 |
| 72. | Wakefield | 0.73% | 1.72%(-0.987)#72 | 0.85%(-0.123)#2,330 |
| 73. | Norwood | 0.73% | 1.72%(-0.988)#73 | 0.85%(-0.124)#2,334 |
| 74. | Chelsea | 0.72% | 1.72%(-0.997)#74 | 0.85%(-0.132)#2,357 |
| 75. | Marlborough | 0.72% | 1.72%(-1.00)#75 | 0.85%(-0.139)#2,371 |
| 76. | Easthampton Town | 0.69% | 1.72%(-1.02)#76 | 0.85%(-0.160)#2,423 |
| 77. | White Island Shores | 0.67% | 1.72%(-1.04)#77 | 0.85%(-0.180)#2,467 |
| 78. | Provincetown | 0.64% | 1.72%(-1.08)#78 | 0.85%(-0.214)#2,567 |
| 79. | East Falmouth | 0.64% | 1.72%(-1.08)#79 | 0.85%(-0.214)#2,570 |
| 80. | Dedham | 0.64% | 1.72%(-1.08)#80 | 0.85%(-0.214)#2,574 |
| 81. | Winthrop Town | 0.61% | 1.72%(-1.10)#81 | 0.85%(-0.240)#2,654 |
| 82. | North Falmouth | 0.60% | 1.72%(-1.11)#82 | 0.85%(-0.250)#2,679 |
| 83. | Taunton | 0.60% | 1.72%(-1.12)#83 | 0.85%(-0.259)#2,706 |
| 84. | Bellingham | 0.58% | 1.72%(-1.14)#84 | 0.85%(-0.272)#2,750 |
| 85. | Danvers | 0.58% | 1.72%(-1.14)#85 | 0.85%(-0.274)#2,756 |
| 86. | Somerset | 0.57% | 1.72%(-1.15)#86 | 0.85%(-0.285)#2,804 |
| 87. | Abington | 0.56% | 1.72%(-1.16)#87 | 0.85%(-0.296)#2,843 |
| 88. | West Concord | 0.56% | 1.72%(-1.16)#88 | 0.85%(-0.296)#2,844 |
| 89. | Boxford | 0.55% | 1.72%(-1.17)#89 | 0.85%(-0.302)#2,863 |
| 90. | Hudson | 0.54% | 1.72%(-1.18)#90 | 0.85%(-0.319)#2,943 |
| 91. | Northborough | 0.52% | 1.72%(-1.19)#91 | 0.85%(-0.330)#2,991 |
| 92. | North Adams | 0.49% | 1.72%(-1.22)#92 | 0.85%(-0.360)#3,127 |
| 93. | Marshfield | 0.49% | 1.72%(-1.23)#93 | 0.85%(-0.361)#3,134 |
| 94. | Attleboro | 0.46% | 1.72%(-1.26)#94 | 0.85%(-0.397)#3,301 |
| 95. | Dennis Port | 0.45% | 1.72%(-1.26)#95 | 0.85%(-0.400)#3,317 |
| 96. | Marblehead | 0.44% | 1.72%(-1.28)#96 | 0.85%(-0.412)#3,386 |
| 97. | Salem | 0.42% | 1.72%(-1.30)#97 | 0.85%(-0.432)#3,510 |
| 98. | South Yarmouth | 0.42% | 1.72%(-1.30)#98 | 0.85%(-0.439)#3,550 |
| 99. | South Duxbury | 0.41% | 1.72%(-1.31)#99 | 0.85%(-0.444)#3,574 |
| 100. | Webster | 0.38% | 1.72%(-1.34)#100 | 0.85%(-0.471)#3,725 |
Common Questions
What are the Top 10 Cities with the Highest Percentage of Immigrants from China in Massachusetts?
Top 10 Cities with the Highest Percentage of Immigrants from China in Massachusetts are:
#1
13.13%
#2
11.74%
#3
11.50%
#4
8.63%
#5
7.62%
#6
6.83%
#7
6.33%
#8
6.24%
#9
5.47%
#10
5.41%
What city has the Highest Percentage of Immigrants from China in Massachusetts?
Quincy has the Highest Percentage of Immigrants from China in Massachusetts with 13.13%.
What is the Percentage of Immigrants from China in the State of Massachusetts?
Percentage of Immigrants from China in Massachusetts is 1.72%.
What is the Percentage of Immigrants from China in the United States?
Percentage of Immigrants from China in the United States is 0.85%.