Cities with the Most Immigrants from Central America in Massachusetts
RELATED REPORTS & OPTIONS
Central America
Massachusetts
Compare Cities
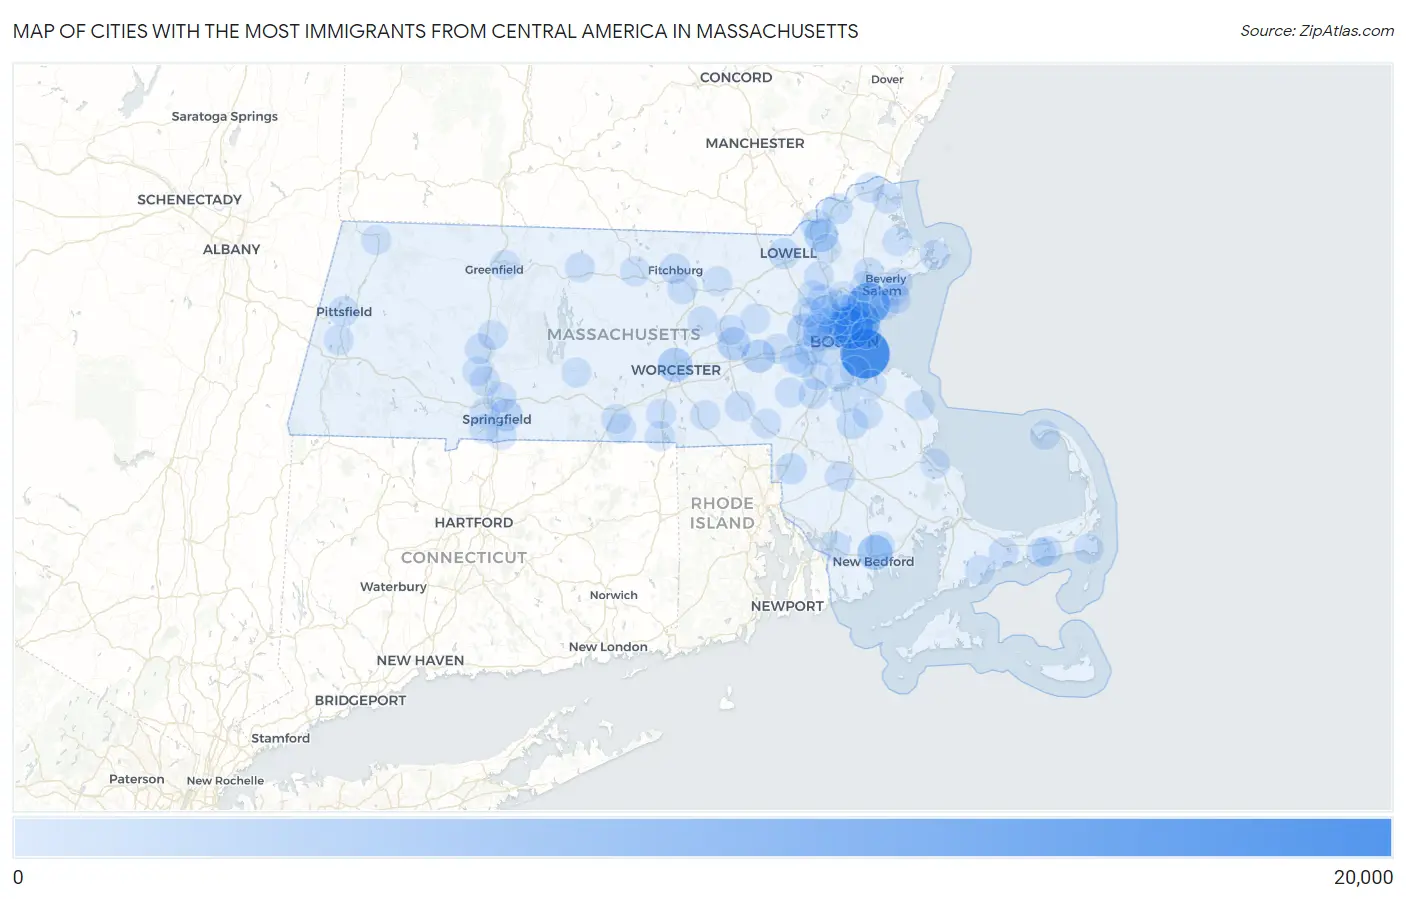
Map of Cities with the Most Immigrants from Central America in Massachusetts
0
20,000
Cities with the Most Immigrants from Central America in Massachusetts
| City | Central America | vs State | vs National | |
| 1. | Boston | 18,761 | 112,052(16.74%)#1 | 14,469,050(0.13%)#93 |
| 2. | Chelsea | 12,616 | 112,052(11.26%)#2 | 14,469,050(0.09%)#146 |
| 3. | Lynn | 11,426 | 112,052(10.20%)#3 | 14,469,050(0.08%)#169 |
| 4. | Revere | 9,533 | 112,052(8.51%)#4 | 14,469,050(0.07%)#213 |
| 5. | Everett | 5,646 | 112,052(5.04%)#5 | 14,469,050(0.04%)#376 |
| 6. | New Bedford | 4,534 | 112,052(4.05%)#6 | 14,469,050(0.03%)#472 |
| 7. | Worcester | 3,898 | 112,052(3.48%)#7 | 14,469,050(0.03%)#549 |
| 8. | Lawrence | 3,461 | 112,052(3.09%)#8 | 14,469,050(0.02%)#609 |
| 9. | Waltham | 2,877 | 112,052(2.57%)#9 | 14,469,050(0.02%)#724 |
| 10. | Framingham | 2,794 | 112,052(2.49%)#10 | 14,469,050(0.02%)#742 |
| 11. | Somerville | 2,784 | 112,052(2.48%)#11 | 14,469,050(0.02%)#746 |
| 12. | Marlborough | 2,740 | 112,052(2.45%)#12 | 14,469,050(0.02%)#755 |
| 13. | Springfield | 2,181 | 112,052(1.95%)#13 | 14,469,050(0.02%)#893 |
| 14. | Malden | 1,689 | 112,052(1.51%)#14 | 14,469,050(0.01%)#1,089 |
| 15. | Cambridge | 1,235 | 112,052(1.10%)#15 | 14,469,050(0.01%)#1,346 |
| 16. | Methuen Town | 1,171 | 112,052(1.05%)#16 | 14,469,050(0.01%)#1,413 |
| 17. | Medford | 1,081 | 112,052(0.96%)#17 | 14,469,050(0.01%)#1,497 |
| 18. | Brockton | 1,076 | 112,052(0.96%)#18 | 14,469,050(0.01%)#1,501 |
| 19. | Lowell | 929 | 112,052(0.83%)#19 | 14,469,050(0.01%)#1,672 |
| 20. | Attleboro | 919 | 112,052(0.82%)#20 | 14,469,050(0.01%)#1,689 |
| 21. | Saugus | 827 | 112,052(0.74%)#21 | 14,469,050(0.01%)#1,805 |
| 22. | Woburn | 803 | 112,052(0.72%)#22 | 14,469,050(0.01%)#1,834 |
| 23. | Haverhill | 789 | 112,052(0.70%)#23 | 14,469,050(0.01%)#1,860 |
| 24. | Fall River | 624 | 112,052(0.56%)#24 | 14,469,050(0.00%)#2,173 |
| 25. | Leominster | 548 | 112,052(0.49%)#25 | 14,469,050(0.00%)#2,368 |
| 26. | Newton | 510 | 112,052(0.46%)#26 | 14,469,050(0.00%)#2,456 |
| 27. | Norwood | 484 | 112,052(0.43%)#27 | 14,469,050(0.00%)#2,549 |
| 28. | Fitchburg | 475 | 112,052(0.42%)#28 | 14,469,050(0.00%)#2,576 |
| 29. | Watertown Town | 446 | 112,052(0.40%)#29 | 14,469,050(0.00%)#2,679 |
| 30. | Milford | 440 | 112,052(0.39%)#30 | 14,469,050(0.00%)#2,701 |
| 31. | Winthrop Town | 439 | 112,052(0.39%)#31 | 14,469,050(0.00%)#2,704 |
| 32. | Quincy | 365 | 112,052(0.33%)#32 | 14,469,050(0.00%)#3,009 |
| 33. | Salem | 359 | 112,052(0.32%)#33 | 14,469,050(0.00%)#3,035 |
| 34. | Northampton | 286 | 112,052(0.26%)#34 | 14,469,050(0.00%)#3,430 |
| 35. | Pittsfield | 263 | 112,052(0.23%)#35 | 14,469,050(0.00%)#3,613 |
| 36. | Gloucester | 258 | 112,052(0.23%)#36 | 14,469,050(0.00%)#3,639 |
| 37. | Amherst | 247 | 112,052(0.22%)#37 | 14,469,050(0.00%)#3,725 |
| 38. | Arlington | 243 | 112,052(0.22%)#38 | 14,469,050(0.00%)#3,759 |
| 39. | Holyoke | 238 | 112,052(0.21%)#39 | 14,469,050(0.00%)#3,798 |
| 40. | Peabody | 227 | 112,052(0.20%)#40 | 14,469,050(0.00%)#3,875 |
| 41. | West Dennis | 227 | 112,052(0.20%)#41 | 14,469,050(0.00%)#3,879 |
| 42. | Clinton | 218 | 112,052(0.19%)#42 | 14,469,050(0.00%)#3,949 |
| 43. | Melrose | 212 | 112,052(0.19%)#43 | 14,469,050(0.00%)#3,988 |
| 44. | Chicopee | 206 | 112,052(0.18%)#44 | 14,469,050(0.00%)#4,051 |
| 45. | Dedham | 205 | 112,052(0.18%)#45 | 14,469,050(0.00%)#4,068 |
| 46. | Barnstable Town | 203 | 112,052(0.18%)#46 | 14,469,050(0.00%)#4,091 |
| 47. | Hudson | 202 | 112,052(0.18%)#47 | 14,469,050(0.00%)#4,102 |
| 48. | Danvers | 201 | 112,052(0.18%)#48 | 14,469,050(0.00%)#4,112 |
| 49. | Lexington | 199 | 112,052(0.18%)#49 | 14,469,050(0.00%)#4,135 |
| 50. | Brookline | 189 | 112,052(0.17%)#50 | 14,469,050(0.00%)#4,268 |
| 51. | Weymouth Town | 186 | 112,052(0.17%)#51 | 14,469,050(0.00%)#4,310 |
| 52. | Taunton | 184 | 112,052(0.16%)#52 | 14,469,050(0.00%)#4,326 |
| 53. | Swampscott | 169 | 112,052(0.15%)#53 | 14,469,050(0.00%)#4,548 |
| 54. | Beverly | 165 | 112,052(0.15%)#54 | 14,469,050(0.00%)#4,606 |
| 55. | Cochituate | 142 | 112,052(0.13%)#55 | 14,469,050(0.00%)#4,925 |
| 56. | North Adams | 141 | 112,052(0.13%)#56 | 14,469,050(0.00%)#4,937 |
| 57. | Needham | 130 | 112,052(0.12%)#57 | 14,469,050(0.00%)#5,091 |
| 58. | Wellesley | 123 | 112,052(0.11%)#58 | 14,469,050(0.00%)#5,218 |
| 59. | Stoneham | 123 | 112,052(0.11%)#59 | 14,469,050(0.00%)#5,219 |
| 60. | Belmont | 110 | 112,052(0.10%)#60 | 14,469,050(0.00%)#5,491 |
| 61. | Milton | 106 | 112,052(0.09%)#61 | 14,469,050(0.00%)#5,571 |
| 62. | West Springfield Town | 98 | 112,052(0.09%)#62 | 14,469,050(0.00%)#5,769 |
| 63. | Gardner | 96 | 112,052(0.09%)#63 | 14,469,050(0.00%)#5,817 |
| 64. | Whitinsville | 95 | 112,052(0.08%)#64 | 14,469,050(0.00%)#5,843 |
| 65. | Easthampton Town | 93 | 112,052(0.08%)#65 | 14,469,050(0.00%)#5,887 |
| 66. | Burlington | 91 | 112,052(0.08%)#66 | 14,469,050(0.00%)#5,939 |
| 67. | Winchester | 91 | 112,052(0.08%)#67 | 14,469,050(0.00%)#5,940 |
| 68. | Randolph Town | 87 | 112,052(0.08%)#68 | 14,469,050(0.00%)#6,061 |
| 69. | Franklin Town | 83 | 112,052(0.07%)#69 | 14,469,050(0.00%)#6,167 |
| 70. | Longmeadow | 83 | 112,052(0.07%)#70 | 14,469,050(0.00%)#6,169 |
| 71. | Webster | 79 | 112,052(0.07%)#71 | 14,469,050(0.00%)#6,297 |
| 72. | West Chatham | 79 | 112,052(0.07%)#72 | 14,469,050(0.00%)#6,309 |
| 73. | Ipswich | 78 | 112,052(0.07%)#73 | 14,469,050(0.00%)#6,331 |
| 74. | Amesbury Town | 77 | 112,052(0.07%)#74 | 14,469,050(0.00%)#6,344 |
| 75. | Turners Falls | 73 | 112,052(0.07%)#75 | 14,469,050(0.00%)#6,470 |
| 76. | Provincetown | 69 | 112,052(0.06%)#76 | 14,469,050(0.00%)#6,614 |
| 77. | Abington | 65 | 112,052(0.06%)#77 | 14,469,050(0.00%)#6,734 |
| 78. | Oxford | 65 | 112,052(0.06%)#78 | 14,469,050(0.00%)#6,750 |
| 79. | North Attleborough | 61 | 112,052(0.05%)#79 | 14,469,050(0.00%)#6,898 |
| 80. | Plymouth | 56 | 112,052(0.05%)#80 | 14,469,050(0.00%)#7,116 |
| 81. | Acushnet Center | 56 | 112,052(0.05%)#81 | 14,469,050(0.00%)#7,129 |
| 82. | Greenfield | 51 | 112,052(0.05%)#82 | 14,469,050(0.00%)#7,356 |
| 83. | Lenox | 50 | 112,052(0.04%)#83 | 14,469,050(0.00%)#7,435 |
| 84. | Maynard | 49 | 112,052(0.04%)#84 | 14,469,050(0.00%)#7,471 |
| 85. | Hatfield | 49 | 112,052(0.04%)#85 | 14,469,050(0.00%)#7,496 |
| 86. | Medfield | 48 | 112,052(0.04%)#86 | 14,469,050(0.00%)#7,536 |
| 87. | Agawam Town | 44 | 112,052(0.04%)#87 | 14,469,050(0.00%)#7,746 |
| 88. | Athol | 40 | 112,052(0.04%)#88 | 14,469,050(0.00%)#7,996 |
| 89. | Newburyport | 39 | 112,052(0.03%)#89 | 14,469,050(0.00%)#8,045 |
| 90. | Southbridge Town | 37 | 112,052(0.03%)#90 | 14,469,050(0.00%)#8,182 |
| 91. | Devens | 37 | 112,052(0.03%)#91 | 14,469,050(0.00%)#8,205 |
| 92. | Andover | 34 | 112,052(0.03%)#92 | 14,469,050(0.00%)#8,372 |
| 93. | Wakefield | 32 | 112,052(0.03%)#93 | 14,469,050(0.00%)#8,517 |
| 94. | Marblehead | 29 | 112,052(0.03%)#94 | 14,469,050(0.00%)#8,733 |
| 95. | Wilmington | 28 | 112,052(0.02%)#95 | 14,469,050(0.00%)#8,814 |
| 96. | Ware | 27 | 112,052(0.02%)#96 | 14,469,050(0.00%)#8,918 |
| 97. | Marshfield Hills | 26 | 112,052(0.02%)#97 | 14,469,050(0.00%)#9,034 |
| 98. | Sturbridge | 23 | 112,052(0.02%)#98 | 14,469,050(0.00%)#9,357 |
| 99. | South Yarmouth | 22 | 112,052(0.02%)#99 | 14,469,050(0.00%)#9,424 |
| 100. | Mashpee Neck | 22 | 112,052(0.02%)#100 | 14,469,050(0.00%)#9,498 |
Common Questions
What are the Top 10 Cities with the Most Immigrants from Central America in Massachusetts?
Top 10 Cities with the Most Immigrants from Central America in Massachusetts are:
#1
18,761
#2
12,616
#3
11,426
#4
9,533
#5
5,646
#6
4,534
#7
3,898
#8
3,461
#9
2,877
#10
2,794
What city has the Most Immigrants from Central America in Massachusetts?
Boston has the Most Immigrants from Central America in Massachusetts with 18,761.
What is the Total Immigrants from Central America in the State of Massachusetts?
Total Immigrants from Central America in Massachusetts is 112,052.
What is the Total Immigrants from Central America in the United States?
Total Immigrants from Central America in the United States is 14,469,050.