Ocean Bluff Brant Rock, MA
Ocean Bluff Brant Rock Map
Ocean Bluff Brant Rock Overview
4,637
TOTAL POPULATION
2,344
MALE POPULATION
2,293
FEMALE POPULATION
102.22
MALES / 100 FEMALES
97.82
FEMALES / 100 MALES
54.1
MEDIAN AGE
2.8
AVG FAMILY SIZE
2.3
AVG HOUSEHOLD SIZE
$52,831
PER CAPITA INCOME
$130,156
AVG FAMILY INCOME
$106,528
AVG HOUSEHOLD INCOME
7.8%
WAGE / INCOME GAP [ % ]
92.2¢/ $1
WAGE / INCOME GAP [ $ ]
0.42
INEQUALITY / GINI INDEX
2,827
LABOR FORCE [ PEOPLE ]
67.3%
PERCENT IN LABOR FORCE
6.3%
UNEMPLOYMENT RATE
Race in Ocean Bluff Brant Rock
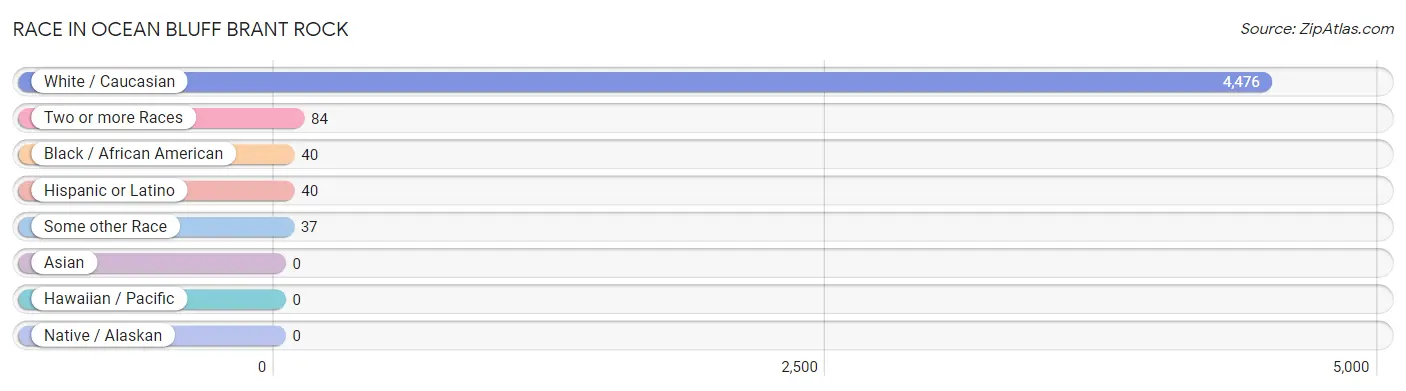
The most populous races in Ocean Bluff Brant Rock are White / Caucasian (4,476 | 96.5%), Two or more Races (84 | 1.8%), and Black / African American (40 | 0.9%).
| Race | # Population | % Population |
| Asian | 0 | 0.0% |
| Black / African American | 40 | 0.9% |
| Hawaiian / Pacific | 0 | 0.0% |
| Hispanic or Latino | 40 | 0.9% |
| Native / Alaskan | 0 | 0.0% |
| White / Caucasian | 4,476 | 96.5% |
| Two or more Races | 84 | 1.8% |
| Some other Race | 37 | 0.8% |
| Total | 4,637 | 100.0% |
Ancestry in Ocean Bluff Brant Rock
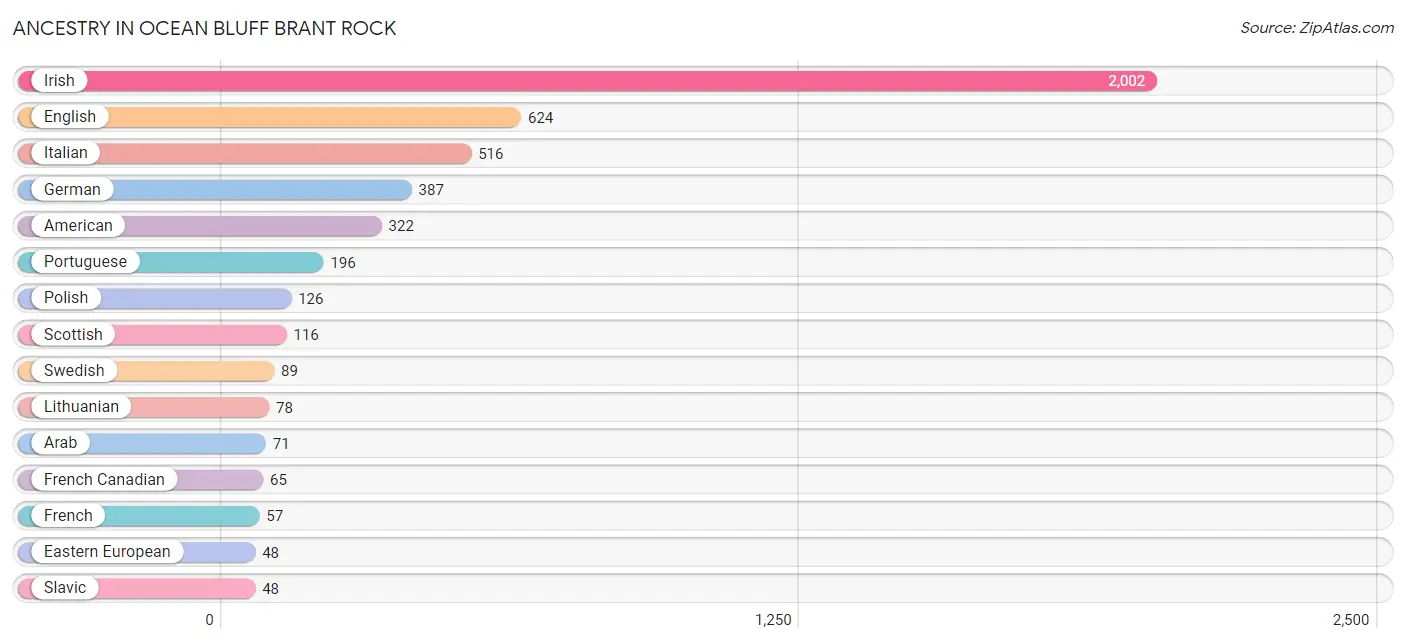
The most populous ancestries reported in Ocean Bluff Brant Rock are Irish (2,002 | 43.2%), English (624 | 13.5%), Italian (516 | 11.1%), German (387 | 8.4%), and American (322 | 6.9%), together accounting for 83.1% of all Ocean Bluff Brant Rock residents.
| Ancestry | # Population | % Population |
| American | 322 | 6.9% |
| Arab | 71 | 1.5% |
| Austrian | 30 | 0.6% |
| British | 44 | 0.9% |
| Canadian | 7 | 0.2% |
| Cuban | 8 | 0.2% |
| Dutch | 20 | 0.4% |
| Eastern European | 48 | 1.0% |
| English | 624 | 13.5% |
| French | 57 | 1.2% |
| French Canadian | 65 | 1.4% |
| German | 387 | 8.4% |
| Greek | 40 | 0.9% |
| Hungarian | 20 | 0.4% |
| Irish | 2,002 | 43.2% |
| Italian | 516 | 11.1% |
| Laotian | 23 | 0.5% |
| Lebanese | 24 | 0.5% |
| Lithuanian | 78 | 1.7% |
| Mexican | 9 | 0.2% |
| Norwegian | 27 | 0.6% |
| Paraguayan | 5 | 0.1% |
| Polish | 126 | 2.7% |
| Portuguese | 196 | 4.2% |
| Puerto Rican | 18 | 0.4% |
| Scandinavian | 18 | 0.4% |
| Scotch-Irish | 42 | 0.9% |
| Scottish | 116 | 2.5% |
| Slavic | 48 | 1.0% |
| South American | 5 | 0.1% |
| Swedish | 89 | 1.9% |
| Syrian | 47 | 1.0% |
| Ukrainian | 26 | 0.6% | View All 33 Rows |
Immigrants in Ocean Bluff Brant Rock
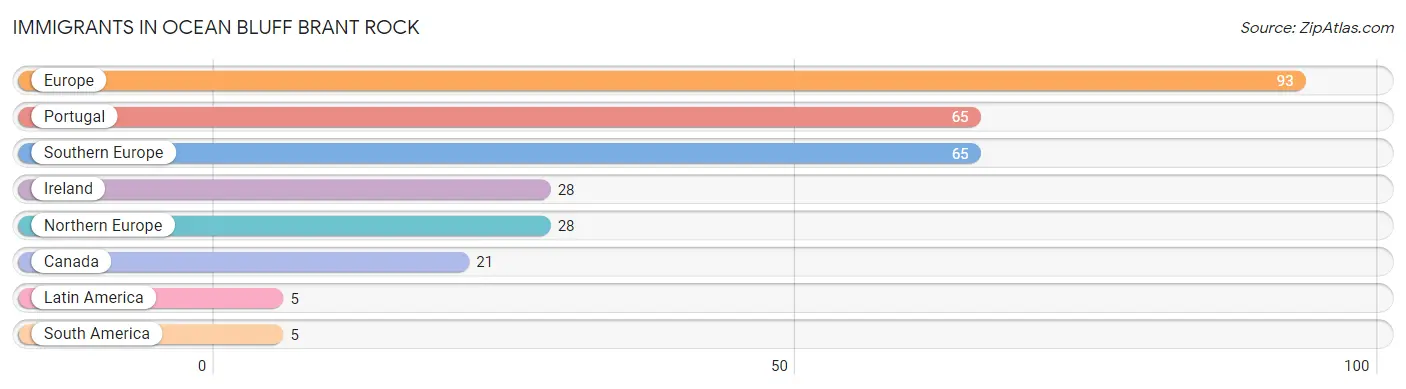
The most numerous immigrant groups reported in Ocean Bluff Brant Rock came from Europe (93 | 2.0%), Portugal (65 | 1.4%), Southern Europe (65 | 1.4%), Ireland (28 | 0.6%), and Northern Europe (28 | 0.6%), together accounting for 6.0% of all Ocean Bluff Brant Rock residents.
| Immigration Origin | # Population | % Population |
| Canada | 21 | 0.4% |
| Europe | 93 | 2.0% |
| Ireland | 28 | 0.6% |
| Latin America | 5 | 0.1% |
| Northern Europe | 28 | 0.6% |
| Portugal | 65 | 1.4% |
| South America | 5 | 0.1% |
| Southern Europe | 65 | 1.4% | View All 8 Rows |
Sex and Age in Ocean Bluff Brant Rock
Sex and Age in Ocean Bluff Brant Rock
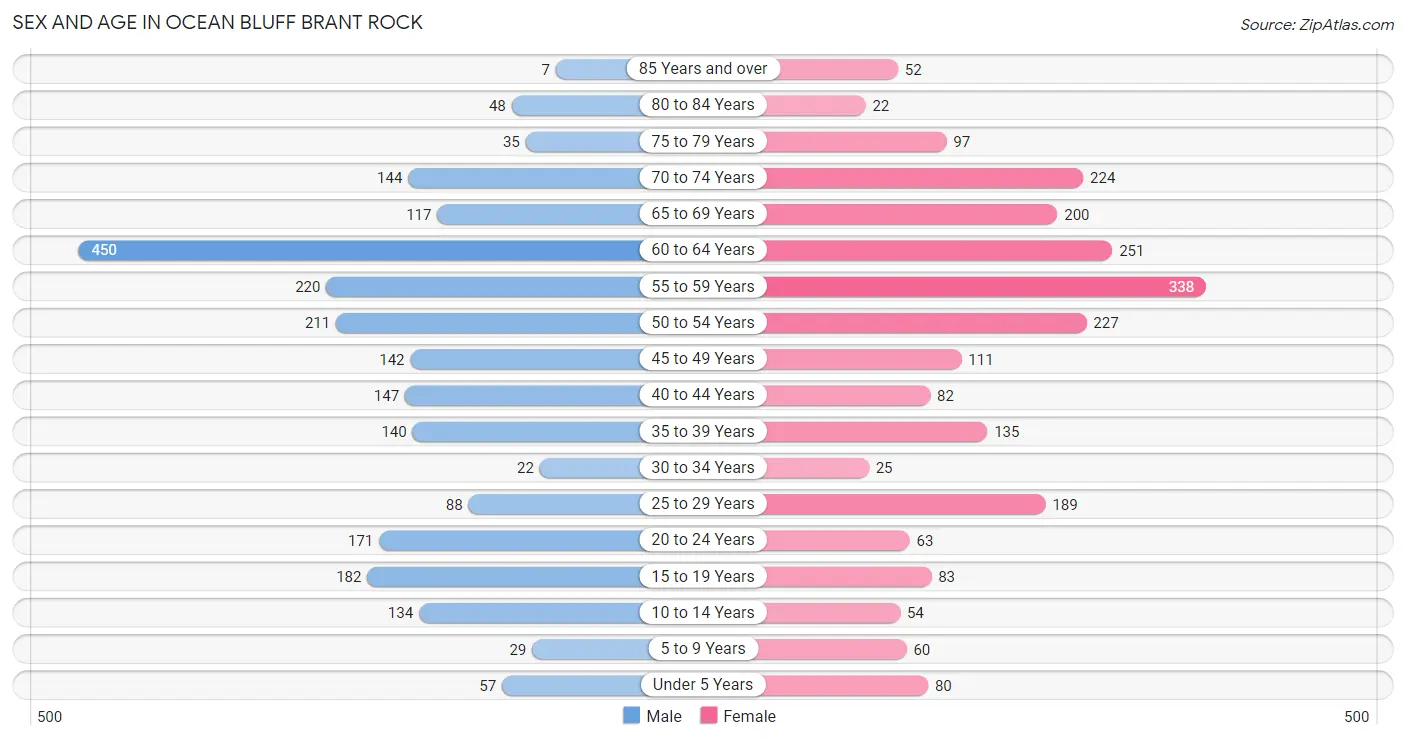
The most populous age groups in Ocean Bluff Brant Rock are 60 to 64 Years (450 | 19.2%) for men and 55 to 59 Years (338 | 14.7%) for women.
| Age Bracket | Male | Female |
| Under 5 Years | 57 (2.4%) | 80 (3.5%) |
| 5 to 9 Years | 29 (1.2%) | 60 (2.6%) |
| 10 to 14 Years | 134 (5.7%) | 54 (2.4%) |
| 15 to 19 Years | 182 (7.8%) | 83 (3.6%) |
| 20 to 24 Years | 171 (7.3%) | 63 (2.8%) |
| 25 to 29 Years | 88 (3.7%) | 189 (8.2%) |
| 30 to 34 Years | 22 (0.9%) | 25 (1.1%) |
| 35 to 39 Years | 140 (6.0%) | 135 (5.9%) |
| 40 to 44 Years | 147 (6.3%) | 82 (3.6%) |
| 45 to 49 Years | 142 (6.1%) | 111 (4.8%) |
| 50 to 54 Years | 211 (9.0%) | 227 (9.9%) |
| 55 to 59 Years | 220 (9.4%) | 338 (14.7%) |
| 60 to 64 Years | 450 (19.2%) | 251 (11.0%) |
| 65 to 69 Years | 117 (5.0%) | 200 (8.7%) |
| 70 to 74 Years | 144 (6.1%) | 224 (9.8%) |
| 75 to 79 Years | 35 (1.5%) | 97 (4.2%) |
| 80 to 84 Years | 48 (2.1%) | 22 (1.0%) |
| 85 Years and over | 7 (0.3%) | 52 (2.3%) |
| Total | 2,344 (100.0%) | 2,293 (100.0%) |
Families and Households in Ocean Bluff Brant Rock
Median Family Size in Ocean Bluff Brant Rock
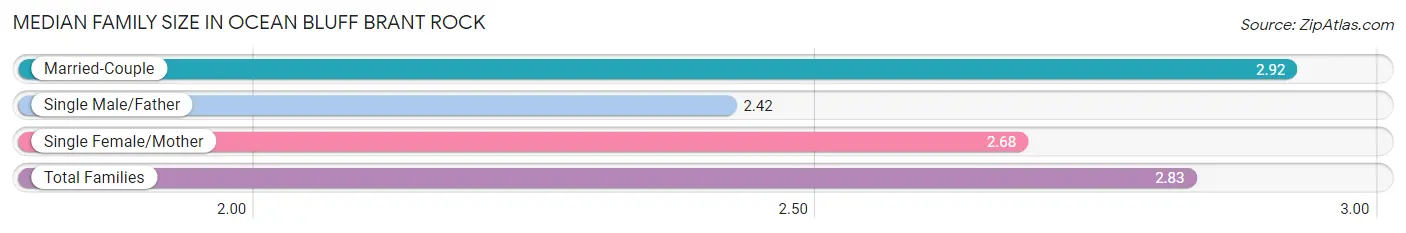
The median family size in Ocean Bluff Brant Rock is 2.83 persons per family, with married-couple families (905 | 68.1%) accounting for the largest median family size of 2.92 persons per family. On the other hand, single male/father families (73 | 5.5%) represent the smallest median family size with 2.42 persons per family.
| Family Type | # Families | Family Size |
| Married-Couple | 905 (68.1%) | 2.92 |
| Single Male/Father | 73 (5.5%) | 2.42 |
| Single Female/Mother | 351 (26.4%) | 2.68 |
| Total Families | 1,329 (100.0%) | 2.83 |
Median Household Size in Ocean Bluff Brant Rock
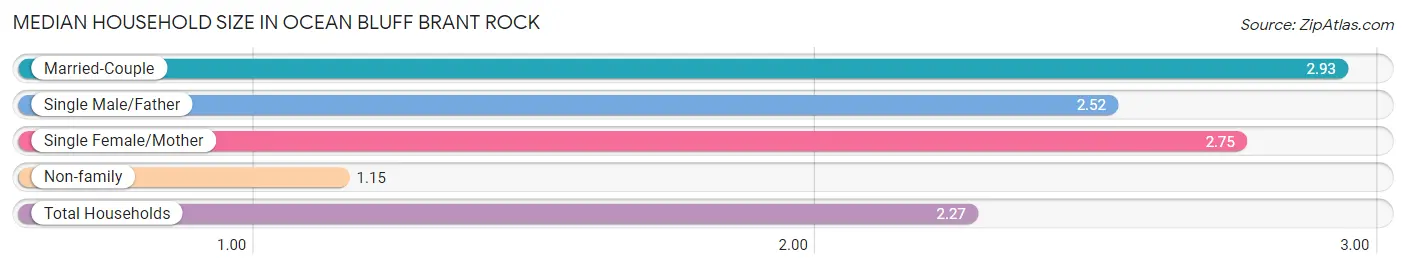
The median household size in Ocean Bluff Brant Rock is 2.27 persons per household, with married-couple households (905 | 44.5%) accounting for the largest median household size of 2.93 persons per household. non-family households (703 | 34.6%) represent the smallest median household size with 1.15 persons per household.
| Household Type | # Households | Household Size |
| Married-Couple | 905 (44.5%) | 2.93 |
| Single Male/Father | 73 (3.6%) | 2.52 |
| Single Female/Mother | 351 (17.3%) | 2.75 |
| Non-family | 703 (34.6%) | 1.15 |
| Total Households | 2,032 (100.0%) | 2.27 |
Household Size by Marriage Status in Ocean Bluff Brant Rock
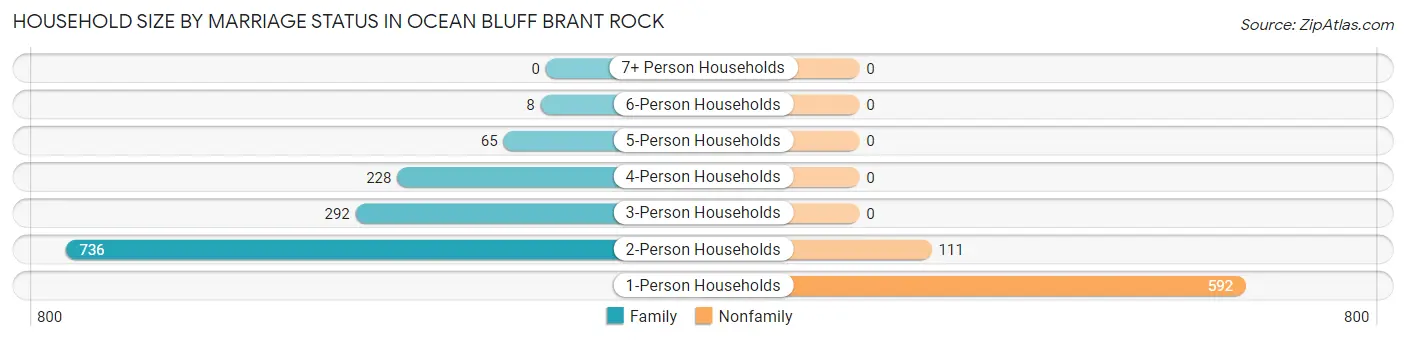
Out of a total of 2,032 households in Ocean Bluff Brant Rock, 1,329 (65.4%) are family households, while 703 (34.6%) are nonfamily households. The most numerous type of family households are 2-person households, comprising 736, and the most common type of nonfamily households are 1-person households, comprising 592.
| Household Size | Family Households | Nonfamily Households |
| 1-Person Households | - | 592 (29.1%) |
| 2-Person Households | 736 (36.2%) | 111 (5.5%) |
| 3-Person Households | 292 (14.4%) | 0 (0.0%) |
| 4-Person Households | 228 (11.2%) | 0 (0.0%) |
| 5-Person Households | 65 (3.2%) | 0 (0.0%) |
| 6-Person Households | 8 (0.4%) | 0 (0.0%) |
| 7+ Person Households | 0 (0.0%) | 0 (0.0%) |
| Total | 1,329 (65.4%) | 703 (34.6%) |
Female Fertility in Ocean Bluff Brant Rock
Fertility by Age in Ocean Bluff Brant Rock
Average fertility rate in Ocean Bluff Brant Rock is 29.0 births per 1,000 women. Women in the age bracket of 20 to 34 years have the highest fertility rate with 36.0 births per 1,000 women. Women in the age bracket of 35 to 50 years acount for 54.5% of all women with births.
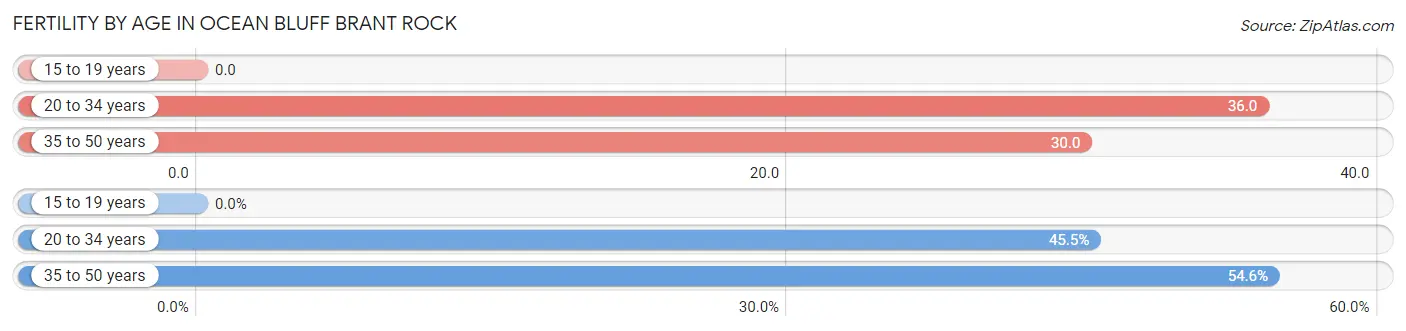
| Age Bracket | Women with Births | Births / 1,000 Women |
| 15 to 19 years | 0 (0.0%) | 0.0 |
| 20 to 34 years | 10 (45.5%) | 36.0 |
| 35 to 50 years | 12 (54.5%) | 30.0 |
| Total | 22 (100.0%) | 29.0 |
Fertility by Age by Marriage Status in Ocean Bluff Brant Rock
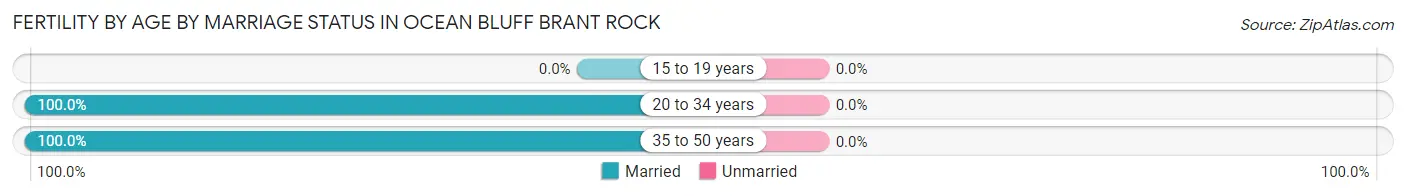
| Age Bracket | Married | Unmarried |
| 15 to 19 years | 0 (0.0%) | 0 (0.0%) |
| 20 to 34 years | 10 (100.0%) | 0 (0.0%) |
| 35 to 50 years | 12 (100.0%) | 0 (0.0%) |
| Total | 22 (100.0%) | 0 (0.0%) |
Fertility by Education in Ocean Bluff Brant Rock
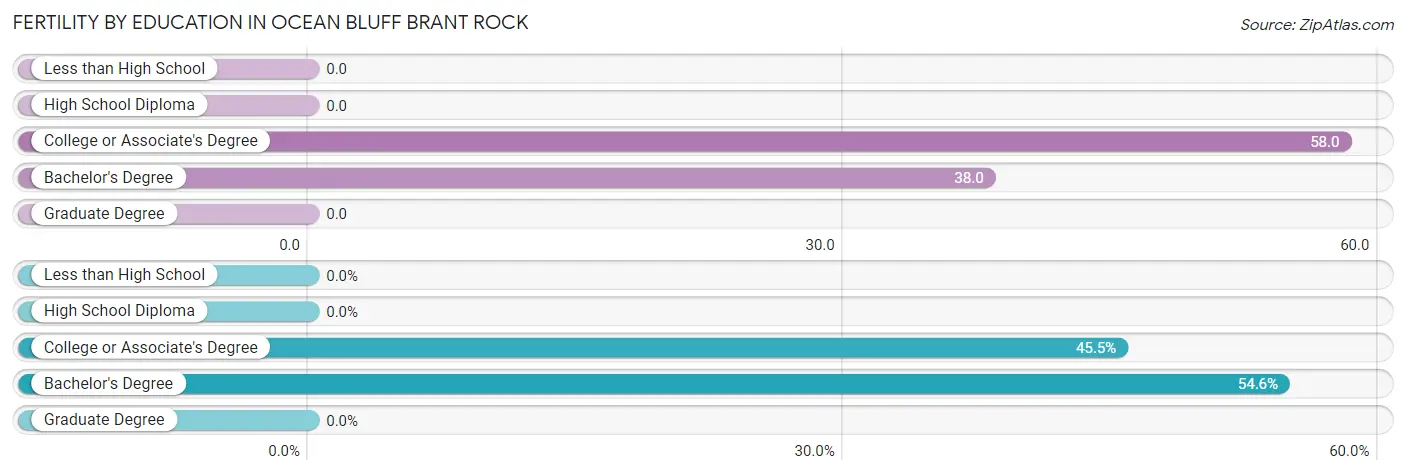
| Educational Attainment | Women with Births | Births / 1,000 Women |
| Less than High School | 0 (0.0%) | 0.0 |
| High School Diploma | 0 (0.0%) | 0.0 |
| College or Associate's Degree | 10 (45.5%) | 58.0 |
| Bachelor's Degree | 12 (54.5%) | 38.0 |
| Graduate Degree | 0 (0.0%) | 0.0 |
| Total | 22 (100.0%) | 29.0 |
Fertility by Education by Marriage Status in Ocean Bluff Brant Rock
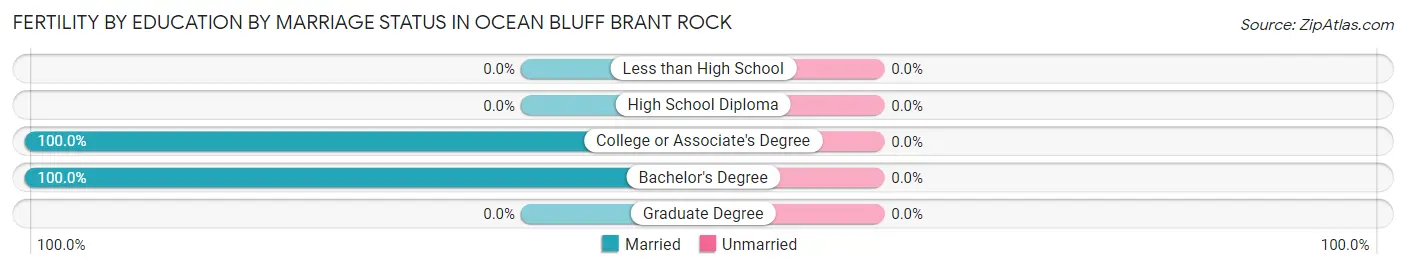
| Educational Attainment | Married | Unmarried |
| Less than High School | 0 (0.0%) | 0 (0.0%) |
| High School Diploma | 0 (0.0%) | 0 (0.0%) |
| College or Associate's Degree | 10 (100.0%) | 0 (0.0%) |
| Bachelor's Degree | 12 (100.0%) | 0 (0.0%) |
| Graduate Degree | 0 (0.0%) | 0 (0.0%) |
| Total | 22 (100.0%) | 0 (0.0%) |
Income in Ocean Bluff Brant Rock
Income Overview in Ocean Bluff Brant Rock
Per Capita Income in Ocean Bluff Brant Rock is $52,831, while median incomes of families and households are $130,156 and $106,528 respectively.
| Characteristic | Number | Measure |
| Per Capita Income | 4,637 | $52,831 |
| Median Family Income | 1,329 | $130,156 |
| Mean Family Income | 1,329 | $142,322 |
| Median Household Income | 2,032 | $106,528 |
| Mean Household Income | 2,032 | $117,255 |
| Income Deficit | 1,329 | $0 |
| Wage / Income Gap (%) | 4,637 | 7.78% |
| Wage / Income Gap ($) | 4,637 | 92.22¢ per $1 |
| Gini / Inequality Index | 4,637 | 0.42 |
Earnings by Sex in Ocean Bluff Brant Rock
Average Earnings in Ocean Bluff Brant Rock are $55,941, $58,144 for men and $53,622 for women, a difference of 7.8%.
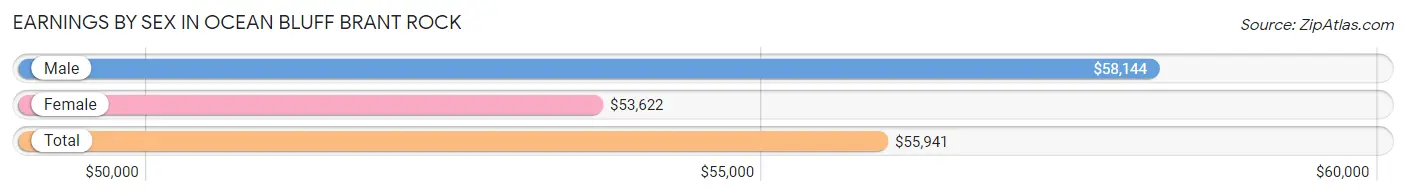
| Sex | Number | Average Earnings |
| Male | 1,558 (53.8%) | $58,144 |
| Female | 1,337 (46.2%) | $53,622 |
| Total | 2,895 (100.0%) | $55,941 |
Earnings by Sex by Income Bracket in Ocean Bluff Brant Rock
The most common earnings brackets in Ocean Bluff Brant Rock are $55,000 to $64,999 for men (371 | 23.8%) and $100,000+ for women (341 | 25.5%).
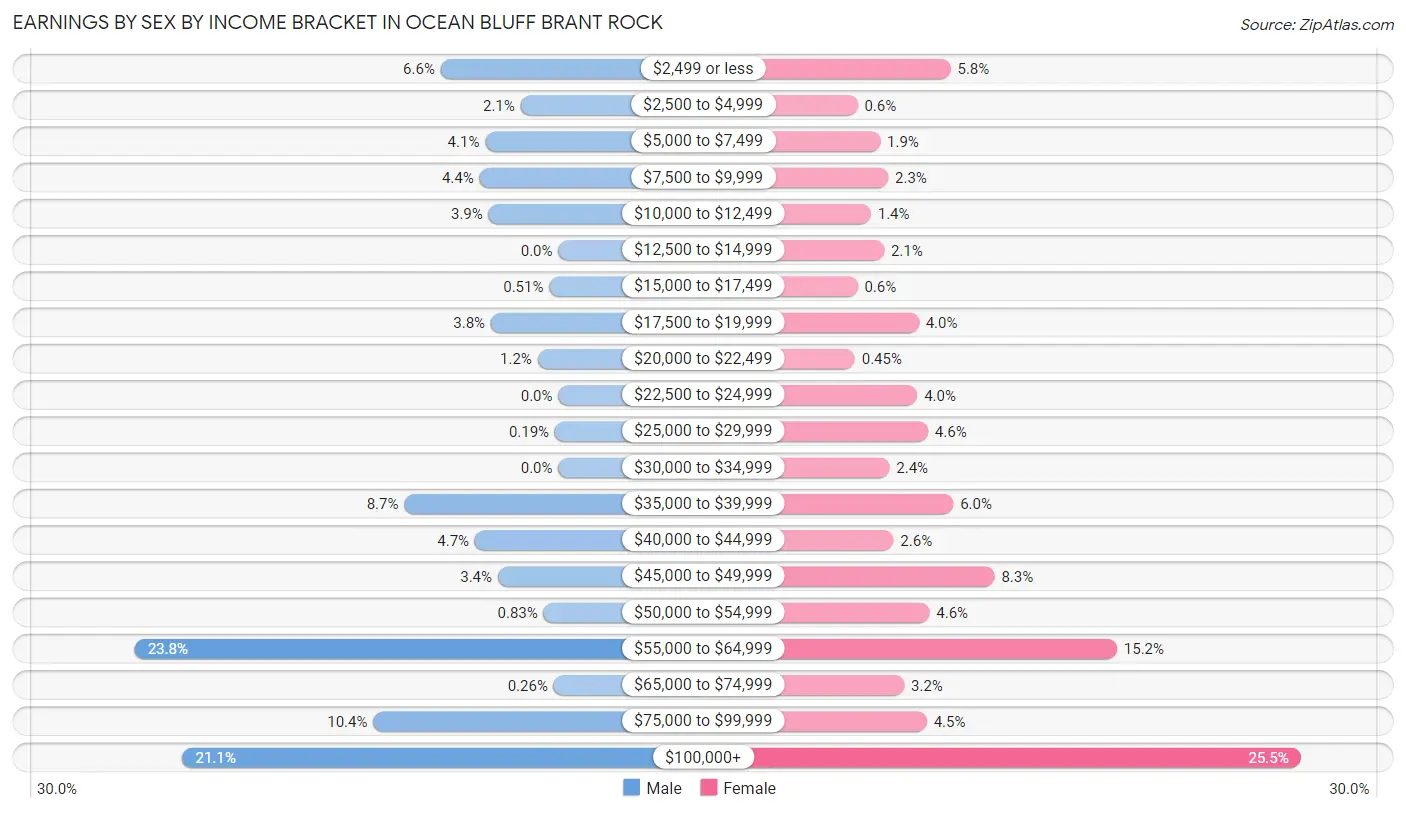
| Income | Male | Female |
| $2,499 or less | 103 (6.6%) | 78 (5.8%) |
| $2,500 to $4,999 | 33 (2.1%) | 8 (0.6%) |
| $5,000 to $7,499 | 64 (4.1%) | 25 (1.9%) |
| $7,500 to $9,999 | 69 (4.4%) | 31 (2.3%) |
| $10,000 to $12,499 | 61 (3.9%) | 18 (1.3%) |
| $12,500 to $14,999 | 0 (0.0%) | 28 (2.1%) |
| $15,000 to $17,499 | 8 (0.5%) | 8 (0.6%) |
| $17,500 to $19,999 | 59 (3.8%) | 54 (4.0%) |
| $20,000 to $22,499 | 18 (1.2%) | 6 (0.4%) |
| $22,500 to $24,999 | 0 (0.0%) | 53 (4.0%) |
| $25,000 to $29,999 | 3 (0.2%) | 61 (4.6%) |
| $30,000 to $34,999 | 0 (0.0%) | 32 (2.4%) |
| $35,000 to $39,999 | 135 (8.7%) | 80 (6.0%) |
| $40,000 to $44,999 | 73 (4.7%) | 35 (2.6%) |
| $45,000 to $49,999 | 53 (3.4%) | 111 (8.3%) |
| $50,000 to $54,999 | 13 (0.8%) | 62 (4.6%) |
| $55,000 to $64,999 | 371 (23.8%) | 203 (15.2%) |
| $65,000 to $74,999 | 4 (0.3%) | 43 (3.2%) |
| $75,000 to $99,999 | 162 (10.4%) | 60 (4.5%) |
| $100,000+ | 329 (21.1%) | 341 (25.5%) |
| Total | 1,558 (100.0%) | 1,337 (100.0%) |
Earnings by Sex by Educational Attainment in Ocean Bluff Brant Rock
Average earnings in Ocean Bluff Brant Rock are $62,696 for men and $55,565 for women, a difference of 11.4%. Men with an educational attainment of bachelor's degree enjoy the highest average annual earnings of $87,045, while those with graduate degree education earn the least with $55,329. Women with an educational attainment of bachelor's degree earn the most with the average annual earnings of $47,159, while those with high school diploma education have the smallest earnings of $41,071.
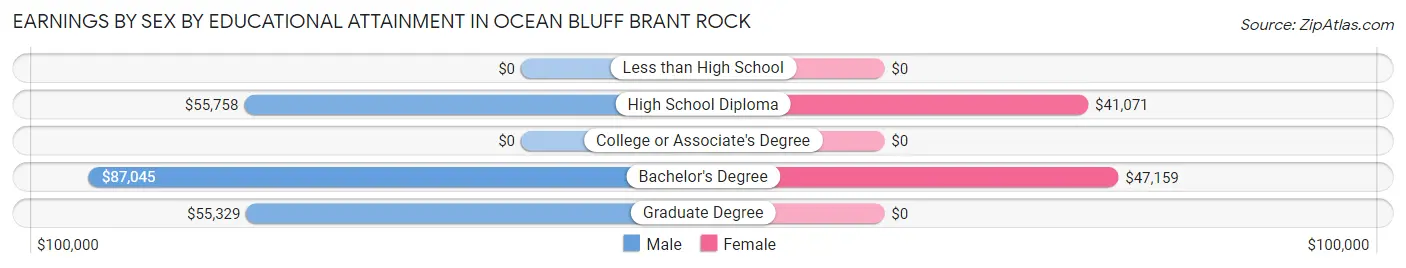
| Educational Attainment | Male Income | Female Income |
| Less than High School | - | - |
| High School Diploma | $55,758 | $41,071 |
| College or Associate's Degree | - | - |
| Bachelor's Degree | $87,045 | $47,159 |
| Graduate Degree | $55,329 | $0 |
| Total | $62,696 | $55,565 |
Family Income in Ocean Bluff Brant Rock
Family Income Brackets in Ocean Bluff Brant Rock
According to the Ocean Bluff Brant Rock family income data, there are 324 families falling into the $150,000 to $199,999 income range, which is the most common income bracket and makes up 24.4% of all families. Conversely, the $25,000 to $34,999 income bracket is the least frequent group with only 8 families (0.6%) belonging to this category.
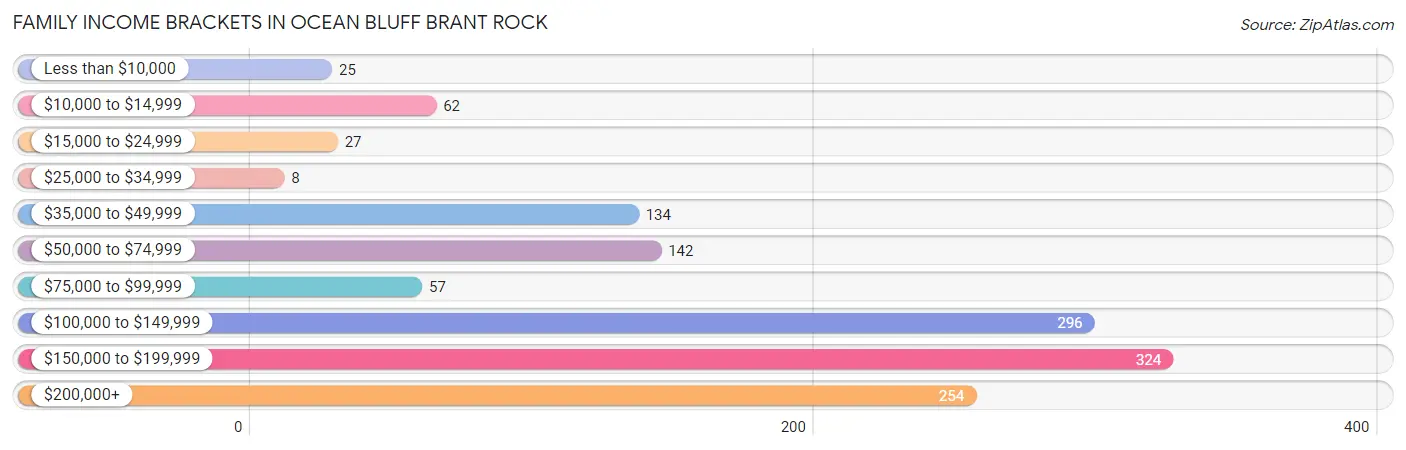
| Income Bracket | # Families | % Families |
| Less than $10,000 | 25 | 1.9% |
| $10,000 to $14,999 | 62 | 4.7% |
| $15,000 to $24,999 | 27 | 2.0% |
| $25,000 to $34,999 | 8 | 0.6% |
| $35,000 to $49,999 | 134 | 10.1% |
| $50,000 to $74,999 | 142 | 10.7% |
| $75,000 to $99,999 | 57 | 4.3% |
| $100,000 to $149,999 | 296 | 22.3% |
| $150,000 to $199,999 | 324 | 24.4% |
| $200,000+ | 254 | 19.1% |
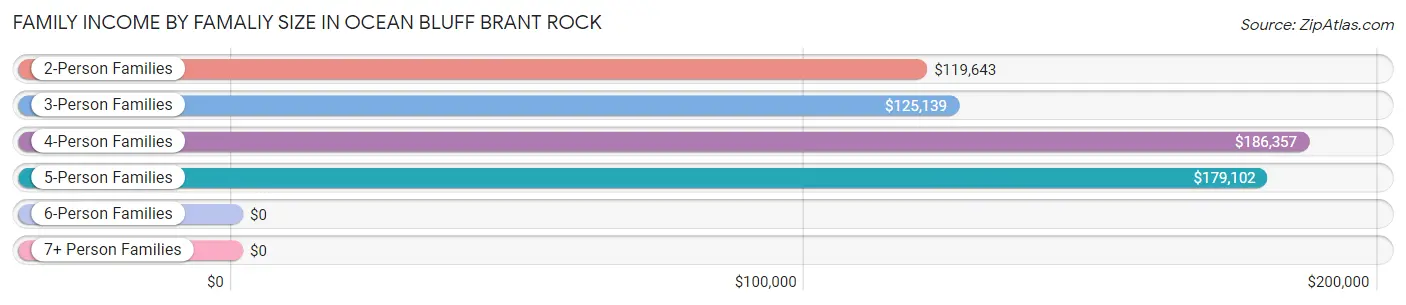
Family Income by Famaliy Size in Ocean Bluff Brant Rock
4-person families (196 | 14.7%) account for the highest median family income in Ocean Bluff Brant Rock with $186,357 per family, while 2-person families (736 | 55.4%) have the highest median income of $59,822 per family member.
| Income Bracket | # Families | Median Income |
| 2-Person Families | 736 (55.4%) | $119,643 |
| 3-Person Families | 324 (24.4%) | $125,139 |
| 4-Person Families | 196 (14.7%) | $186,357 |
| 5-Person Families | 73 (5.5%) | $179,102 |
| 6-Person Families | 0 (0.0%) | $0 |
| 7+ Person Families | 0 (0.0%) | $0 |
| Total | 1,329 (100.0%) | $130,156 |
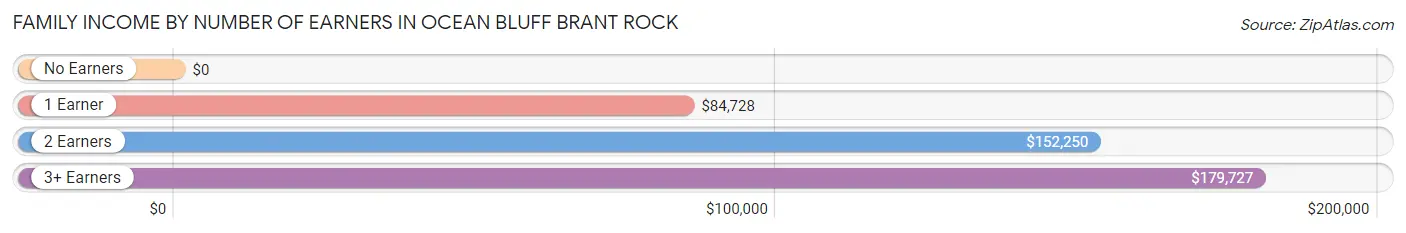
Family Income by Number of Earners in Ocean Bluff Brant Rock
| Number of Earners | # Families | Median Income |
| No Earners | 131 (9.9%) | $0 |
| 1 Earner | 389 (29.3%) | $84,728 |
| 2 Earners | 596 (44.9%) | $152,250 |
| 3+ Earners | 213 (16.0%) | $179,727 |
| Total | 1,329 (100.0%) | $130,156 |
Household Income in Ocean Bluff Brant Rock
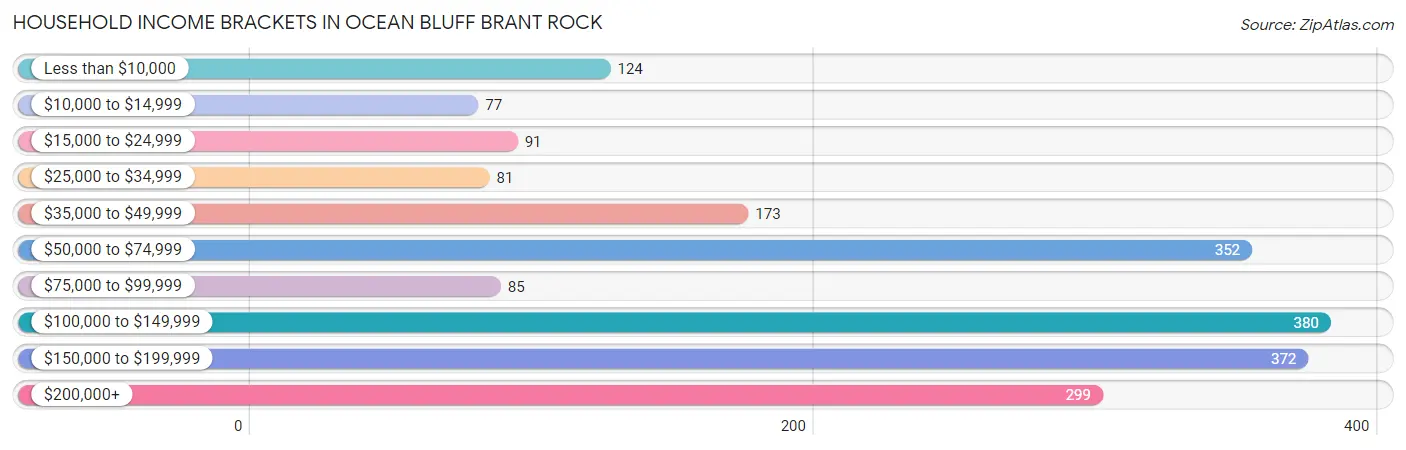
Household Income Brackets in Ocean Bluff Brant Rock
With 380 households falling in the category, the $100,000 to $149,999 income range is the most frequent in Ocean Bluff Brant Rock, accounting for 18.7% of all households. In contrast, only 77 households (3.8%) fall into the $10,000 to $14,999 income bracket, making it the least populous group.
| Income Bracket | # Households | % Households |
| Less than $10,000 | 124 | 6.1% |
| $10,000 to $14,999 | 77 | 3.8% |
| $15,000 to $24,999 | 91 | 4.5% |
| $25,000 to $34,999 | 81 | 4.0% |
| $35,000 to $49,999 | 173 | 8.5% |
| $50,000 to $74,999 | 352 | 17.3% |
| $75,000 to $99,999 | 85 | 4.2% |
| $100,000 to $149,999 | 380 | 18.7% |
| $150,000 to $199,999 | 372 | 18.3% |
| $200,000+ | 299 | 14.7% |
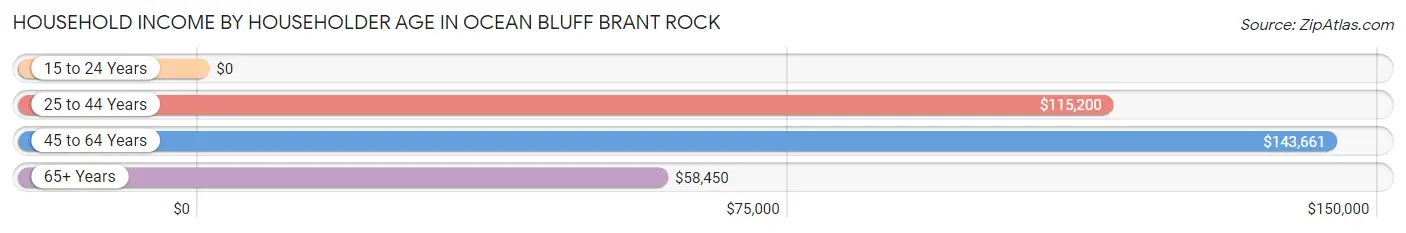
Household Income by Householder Age in Ocean Bluff Brant Rock
The median household income in Ocean Bluff Brant Rock is $106,528, with the highest median household income of $143,661 found in the 45 to 64 years age bracket for the primary householder. A total of 1,079 households (53.1%) fall into this category.
| Income Bracket | # Households | Median Income |
| 15 to 24 Years | 0 (0.0%) | $0 |
| 25 to 44 Years | 268 (13.2%) | $115,200 |
| 45 to 64 Years | 1,079 (53.1%) | $143,661 |
| 65+ Years | 685 (33.7%) | $58,450 |
| Total | 2,032 (100.0%) | $106,528 |
Poverty in Ocean Bluff Brant Rock
Income Below Poverty by Sex and Age in Ocean Bluff Brant Rock
With 10.9% poverty level for males and 6.9% for females among the residents of Ocean Bluff Brant Rock, 75 year old and over males and 45 to 54 year old females are the most vulnerable to poverty, with 49 males (54.4%) and 107 females (31.7%) in their respective age groups living below the poverty level.
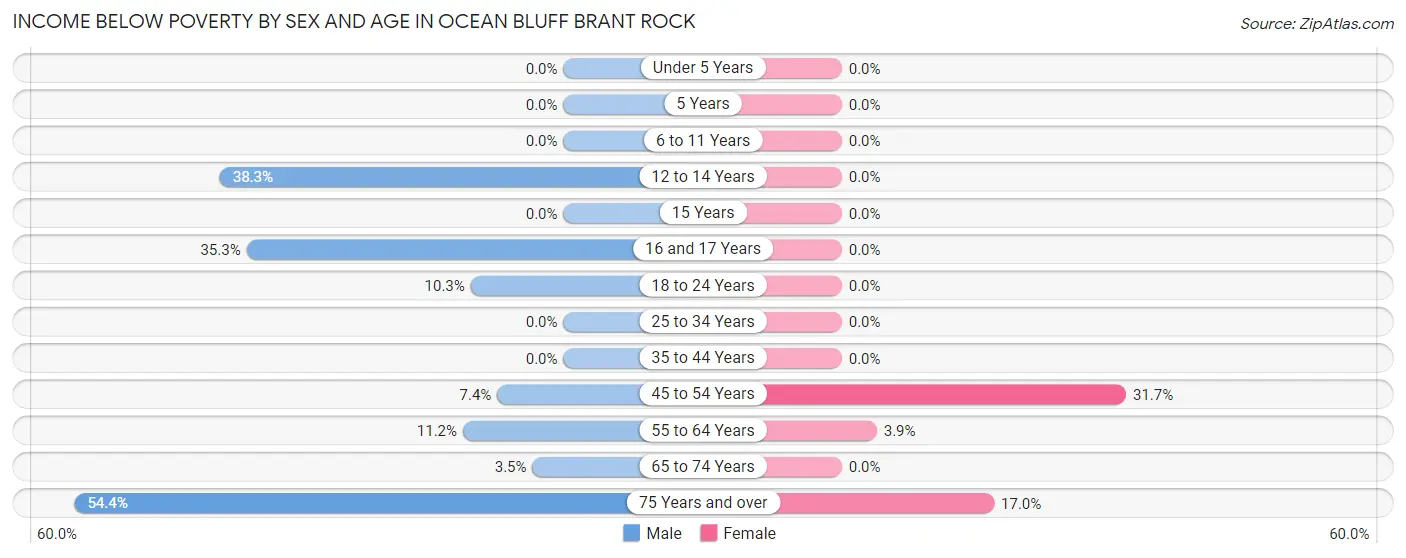
| Age Bracket | Male | Female |
| Under 5 Years | 0 (0.0%) | 0 (0.0%) |
| 5 Years | 0 (0.0%) | 0 (0.0%) |
| 6 to 11 Years | 0 (0.0%) | 0 (0.0%) |
| 12 to 14 Years | 44 (38.3%) | 0 (0.0%) |
| 15 Years | 0 (0.0%) | 0 (0.0%) |
| 16 and 17 Years | 24 (35.3%) | 0 (0.0%) |
| 18 to 24 Years | 28 (10.3%) | 0 (0.0%) |
| 25 to 34 Years | 0 (0.0%) | 0 (0.0%) |
| 35 to 44 Years | 0 (0.0%) | 0 (0.0%) |
| 45 to 54 Years | 26 (7.4%) | 107 (31.7%) |
| 55 to 64 Years | 75 (11.2%) | 23 (3.9%) |
| 65 to 74 Years | 9 (3.5%) | 0 (0.0%) |
| 75 Years and over | 49 (54.4%) | 29 (17.0%) |
| Total | 255 (10.9%) | 159 (6.9%) |
Income Above Poverty by Sex and Age in Ocean Bluff Brant Rock
According to the poverty statistics in Ocean Bluff Brant Rock, males aged under 5 years and females aged under 5 years are the age groups that are most secure financially, with 100.0% of males and 100.0% of females in these age groups living above the poverty line.
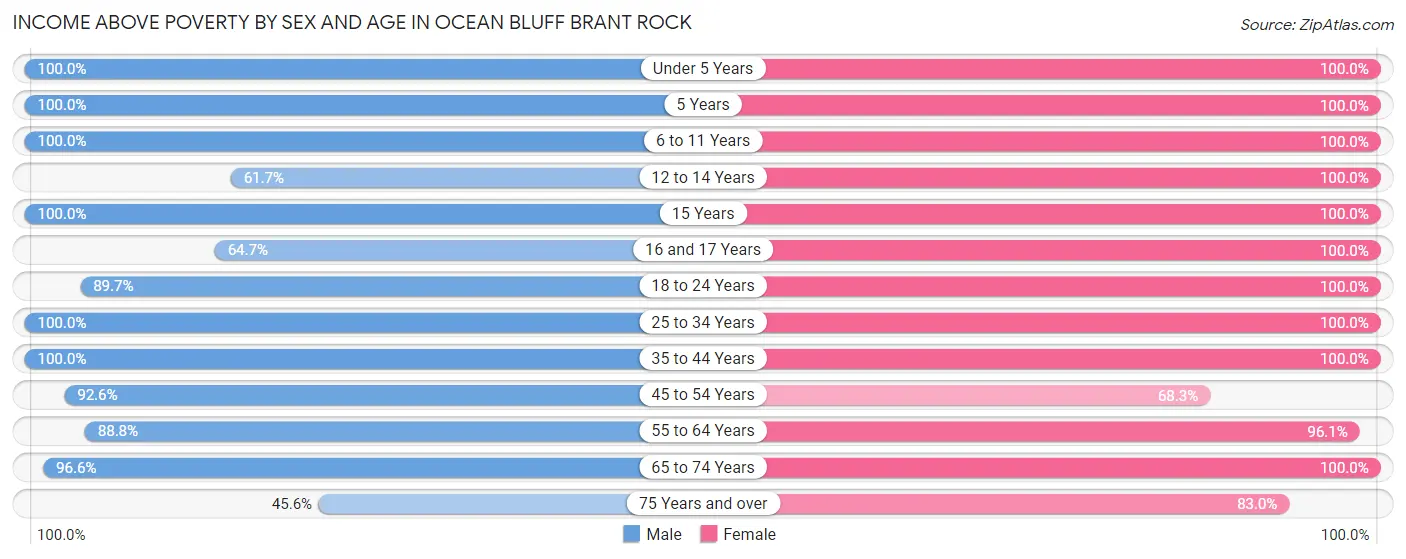
| Age Bracket | Male | Female |
| Under 5 Years | 48 (100.0%) | 80 (100.0%) |
| 5 Years | 29 (100.0%) | 12 (100.0%) |
| 6 to 11 Years | 19 (100.0%) | 69 (100.0%) |
| 12 to 14 Years | 71 (61.7%) | 33 (100.0%) |
| 15 Years | 14 (100.0%) | 8 (100.0%) |
| 16 and 17 Years | 44 (64.7%) | 28 (100.0%) |
| 18 to 24 Years | 243 (89.7%) | 110 (100.0%) |
| 25 to 34 Years | 110 (100.0%) | 214 (100.0%) |
| 35 to 44 Years | 287 (100.0%) | 217 (100.0%) |
| 45 to 54 Years | 327 (92.6%) | 231 (68.3%) |
| 55 to 64 Years | 595 (88.8%) | 566 (96.1%) |
| 65 to 74 Years | 252 (96.6%) | 424 (100.0%) |
| 75 Years and over | 41 (45.6%) | 142 (83.0%) |
| Total | 2,080 (89.1%) | 2,134 (93.1%) |
Income Below Poverty Among Married-Couple Families in Ocean Bluff Brant Rock
The poverty statistics for married-couple families in Ocean Bluff Brant Rock show that 6.1% or 55 of the total 905 families live below the poverty line. Families with no children have the highest poverty rate of 8.2%, comprising of 55 families. On the other hand, families with 1 or 2 children have the lowest poverty rate of 0.0%, which includes 0 families.
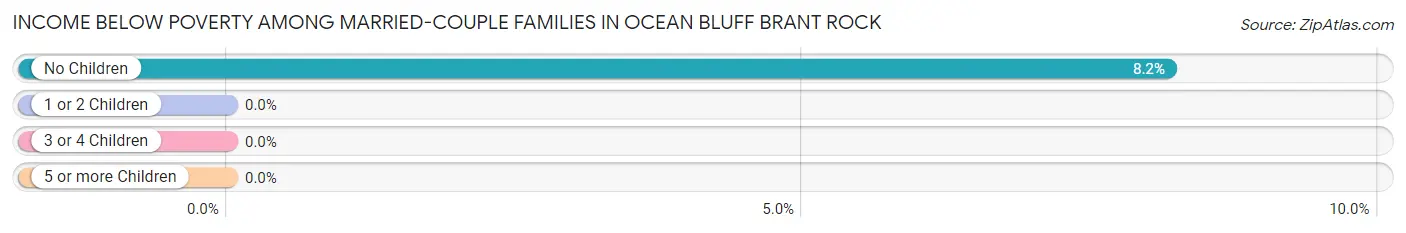
| Children | Above Poverty | Below Poverty |
| No Children | 618 (91.8%) | 55 (8.2%) |
| 1 or 2 Children | 201 (100.0%) | 0 (0.0%) |
| 3 or 4 Children | 31 (100.0%) | 0 (0.0%) |
| 5 or more Children | 0 (0.0%) | 0 (0.0%) |
| Total | 850 (93.9%) | 55 (6.1%) |
Income Below Poverty Among Single-Parent Households in Ocean Bluff Brant Rock
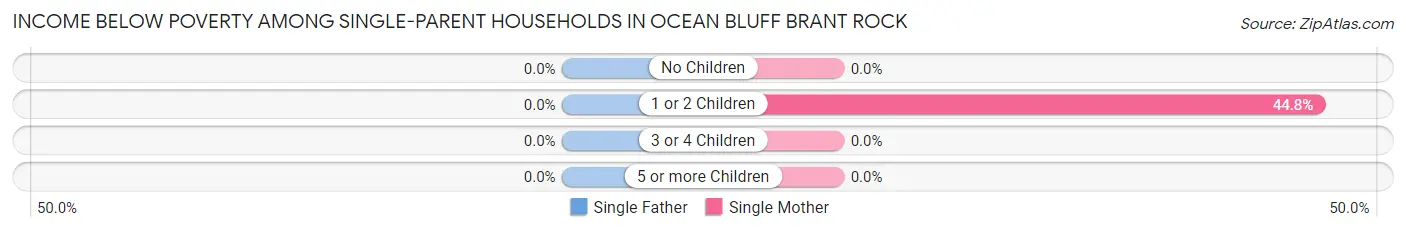
| Children | Single Father | Single Mother |
| No Children | 0 (0.0%) | 0 (0.0%) |
| 1 or 2 Children | 0 (0.0%) | 39 (44.8%) |
| 3 or 4 Children | 0 (0.0%) | 0 (0.0%) |
| 5 or more Children | 0 (0.0%) | 0 (0.0%) |
| Total | 0 (0.0%) | 39 (11.1%) |
Income Below Poverty Among Married-Couple vs Single-Parent Households in Ocean Bluff Brant Rock
The poverty data for Ocean Bluff Brant Rock shows that 55 of the married-couple family households (6.1%) and 39 of the single-parent households (9.2%) are living below the poverty level. Within the married-couple family households, those with no children have the highest poverty rate, with 55 households (8.2%) falling below the poverty line. Among the single-parent households, those with 1 or 2 children have the highest poverty rate, with 39 household (37.1%) living below poverty.
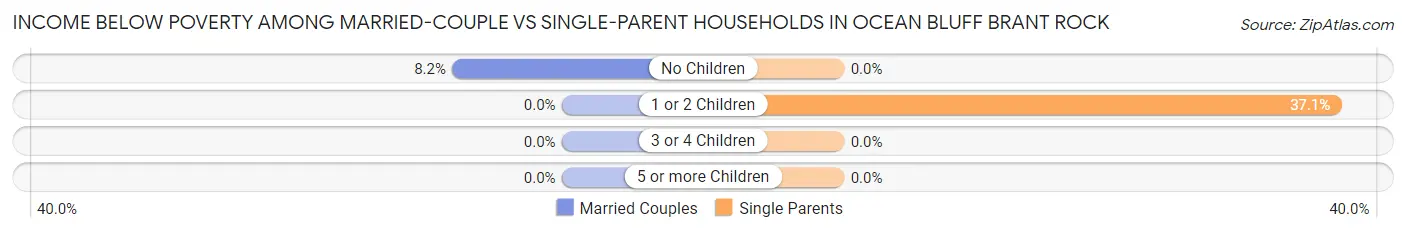
| Children | Married-Couple Families | Single-Parent Households |
| No Children | 55 (8.2%) | 0 (0.0%) |
| 1 or 2 Children | 0 (0.0%) | 39 (37.1%) |
| 3 or 4 Children | 0 (0.0%) | 0 (0.0%) |
| 5 or more Children | 0 (0.0%) | 0 (0.0%) |
| Total | 55 (6.1%) | 39 (9.2%) |
Employment Characteristics in Ocean Bluff Brant Rock
Employment by Class of Employer in Ocean Bluff Brant Rock
Among the 2,650 employed individuals in Ocean Bluff Brant Rock, private company employees (1,627 | 61.4%), state government employees (302 | 11.4%), and local government employees (216 | 8.2%) make up the most common classes of employment.
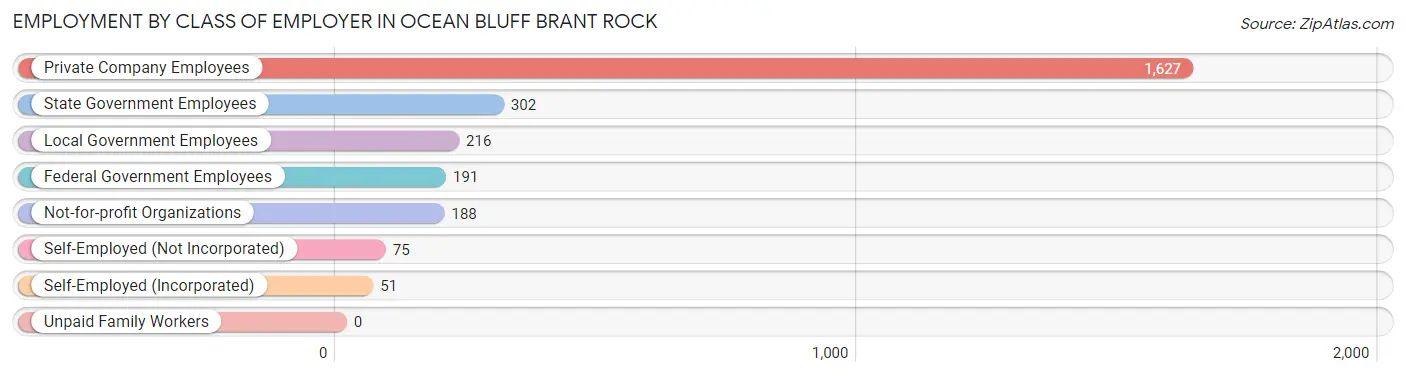
| Employer Class | # Employees | % Employees |
| Private Company Employees | 1,627 | 61.4% |
| Self-Employed (Incorporated) | 51 | 1.9% |
| Self-Employed (Not Incorporated) | 75 | 2.8% |
| Not-for-profit Organizations | 188 | 7.1% |
| Local Government Employees | 216 | 8.2% |
| State Government Employees | 302 | 11.4% |
| Federal Government Employees | 191 | 7.2% |
| Unpaid Family Workers | 0 | 0.0% |
| Total | 2,650 | 100.0% |
Employment Status by Age in Ocean Bluff Brant Rock
According to the labor force statistics for Ocean Bluff Brant Rock, out of the total population over 16 years of age (4,201), 67.3% or 2,827 individuals are in the labor force, with 6.3% or 178 of them unemployed. The age group with the highest labor force participation rate is 25 to 29 years, with 100.0% or 277 individuals in the labor force. Within the labor force, the 16 to 19 years age range has the highest percentage of unemployed individuals, with 43.3% or 42 of them being unemployed.
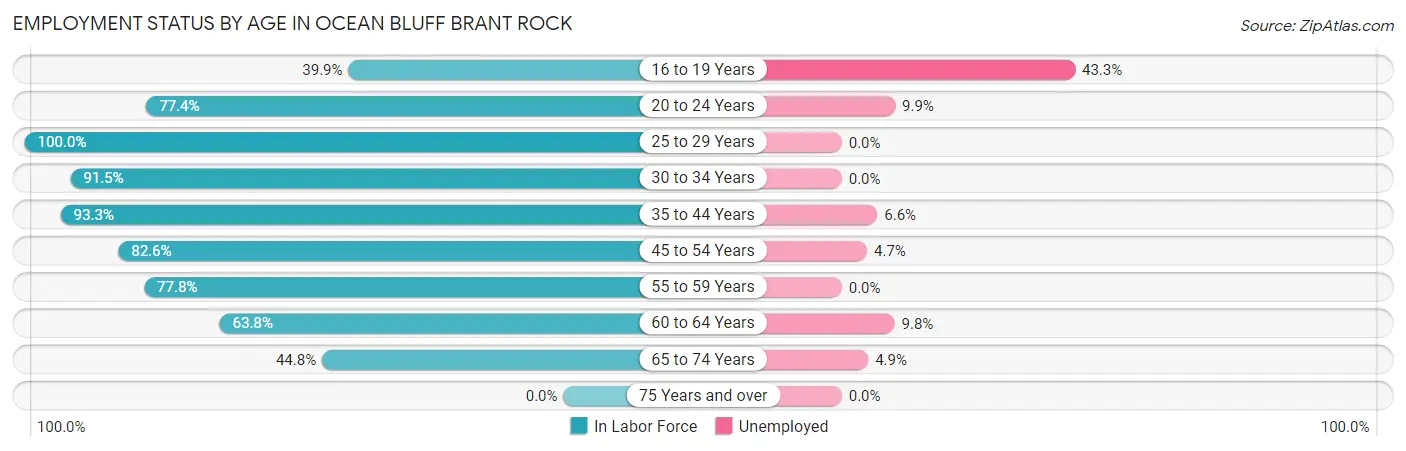
| Age Bracket | In Labor Force | Unemployed |
| 16 to 19 Years | 97 (39.9%) | 42 (43.3%) |
| 20 to 24 Years | 181 (77.4%) | 18 (9.9%) |
| 25 to 29 Years | 277 (100.0%) | 0 (0.0%) |
| 30 to 34 Years | 43 (91.5%) | 0 (0.0%) |
| 35 to 44 Years | 470 (93.3%) | 31 (6.6%) |
| 45 to 54 Years | 571 (82.6%) | 27 (4.7%) |
| 55 to 59 Years | 434 (77.8%) | 0 (0.0%) |
| 60 to 64 Years | 447 (63.8%) | 44 (9.8%) |
| 65 to 74 Years | 307 (44.8%) | 15 (4.9%) |
| 75 Years and over | 0 (0.0%) | 0 (0.0%) |
| Total | 2,827 (67.3%) | 178 (6.3%) |
Employment Status by Educational Attainment in Ocean Bluff Brant Rock
According to labor force statistics for Ocean Bluff Brant Rock, 80.7% of individuals (2,242) out of the total population between 25 and 64 years of age (2,778) are in the labor force, with 4.5% or 101 of them being unemployed. The group with the highest labor force participation rate are those with the educational attainment of less than high school, with 100.0% or 8 individuals in the labor force. Within the labor force, individuals with college / associate degree education have the highest percentage of unemployment, with 11.0% or 71 of them being unemployed.
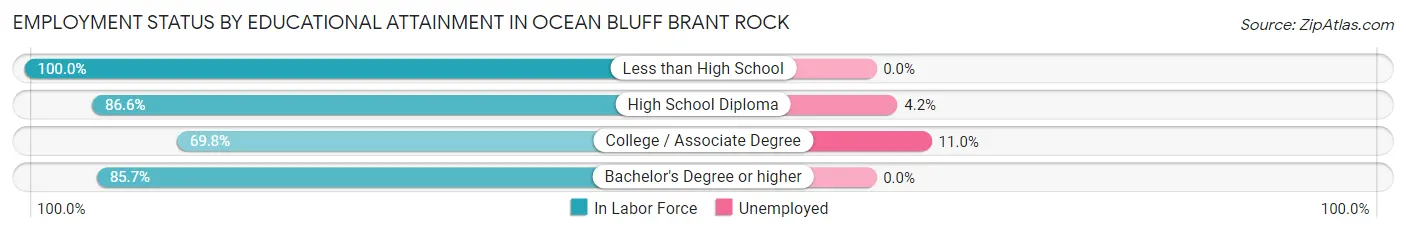
| Educational Attainment | In Labor Force | Unemployed |
| Less than High School | 8 (100.0%) | 0 (0.0%) |
| High School Diploma | 742 (86.6%) | 36 (4.2%) |
| College / Associate Degree | 648 (69.8%) | 102 (11.0%) |
| Bachelor's Degree or higher | 844 (85.7%) | 0 (0.0%) |
| Total | 2,242 (80.7%) | 125 (4.5%) |
Employment Occupations by Sex in Ocean Bluff Brant Rock
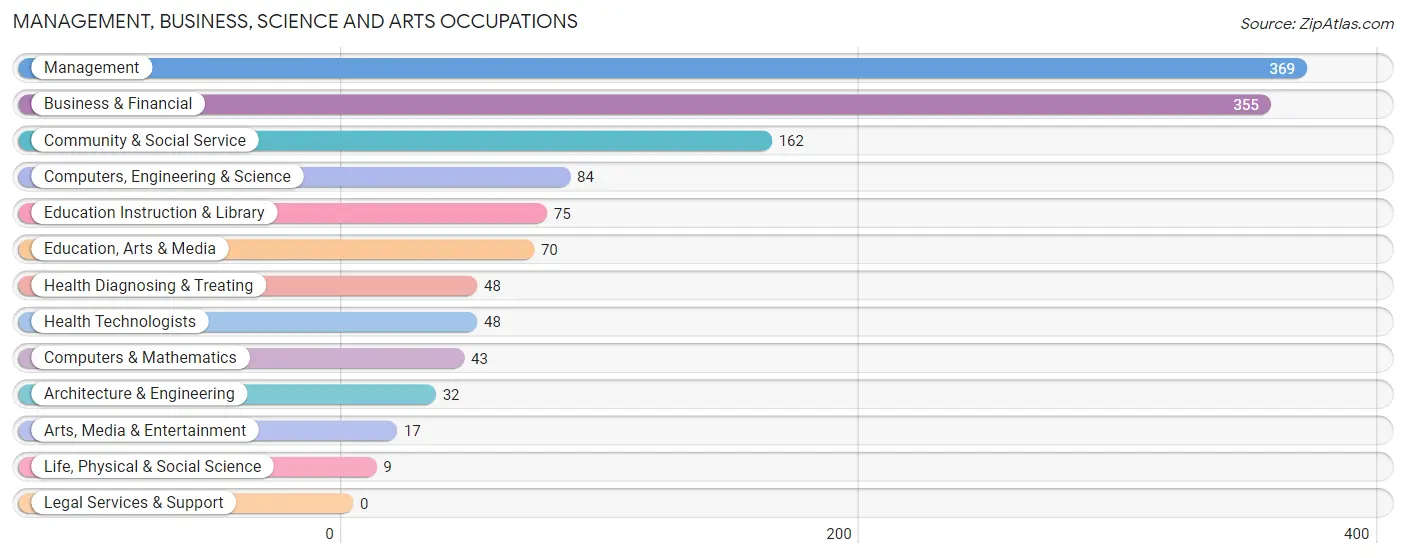
Management, Business, Science and Arts Occupations
The most common Management, Business, Science and Arts occupations in Ocean Bluff Brant Rock are Management (369 | 13.9%), Business & Financial (355 | 13.4%), Community & Social Service (162 | 6.1%), Computers, Engineering & Science (84 | 3.2%), and Education Instruction & Library (75 | 2.8%).
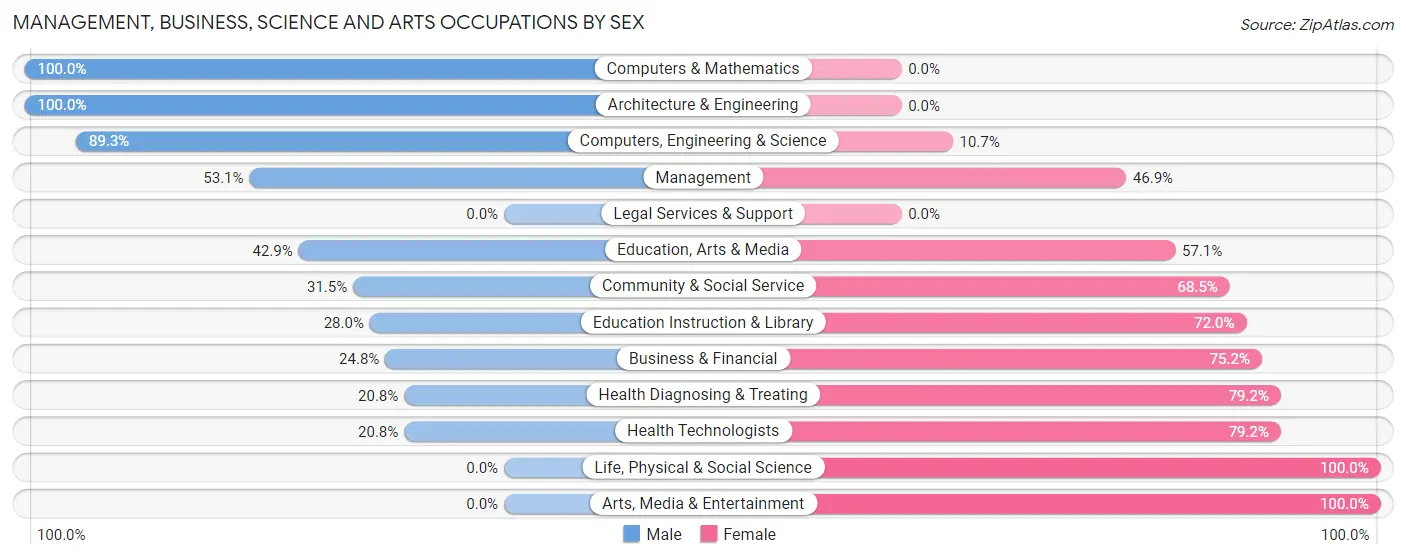
Management, Business, Science and Arts Occupations by Sex
Within the Management, Business, Science and Arts occupations in Ocean Bluff Brant Rock, the most male-oriented occupations are Computers & Mathematics (100.0%), Architecture & Engineering (100.0%), and Computers, Engineering & Science (89.3%), while the most female-oriented occupations are Life, Physical & Social Science (100.0%), Arts, Media & Entertainment (100.0%), and Health Diagnosing & Treating (79.2%).
| Occupation | Male | Female |
| Management | 196 (53.1%) | 173 (46.9%) |
| Business & Financial | 88 (24.8%) | 267 (75.2%) |
| Computers, Engineering & Science | 75 (89.3%) | 9 (10.7%) |
| Computers & Mathematics | 43 (100.0%) | 0 (0.0%) |
| Architecture & Engineering | 32 (100.0%) | 0 (0.0%) |
| Life, Physical & Social Science | 0 (0.0%) | 9 (100.0%) |
| Community & Social Service | 51 (31.5%) | 111 (68.5%) |
| Education, Arts & Media | 30 (42.9%) | 40 (57.1%) |
| Legal Services & Support | 0 (0.0%) | 0 (0.0%) |
| Education Instruction & Library | 21 (28.0%) | 54 (72.0%) |
| Arts, Media & Entertainment | 0 (0.0%) | 17 (100.0%) |
| Health Diagnosing & Treating | 10 (20.8%) | 38 (79.2%) |
| Health Technologists | 10 (20.8%) | 38 (79.2%) |
| Total (Category) | 420 (41.3%) | 598 (58.7%) |
| Total (Overall) | 1,423 (53.7%) | 1,227 (46.3%) |
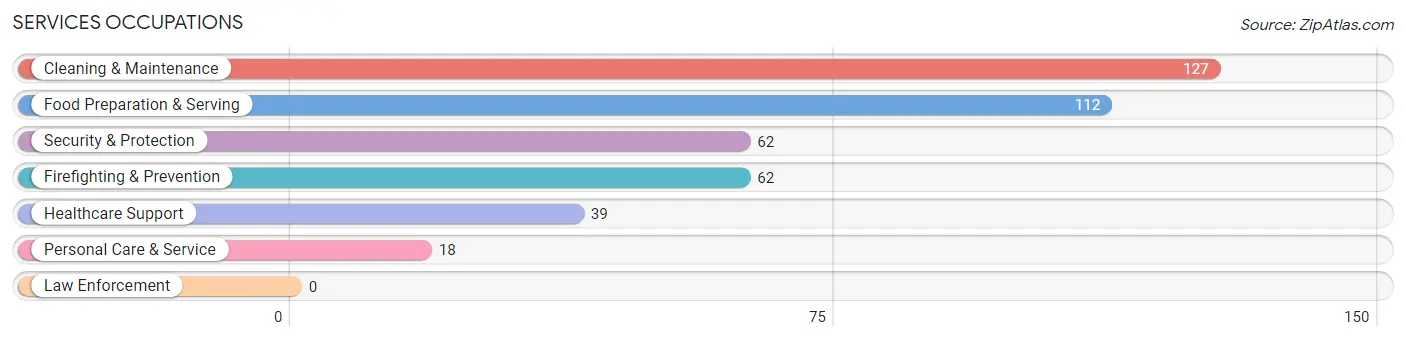
Services Occupations
The most common Services occupations in Ocean Bluff Brant Rock are Cleaning & Maintenance (127 | 4.8%), Food Preparation & Serving (112 | 4.2%), Security & Protection (62 | 2.3%), Firefighting & Prevention (62 | 2.3%), and Healthcare Support (39 | 1.5%).
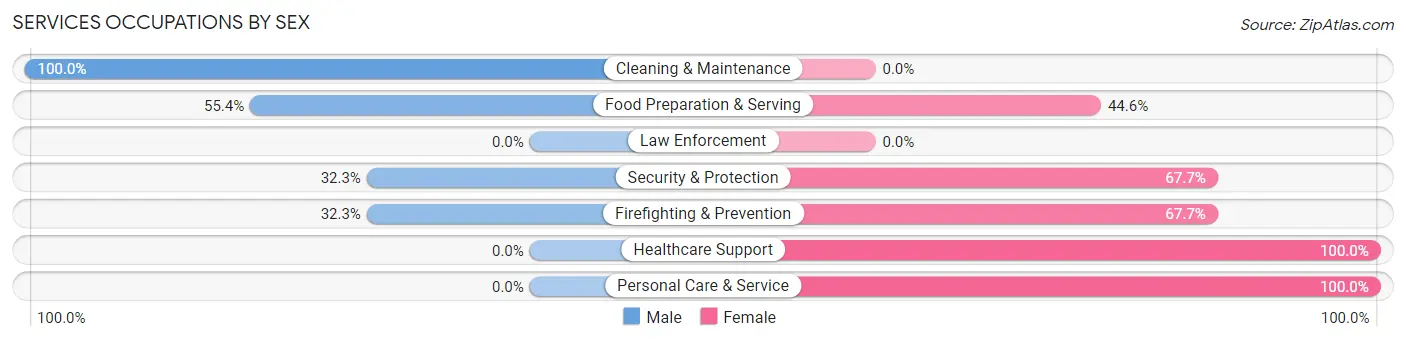
Services Occupations by Sex
Within the Services occupations in Ocean Bluff Brant Rock, the most male-oriented occupations are Cleaning & Maintenance (100.0%), Food Preparation & Serving (55.4%), and Security & Protection (32.3%), while the most female-oriented occupations are Healthcare Support (100.0%), Personal Care & Service (100.0%), and Security & Protection (67.7%).
| Occupation | Male | Female |
| Healthcare Support | 0 (0.0%) | 39 (100.0%) |
| Security & Protection | 20 (32.3%) | 42 (67.7%) |
| Firefighting & Prevention | 20 (32.3%) | 42 (67.7%) |
| Law Enforcement | 0 (0.0%) | 0 (0.0%) |
| Food Preparation & Serving | 62 (55.4%) | 50 (44.6%) |
| Cleaning & Maintenance | 127 (100.0%) | 0 (0.0%) |
| Personal Care & Service | 0 (0.0%) | 18 (100.0%) |
| Total (Category) | 209 (58.4%) | 149 (41.6%) |
| Total (Overall) | 1,423 (53.7%) | 1,227 (46.3%) |
Sales and Office Occupations
The most common Sales and Office occupations in Ocean Bluff Brant Rock are Office & Administration (482 | 18.2%), and Sales & Related (307 | 11.6%).
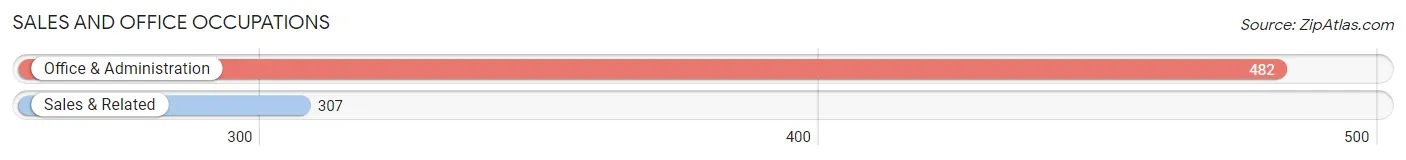
Sales and Office Occupations by Sex
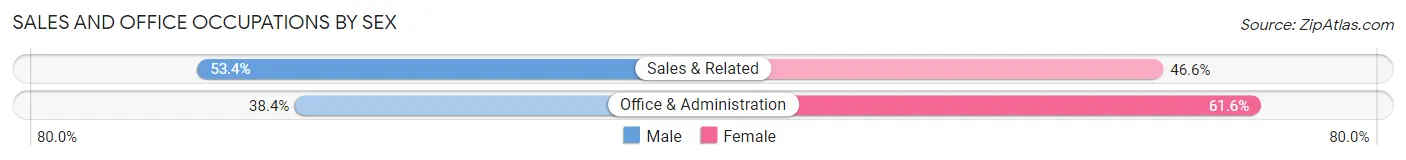
| Occupation | Male | Female |
| Sales & Related | 164 (53.4%) | 143 (46.6%) |
| Office & Administration | 185 (38.4%) | 297 (61.6%) |
| Total (Category) | 349 (44.2%) | 440 (55.8%) |
| Total (Overall) | 1,423 (53.7%) | 1,227 (46.3%) |
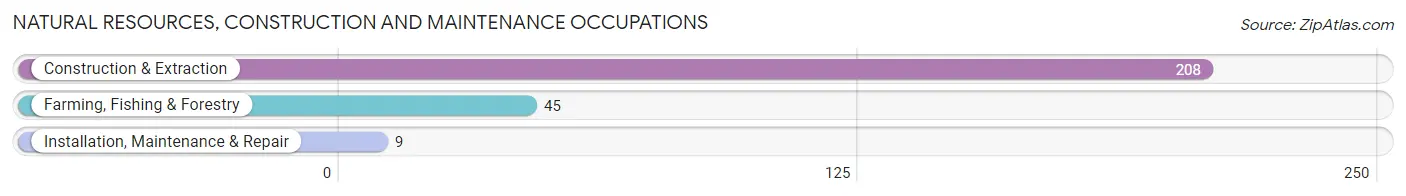
Natural Resources, Construction and Maintenance Occupations
The most common Natural Resources, Construction and Maintenance occupations in Ocean Bluff Brant Rock are Construction & Extraction (208 | 7.9%), Farming, Fishing & Forestry (45 | 1.7%), and Installation, Maintenance & Repair (9 | 0.3%).
Natural Resources, Construction and Maintenance Occupations by Sex
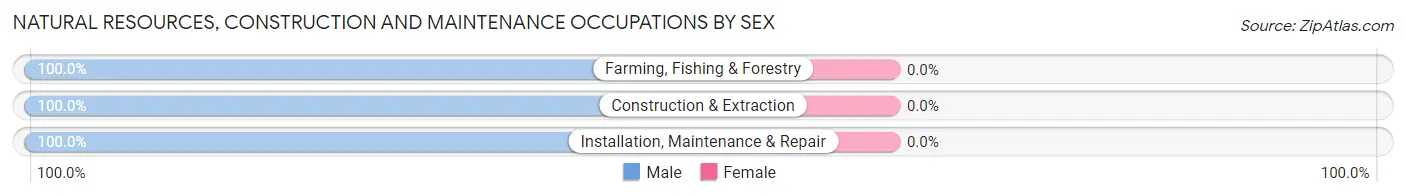
| Occupation | Male | Female |
| Farming, Fishing & Forestry | 45 (100.0%) | 0 (0.0%) |
| Construction & Extraction | 208 (100.0%) | 0 (0.0%) |
| Installation, Maintenance & Repair | 9 (100.0%) | 0 (0.0%) |
| Total (Category) | 262 (100.0%) | 0 (0.0%) |
| Total (Overall) | 1,423 (53.7%) | 1,227 (46.3%) |
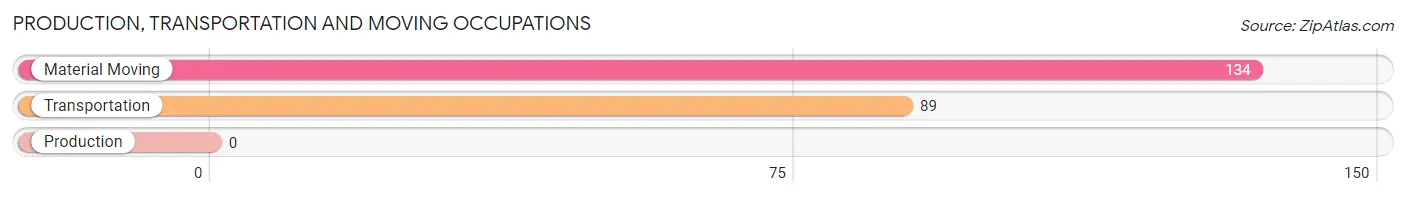
Production, Transportation and Moving Occupations
The most common Production, Transportation and Moving occupations in Ocean Bluff Brant Rock are Material Moving (134 | 5.1%), and Transportation (89 | 3.4%).
Production, Transportation and Moving Occupations by Sex
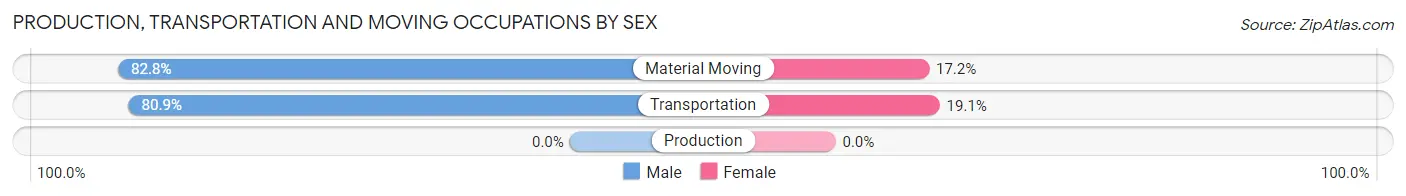
| Occupation | Male | Female |
| Production | 0 (0.0%) | 0 (0.0%) |
| Transportation | 72 (80.9%) | 17 (19.1%) |
| Material Moving | 111 (82.8%) | 23 (17.2%) |
| Total (Category) | 183 (82.1%) | 40 (17.9%) |
| Total (Overall) | 1,423 (53.7%) | 1,227 (46.3%) |
Employment Industries by Sex in Ocean Bluff Brant Rock
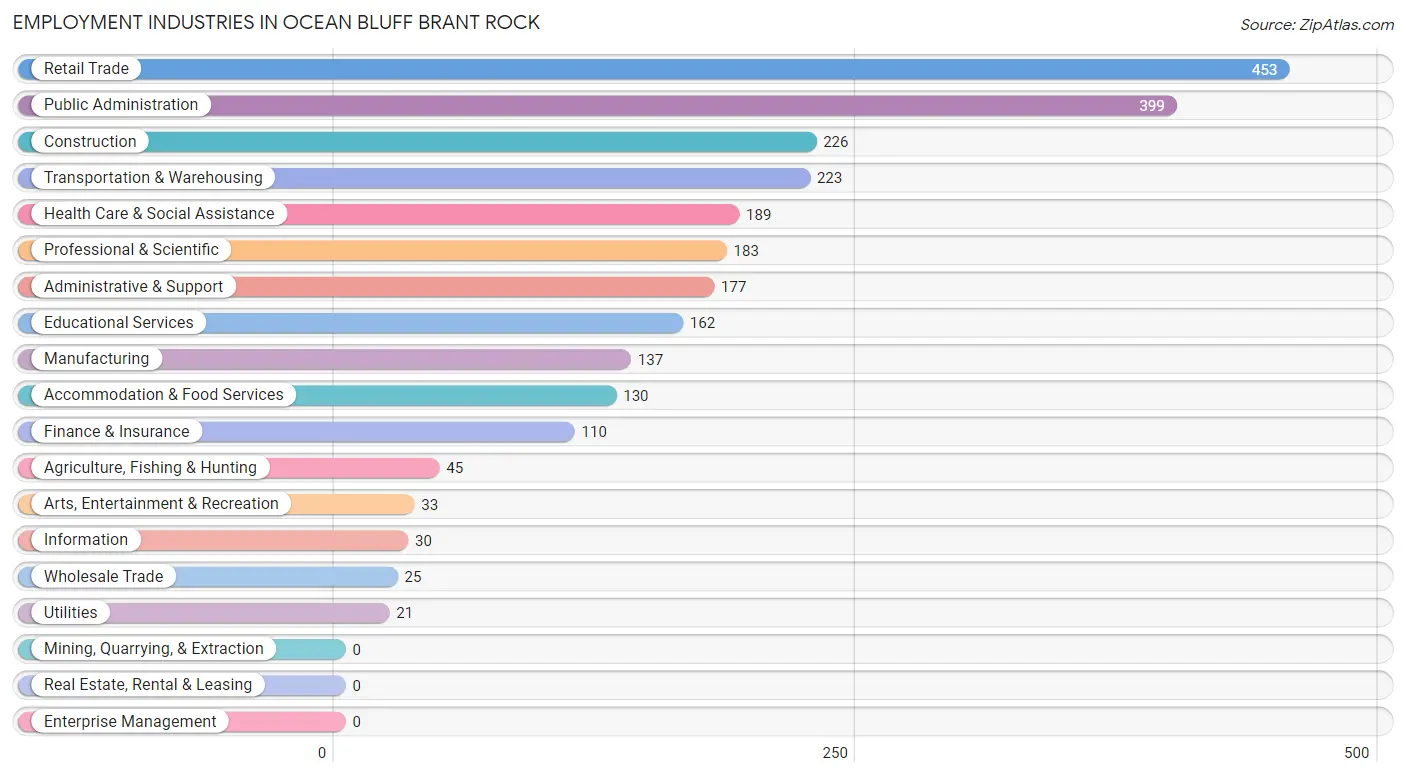
Employment Industries in Ocean Bluff Brant Rock
The major employment industries in Ocean Bluff Brant Rock include Retail Trade (453 | 17.1%), Public Administration (399 | 15.1%), Construction (226 | 8.5%), Transportation & Warehousing (223 | 8.4%), and Health Care & Social Assistance (189 | 7.1%).
Employment Industries by Sex in Ocean Bluff Brant Rock
The Ocean Bluff Brant Rock industries that see more men than women are Agriculture, Fishing & Hunting (100.0%), Construction (100.0%), and Wholesale Trade (100.0%), whereas the industries that tend to have a higher number of women are Arts, Entertainment & Recreation (100.0%), Health Care & Social Assistance (93.1%), and Finance & Insurance (71.8%).

| Industry | Male | Female |
| Agriculture, Fishing & Hunting | 45 (100.0%) | 0 (0.0%) |
| Mining, Quarrying, & Extraction | 0 (0.0%) | 0 (0.0%) |
| Construction | 226 (100.0%) | 0 (0.0%) |
| Manufacturing | 109 (79.6%) | 28 (20.4%) |
| Wholesale Trade | 25 (100.0%) | 0 (0.0%) |
| Retail Trade | 250 (55.2%) | 203 (44.8%) |
| Transportation & Warehousing | 223 (100.0%) | 0 (0.0%) |
| Utilities | 8 (38.1%) | 13 (61.9%) |
| Information | 16 (53.3%) | 14 (46.7%) |
| Finance & Insurance | 31 (28.2%) | 79 (71.8%) |
| Real Estate, Rental & Leasing | 0 (0.0%) | 0 (0.0%) |
| Professional & Scientific | 105 (57.4%) | 78 (42.6%) |
| Enterprise Management | 0 (0.0%) | 0 (0.0%) |
| Administrative & Support | 71 (40.1%) | 106 (59.9%) |
| Educational Services | 72 (44.4%) | 90 (55.6%) |
| Health Care & Social Assistance | 13 (6.9%) | 176 (93.1%) |
| Arts, Entertainment & Recreation | 0 (0.0%) | 33 (100.0%) |
| Accommodation & Food Services | 42 (32.3%) | 88 (67.7%) |
| Public Administration | 152 (38.1%) | 247 (61.9%) |
| Total | 1,423 (53.7%) | 1,227 (46.3%) |
Education in Ocean Bluff Brant Rock
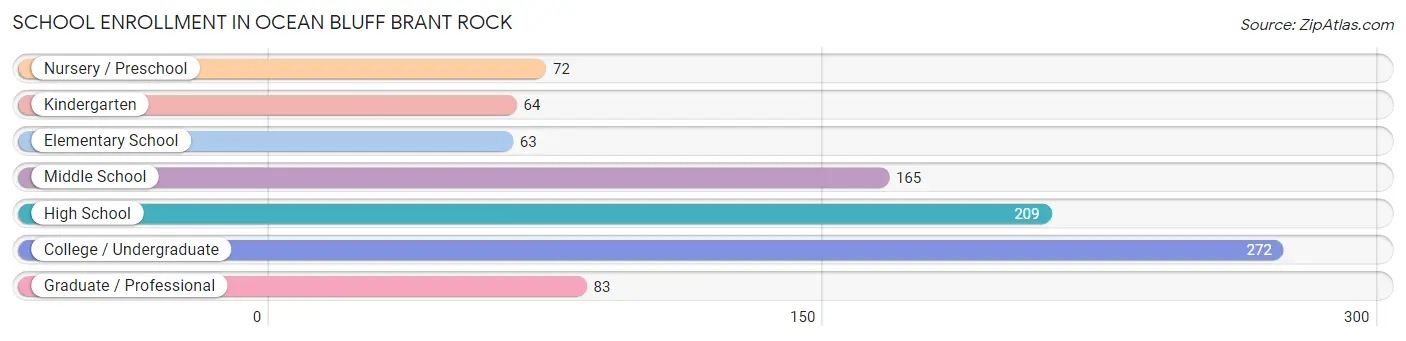
School Enrollment in Ocean Bluff Brant Rock
The most common levels of schooling among the 928 students in Ocean Bluff Brant Rock are college / undergraduate (272 | 29.3%), high school (209 | 22.5%), and middle school (165 | 17.8%).
| School Level | # Students | % Students |
| Nursery / Preschool | 72 | 7.8% |
| Kindergarten | 64 | 6.9% |
| Elementary School | 63 | 6.8% |
| Middle School | 165 | 17.8% |
| High School | 209 | 22.5% |
| College / Undergraduate | 272 | 29.3% |
| Graduate / Professional | 83 | 8.9% |
| Total | 928 | 100.0% |
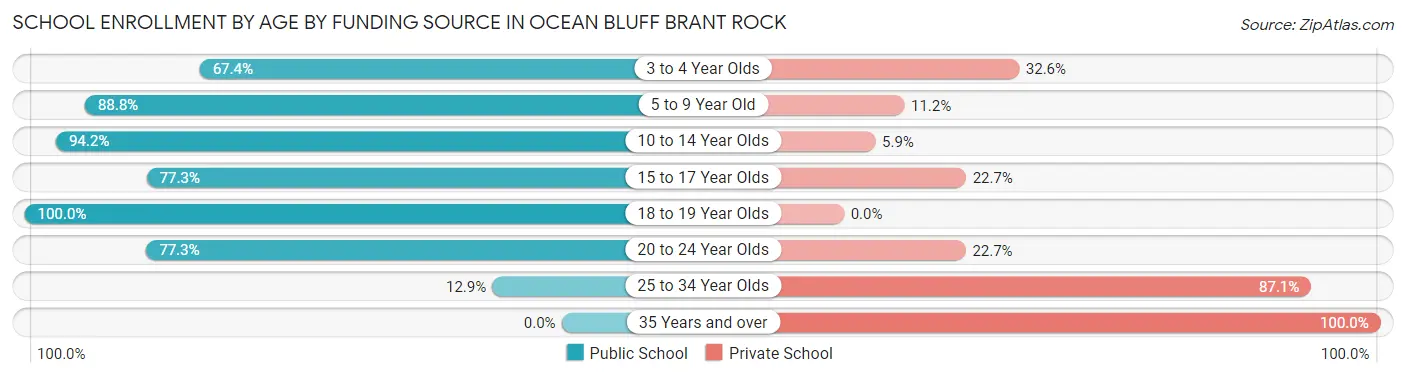
School Enrollment by Age by Funding Source in Ocean Bluff Brant Rock
Out of a total of 928 students who are enrolled in schools in Ocean Bluff Brant Rock, 232 (25.0%) attend a private institution, while the remaining 696 (75.0%) are enrolled in public schools. The age group of 35 years and over has the highest likelihood of being enrolled in private schools, with 37 (100.0% in the age bracket) enrolled. Conversely, the age group of 18 to 19 year olds has the lowest likelihood of being enrolled in a private school, with 130 (100.0% in the age bracket) attending a public institution.
| Age Bracket | Public School | Private School |
| 3 to 4 Year Olds | 64 (67.4%) | 31 (32.6%) |
| 5 to 9 Year Old | 79 (88.8%) | 10 (11.2%) |
| 10 to 14 Year Olds | 177 (94.2%) | 11 (5.9%) |
| 15 to 17 Year Olds | 85 (77.3%) | 25 (22.7%) |
| 18 to 19 Year Olds | 130 (100.0%) | 0 (0.0%) |
| 20 to 24 Year Olds | 150 (77.3%) | 44 (22.7%) |
| 25 to 34 Year Olds | 11 (12.9%) | 74 (87.1%) |
| 35 Years and over | 0 (0.0%) | 37 (100.0%) |
| Total | 696 (75.0%) | 232 (25.0%) |
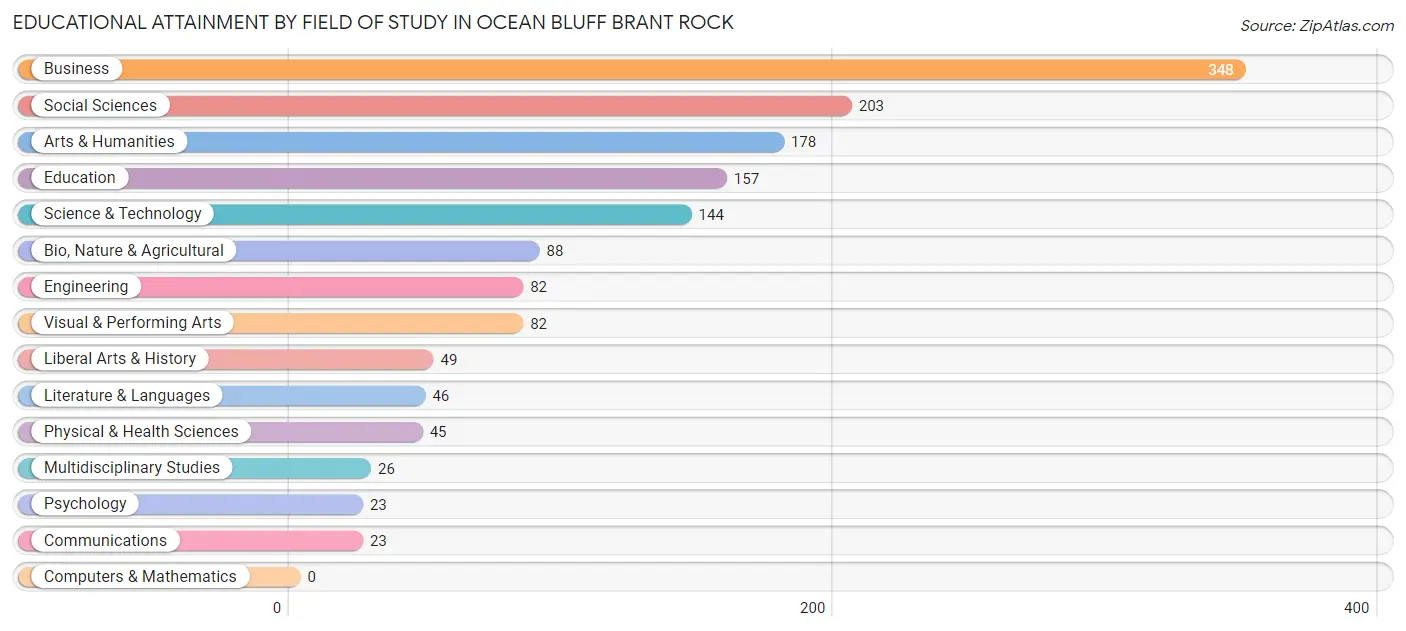
Educational Attainment by Field of Study in Ocean Bluff Brant Rock
Business (348 | 23.3%), social sciences (203 | 13.6%), arts & humanities (178 | 11.9%), education (157 | 10.5%), and science & technology (144 | 9.6%) are the most common fields of study among 1,494 individuals in Ocean Bluff Brant Rock who have obtained a bachelor's degree or higher.
| Field of Study | # Graduates | % Graduates |
| Computers & Mathematics | 0 | 0.0% |
| Bio, Nature & Agricultural | 88 | 5.9% |
| Physical & Health Sciences | 45 | 3.0% |
| Psychology | 23 | 1.5% |
| Social Sciences | 203 | 13.6% |
| Engineering | 82 | 5.5% |
| Multidisciplinary Studies | 26 | 1.7% |
| Science & Technology | 144 | 9.6% |
| Business | 348 | 23.3% |
| Education | 157 | 10.5% |
| Literature & Languages | 46 | 3.1% |
| Liberal Arts & History | 49 | 3.3% |
| Visual & Performing Arts | 82 | 5.5% |
| Communications | 23 | 1.5% |
| Arts & Humanities | 178 | 11.9% |
| Total | 1,494 | 100.0% |
Transportation & Commute in Ocean Bluff Brant Rock
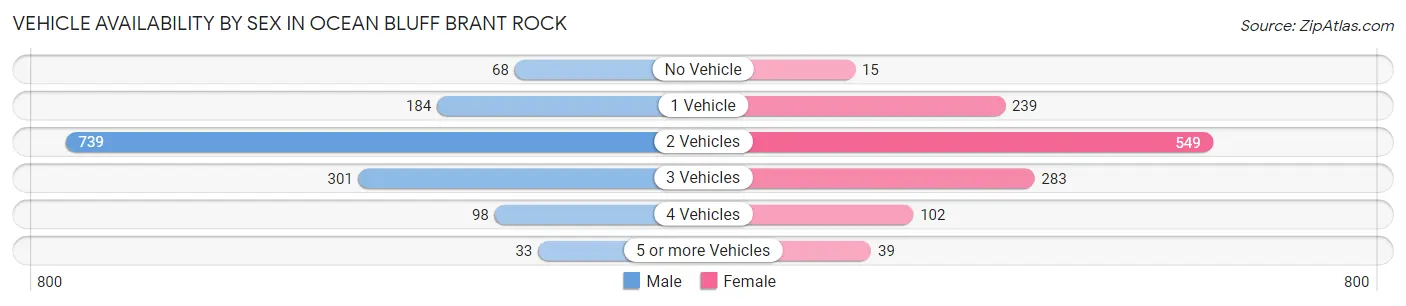
Vehicle Availability by Sex in Ocean Bluff Brant Rock
The most prevalent vehicle ownership categories in Ocean Bluff Brant Rock are males with 2 vehicles (739, accounting for 51.9%) and females with 2 vehicles (549, making up 60.2%).
| Vehicles Available | Male | Female |
| No Vehicle | 68 (4.8%) | 15 (1.2%) |
| 1 Vehicle | 184 (12.9%) | 239 (19.5%) |
| 2 Vehicles | 739 (51.9%) | 549 (44.7%) |
| 3 Vehicles | 301 (21.1%) | 283 (23.1%) |
| 4 Vehicles | 98 (6.9%) | 102 (8.3%) |
| 5 or more Vehicles | 33 (2.3%) | 39 (3.2%) |
| Total | 1,423 (100.0%) | 1,227 (100.0%) |
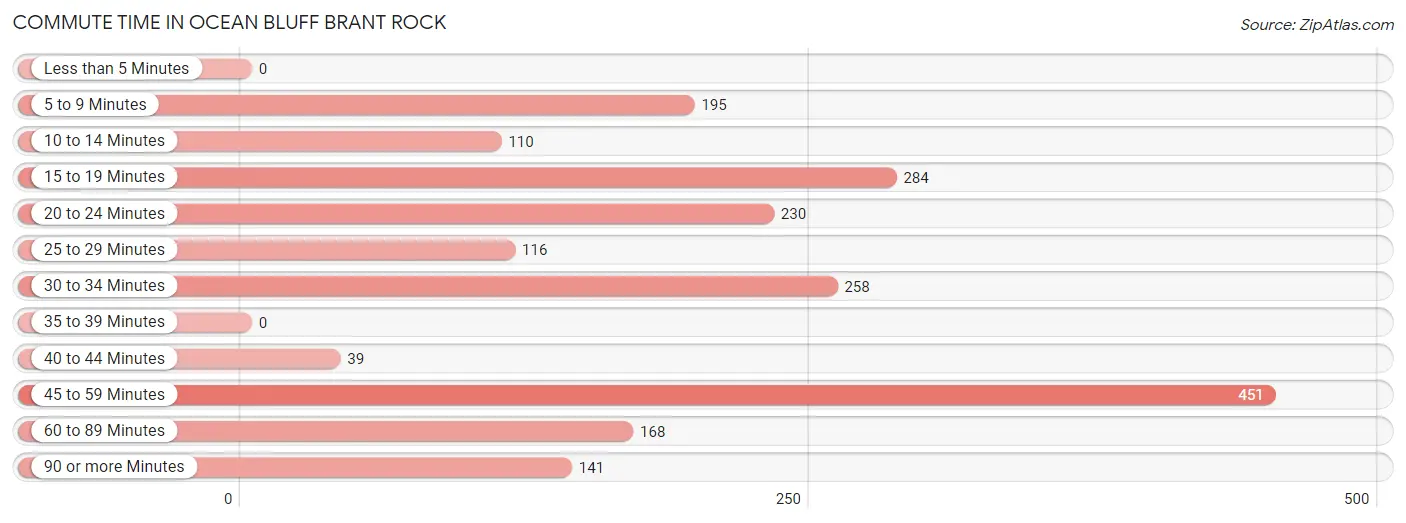
Commute Time in Ocean Bluff Brant Rock
The most frequently occuring commute durations in Ocean Bluff Brant Rock are 45 to 59 minutes (451 commuters, 22.6%), 15 to 19 minutes (284 commuters, 14.3%), and 30 to 34 minutes (258 commuters, 13.0%).
| Commute Time | # Commuters | % Commuters |
| Less than 5 Minutes | 0 | 0.0% |
| 5 to 9 Minutes | 195 | 9.8% |
| 10 to 14 Minutes | 110 | 5.5% |
| 15 to 19 Minutes | 284 | 14.3% |
| 20 to 24 Minutes | 230 | 11.6% |
| 25 to 29 Minutes | 116 | 5.8% |
| 30 to 34 Minutes | 258 | 13.0% |
| 35 to 39 Minutes | 0 | 0.0% |
| 40 to 44 Minutes | 39 | 2.0% |
| 45 to 59 Minutes | 451 | 22.6% |
| 60 to 89 Minutes | 168 | 8.4% |
| 90 or more Minutes | 141 | 7.1% |
Commute Time by Sex in Ocean Bluff Brant Rock
The most common commute times in Ocean Bluff Brant Rock are 45 to 59 minutes (241 commuters, 21.2%) for males and 45 to 59 minutes (210 commuters, 24.6%) for females.
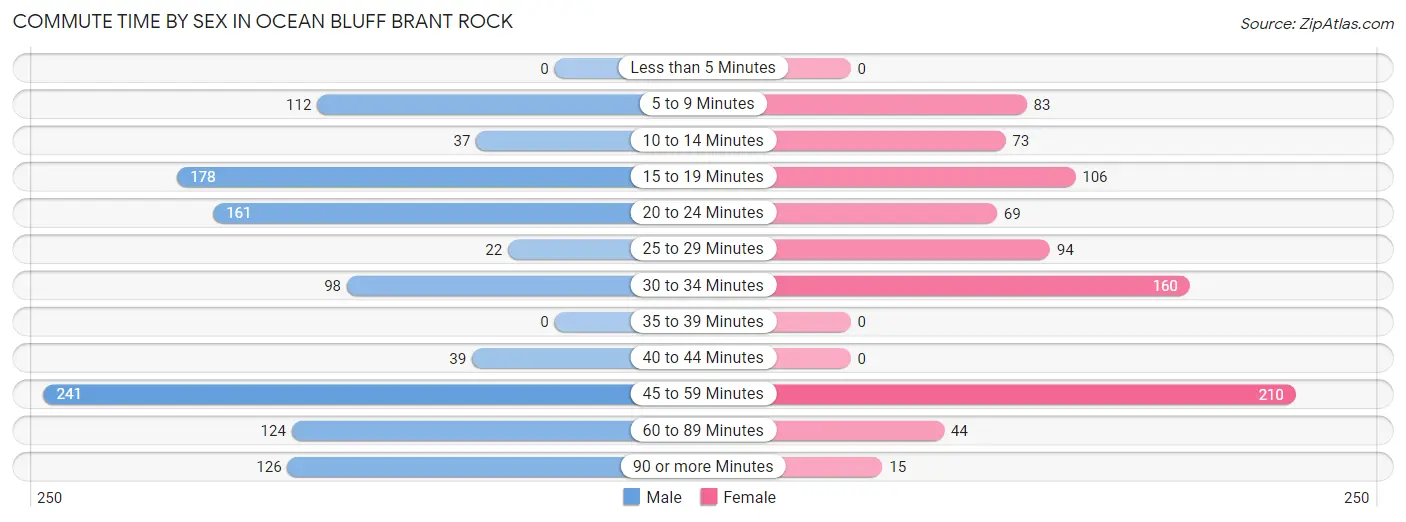
| Commute Time | Male | Female |
| Less than 5 Minutes | 0 (0.0%) | 0 (0.0%) |
| 5 to 9 Minutes | 112 (9.8%) | 83 (9.7%) |
| 10 to 14 Minutes | 37 (3.3%) | 73 (8.6%) |
| 15 to 19 Minutes | 178 (15.6%) | 106 (12.4%) |
| 20 to 24 Minutes | 161 (14.1%) | 69 (8.1%) |
| 25 to 29 Minutes | 22 (1.9%) | 94 (11.0%) |
| 30 to 34 Minutes | 98 (8.6%) | 160 (18.7%) |
| 35 to 39 Minutes | 0 (0.0%) | 0 (0.0%) |
| 40 to 44 Minutes | 39 (3.4%) | 0 (0.0%) |
| 45 to 59 Minutes | 241 (21.2%) | 210 (24.6%) |
| 60 to 89 Minutes | 124 (10.9%) | 44 (5.1%) |
| 90 or more Minutes | 126 (11.1%) | 15 (1.8%) |
Time of Departure to Work by Sex in Ocean Bluff Brant Rock
The most frequent times of departure to work in Ocean Bluff Brant Rock are 7:00 AM to 7:29 AM (182, 16.0%) for males and 6:30 AM to 6:59 AM (177, 20.7%) for females.
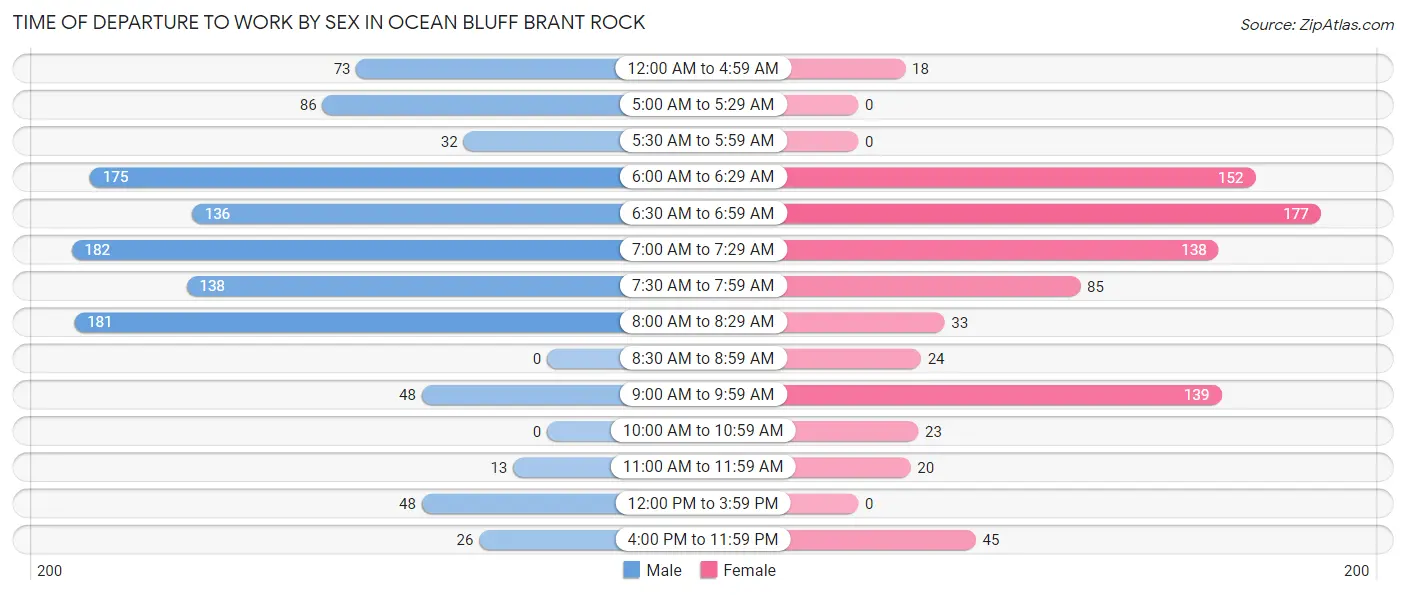
| Time of Departure | Male | Female |
| 12:00 AM to 4:59 AM | 73 (6.4%) | 18 (2.1%) |
| 5:00 AM to 5:29 AM | 86 (7.6%) | 0 (0.0%) |
| 5:30 AM to 5:59 AM | 32 (2.8%) | 0 (0.0%) |
| 6:00 AM to 6:29 AM | 175 (15.4%) | 152 (17.8%) |
| 6:30 AM to 6:59 AM | 136 (11.9%) | 177 (20.7%) |
| 7:00 AM to 7:29 AM | 182 (16.0%) | 138 (16.2%) |
| 7:30 AM to 7:59 AM | 138 (12.1%) | 85 (10.0%) |
| 8:00 AM to 8:29 AM | 181 (15.9%) | 33 (3.9%) |
| 8:30 AM to 8:59 AM | 0 (0.0%) | 24 (2.8%) |
| 9:00 AM to 9:59 AM | 48 (4.2%) | 139 (16.3%) |
| 10:00 AM to 10:59 AM | 0 (0.0%) | 23 (2.7%) |
| 11:00 AM to 11:59 AM | 13 (1.1%) | 20 (2.3%) |
| 12:00 PM to 3:59 PM | 48 (4.2%) | 0 (0.0%) |
| 4:00 PM to 11:59 PM | 26 (2.3%) | 45 (5.3%) |
| Total | 1,138 (100.0%) | 854 (100.0%) |
Housing Occupancy in Ocean Bluff Brant Rock
Occupancy by Ownership in Ocean Bluff Brant Rock
Of the total 2,032 dwellings in Ocean Bluff Brant Rock, owner-occupied units account for 1,631 (80.3%), while renter-occupied units make up 401 (19.7%).
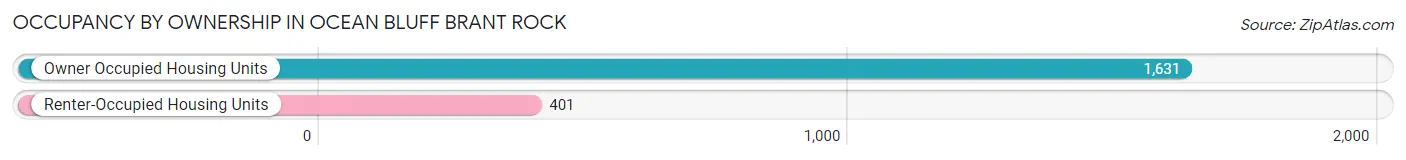
| Occupancy | # Housing Units | % Housing Units |
| Owner Occupied Housing Units | 1,631 | 80.3% |
| Renter-Occupied Housing Units | 401 | 19.7% |
| Total Occupied Housing Units | 2,032 | 100.0% |
Occupancy by Household Size in Ocean Bluff Brant Rock
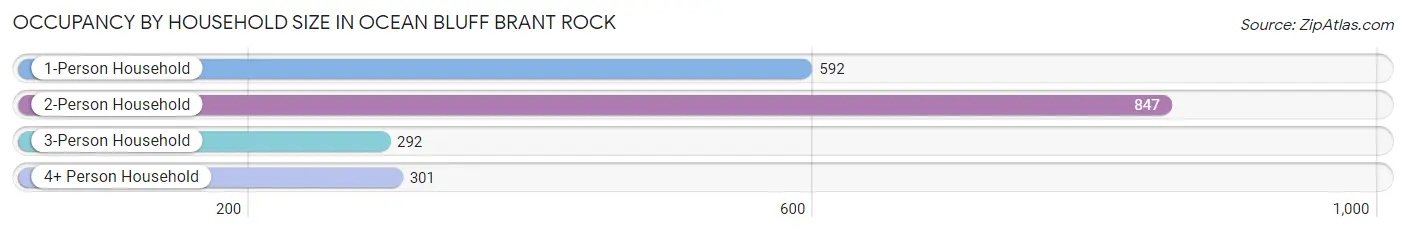
| Household Size | # Housing Units | % Housing Units |
| 1-Person Household | 592 | 29.1% |
| 2-Person Household | 847 | 41.7% |
| 3-Person Household | 292 | 14.4% |
| 4+ Person Household | 301 | 14.8% |
| Total Housing Units | 2,032 | 100.0% |
Occupancy by Ownership by Household Size in Ocean Bluff Brant Rock
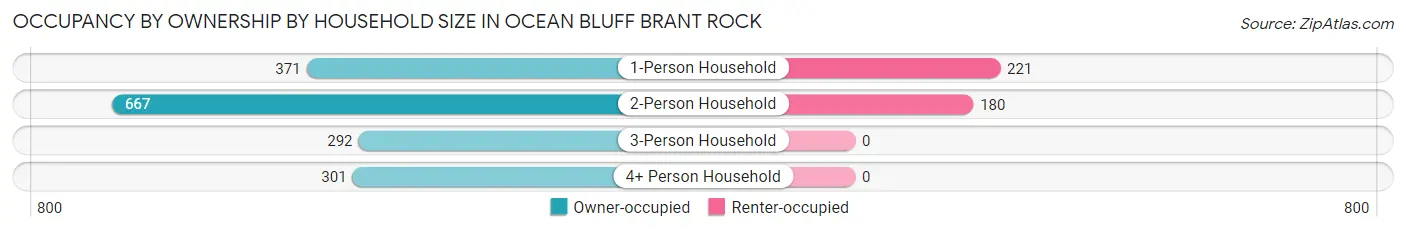
| Household Size | Owner-occupied | Renter-occupied |
| 1-Person Household | 371 (62.7%) | 221 (37.3%) |
| 2-Person Household | 667 (78.7%) | 180 (21.2%) |
| 3-Person Household | 292 (100.0%) | 0 (0.0%) |
| 4+ Person Household | 301 (100.0%) | 0 (0.0%) |
| Total Housing Units | 1,631 (80.3%) | 401 (19.7%) |
Occupancy by Educational Attainment in Ocean Bluff Brant Rock
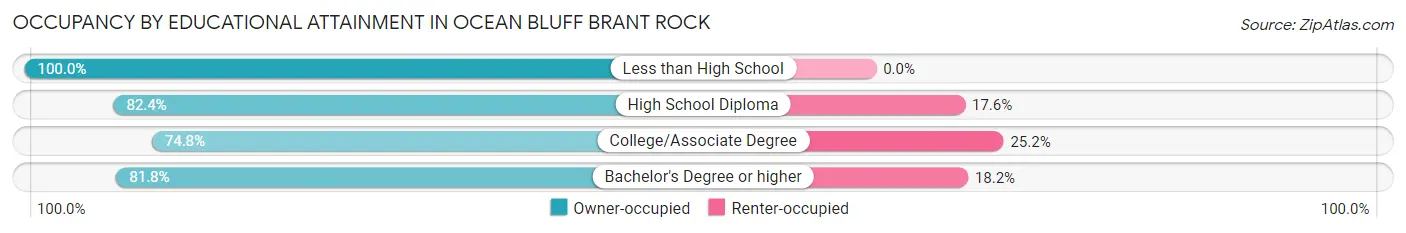
| Household Size | Owner-occupied | Renter-occupied |
| Less than High School | 8 (100.0%) | 0 (0.0%) |
| High School Diploma | 561 (82.4%) | 120 (17.6%) |
| College/Associate Degree | 388 (74.8%) | 131 (25.2%) |
| Bachelor's Degree or higher | 674 (81.8%) | 150 (18.2%) |
Occupancy by Age of Householder in Ocean Bluff Brant Rock
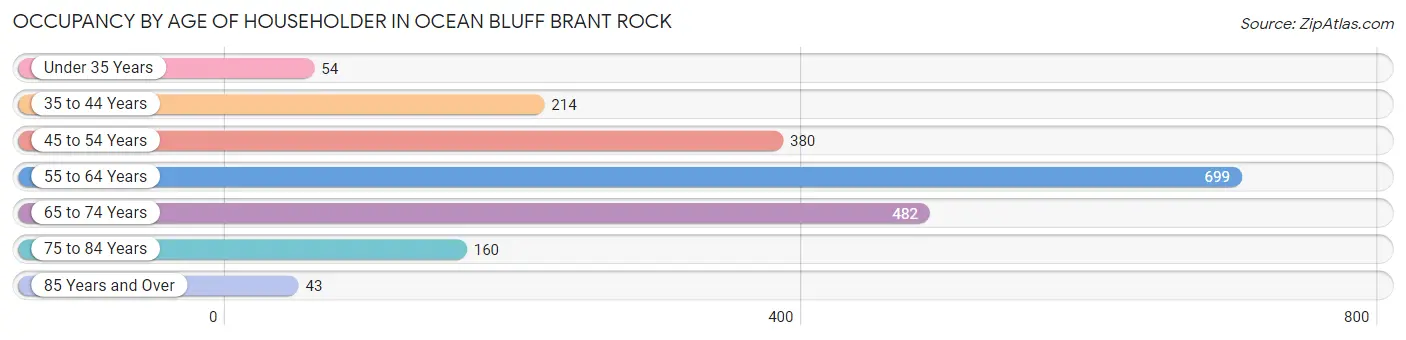
| Age Bracket | # Households | % Households |
| Under 35 Years | 54 | 2.7% |
| 35 to 44 Years | 214 | 10.5% |
| 45 to 54 Years | 380 | 18.7% |
| 55 to 64 Years | 699 | 34.4% |
| 65 to 74 Years | 482 | 23.7% |
| 75 to 84 Years | 160 | 7.9% |
| 85 Years and Over | 43 | 2.1% |
| Total | 2,032 | 100.0% |
Housing Finances in Ocean Bluff Brant Rock
Median Income by Occupancy in Ocean Bluff Brant Rock
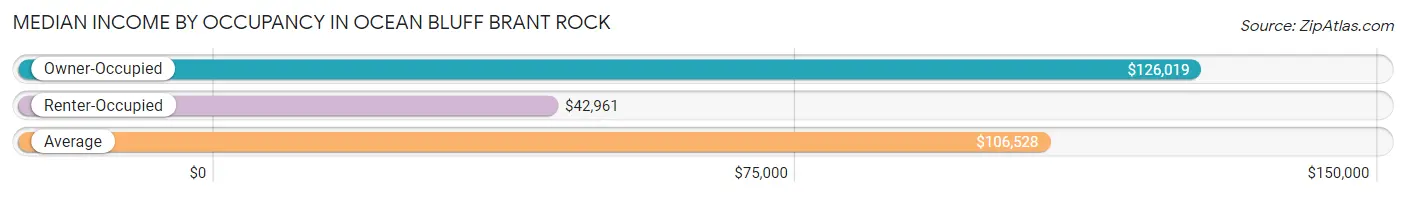
| Occupancy Type | # Households | Median Income |
| Owner-Occupied | 1,631 (80.3%) | $126,019 |
| Renter-Occupied | 401 (19.7%) | $42,961 |
| Average | 2,032 (100.0%) | $106,528 |
Occupancy by Householder Income Bracket in Ocean Bluff Brant Rock
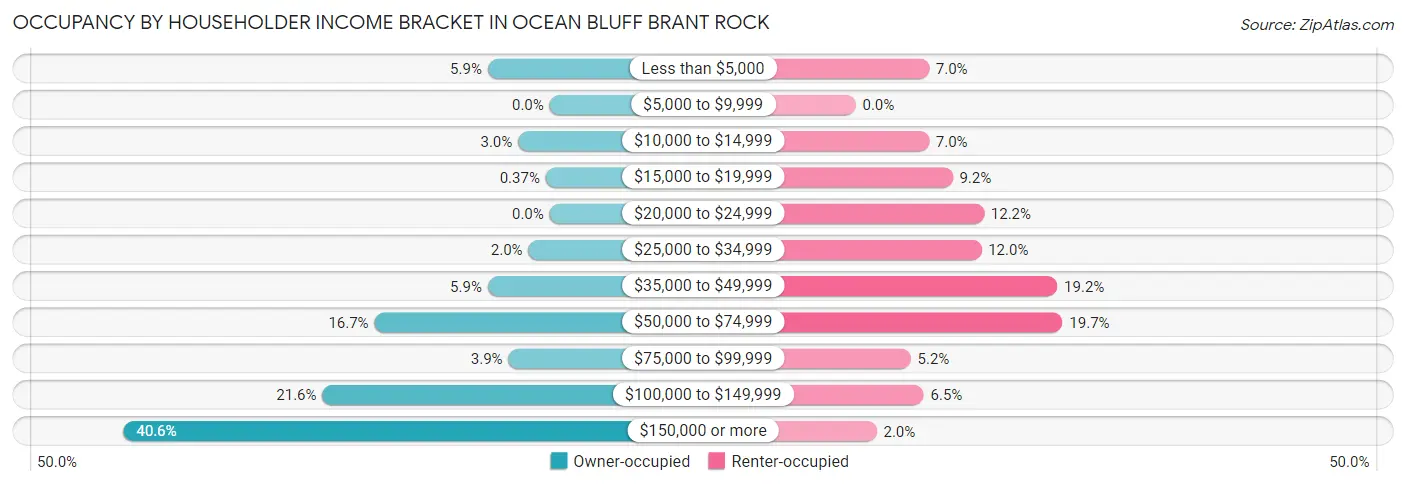
| Income Bracket | Owner-occupied | Renter-occupied |
| Less than $5,000 | 96 (5.9%) | 28 (7.0%) |
| $5,000 to $9,999 | 0 (0.0%) | 0 (0.0%) |
| $10,000 to $14,999 | 49 (3.0%) | 28 (7.0%) |
| $15,000 to $19,999 | 6 (0.4%) | 37 (9.2%) |
| $20,000 to $24,999 | 0 (0.0%) | 49 (12.2%) |
| $25,000 to $34,999 | 33 (2.0%) | 48 (12.0%) |
| $35,000 to $49,999 | 96 (5.9%) | 77 (19.2%) |
| $50,000 to $74,999 | 272 (16.7%) | 79 (19.7%) |
| $75,000 to $99,999 | 64 (3.9%) | 21 (5.2%) |
| $100,000 to $149,999 | 353 (21.6%) | 26 (6.5%) |
| $150,000 or more | 662 (40.6%) | 8 (2.0%) |
| Total | 1,631 (100.0%) | 401 (100.0%) |
Monthly Housing Cost Tiers in Ocean Bluff Brant Rock
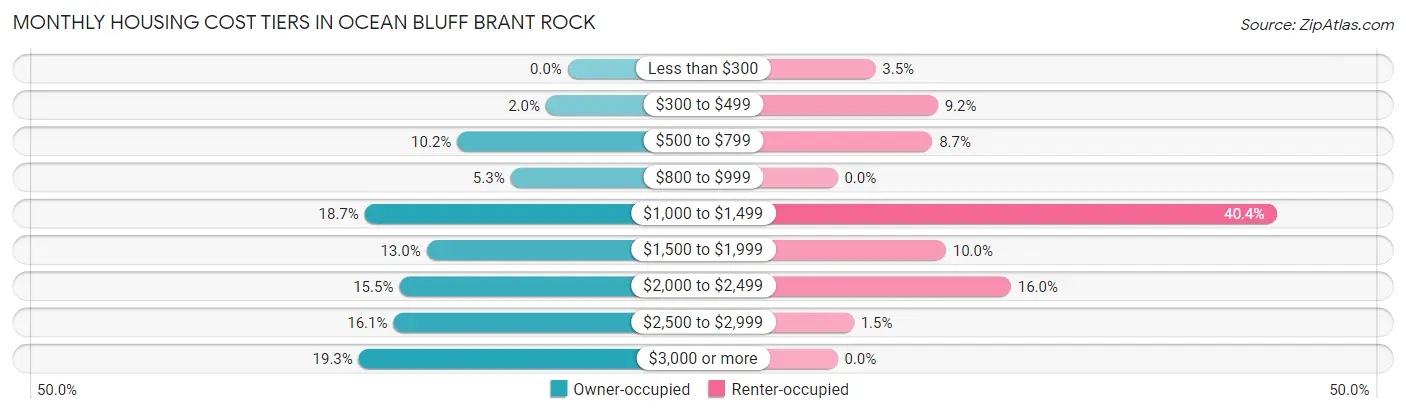
| Monthly Cost | Owner-occupied | Renter-occupied |
| Less than $300 | 0 (0.0%) | 14 (3.5%) |
| $300 to $499 | 33 (2.0%) | 37 (9.2%) |
| $500 to $799 | 166 (10.2%) | 35 (8.7%) |
| $800 to $999 | 86 (5.3%) | 0 (0.0%) |
| $1,000 to $1,499 | 305 (18.7%) | 162 (40.4%) |
| $1,500 to $1,999 | 212 (13.0%) | 40 (10.0%) |
| $2,000 to $2,499 | 253 (15.5%) | 64 (16.0%) |
| $2,500 to $2,999 | 262 (16.1%) | 6 (1.5%) |
| $3,000 or more | 314 (19.3%) | 0 (0.0%) |
| Total | 1,631 (100.0%) | 401 (100.0%) |
Physical Housing Characteristics in Ocean Bluff Brant Rock
Housing Structures in Ocean Bluff Brant Rock
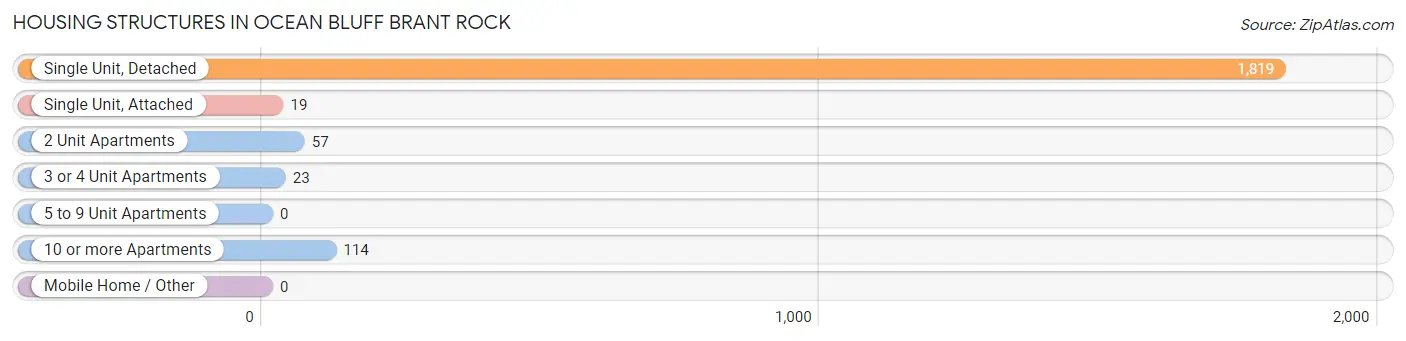
| Structure Type | # Housing Units | % Housing Units |
| Single Unit, Detached | 1,819 | 89.5% |
| Single Unit, Attached | 19 | 0.9% |
| 2 Unit Apartments | 57 | 2.8% |
| 3 or 4 Unit Apartments | 23 | 1.1% |
| 5 to 9 Unit Apartments | 0 | 0.0% |
| 10 or more Apartments | 114 | 5.6% |
| Mobile Home / Other | 0 | 0.0% |
| Total | 2,032 | 100.0% |
Housing Structures by Occupancy in Ocean Bluff Brant Rock
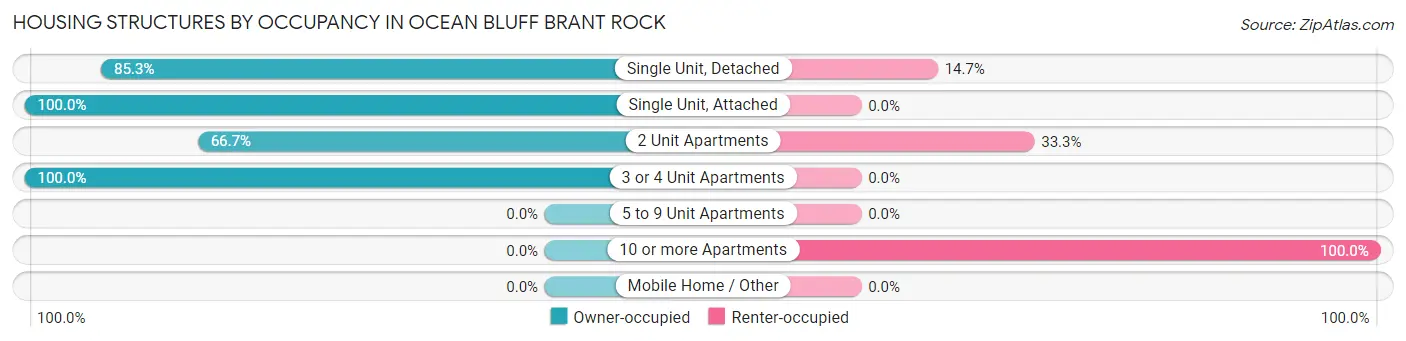
| Structure Type | Owner-occupied | Renter-occupied |
| Single Unit, Detached | 1,551 (85.3%) | 268 (14.7%) |
| Single Unit, Attached | 19 (100.0%) | 0 (0.0%) |
| 2 Unit Apartments | 38 (66.7%) | 19 (33.3%) |
| 3 or 4 Unit Apartments | 23 (100.0%) | 0 (0.0%) |
| 5 to 9 Unit Apartments | 0 (0.0%) | 0 (0.0%) |
| 10 or more Apartments | 0 (0.0%) | 114 (100.0%) |
| Mobile Home / Other | 0 (0.0%) | 0 (0.0%) |
| Total | 1,631 (80.3%) | 401 (19.7%) |
Housing Structures by Number of Rooms in Ocean Bluff Brant Rock
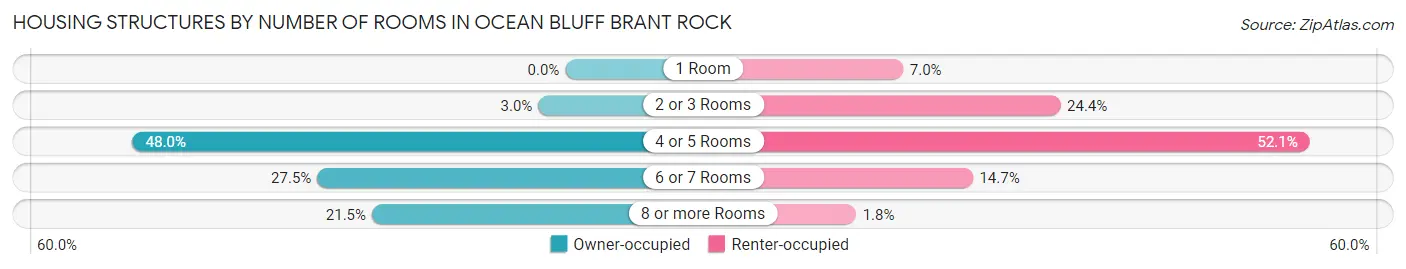
| Number of Rooms | Owner-occupied | Renter-occupied |
| 1 Room | 0 (0.0%) | 28 (7.0%) |
| 2 or 3 Rooms | 49 (3.0%) | 98 (24.4%) |
| 4 or 5 Rooms | 783 (48.0%) | 209 (52.1%) |
| 6 or 7 Rooms | 449 (27.5%) | 59 (14.7%) |
| 8 or more Rooms | 350 (21.5%) | 7 (1.8%) |
| Total | 1,631 (100.0%) | 401 (100.0%) |
Housing Structure by Heating Type in Ocean Bluff Brant Rock
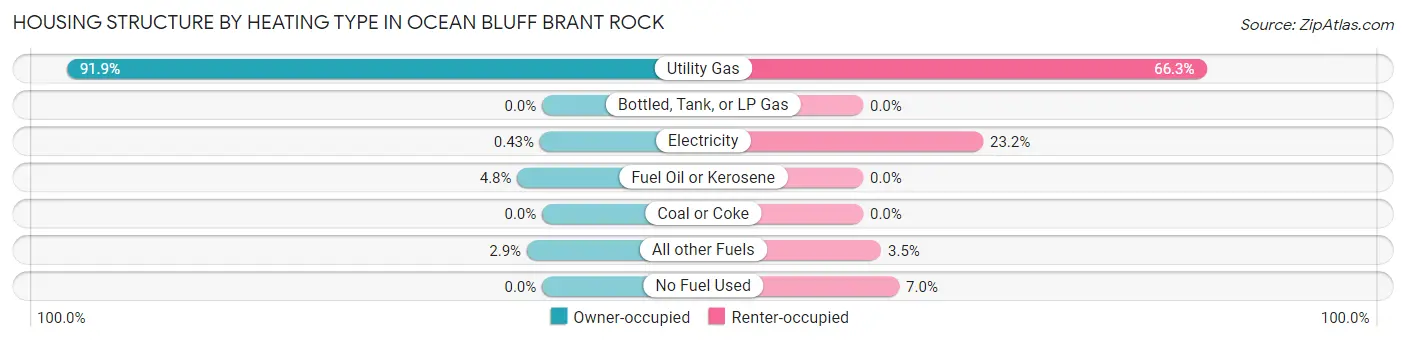
| Heating Type | Owner-occupied | Renter-occupied |
| Utility Gas | 1,498 (91.8%) | 266 (66.3%) |
| Bottled, Tank, or LP Gas | 0 (0.0%) | 0 (0.0%) |
| Electricity | 7 (0.4%) | 93 (23.2%) |
| Fuel Oil or Kerosene | 78 (4.8%) | 0 (0.0%) |
| Coal or Coke | 0 (0.0%) | 0 (0.0%) |
| All other Fuels | 48 (2.9%) | 14 (3.5%) |
| No Fuel Used | 0 (0.0%) | 28 (7.0%) |
| Total | 1,631 (100.0%) | 401 (100.0%) |
Household Vehicle Usage in Ocean Bluff Brant Rock
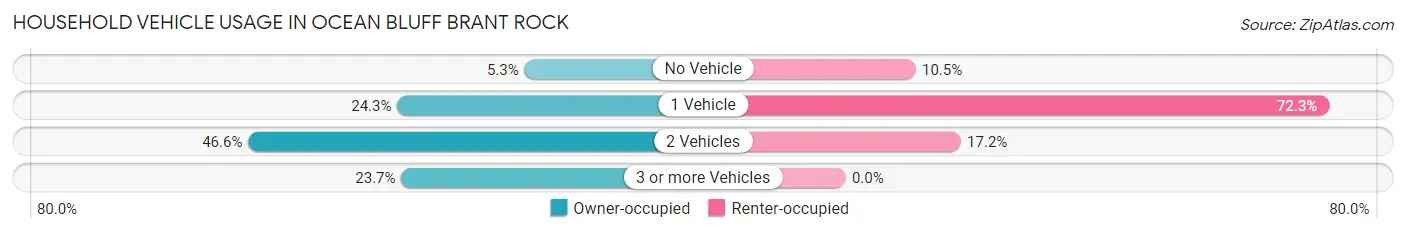
| Vehicles per Household | Owner-occupied | Renter-occupied |
| No Vehicle | 87 (5.3%) | 42 (10.5%) |
| 1 Vehicle | 397 (24.3%) | 290 (72.3%) |
| 2 Vehicles | 760 (46.6%) | 69 (17.2%) |
| 3 or more Vehicles | 387 (23.7%) | 0 (0.0%) |
| Total | 1,631 (100.0%) | 401 (100.0%) |
Real Estate & Mortgages in Ocean Bluff Brant Rock
Real Estate and Mortgage Overview in Ocean Bluff Brant Rock
| Characteristic | Without Mortgage | With Mortgage |
| Housing Units | 643 | 988 |
| Median Property Value | $507,900 | $459,000 |
| Median Household Income | $73,750 | $467 |
| Monthly Housing Costs | $1,025 | $314 |
| Real Estate Taxes | $6,265 | $0 |
Property Value by Mortgage Status in Ocean Bluff Brant Rock
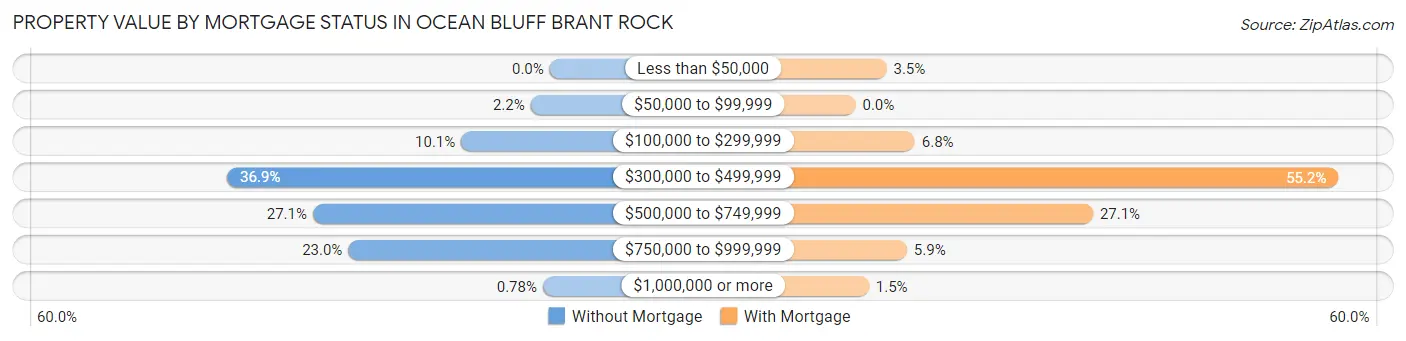
| Property Value | Without Mortgage | With Mortgage |
| Less than $50,000 | 0 (0.0%) | 35 (3.5%) |
| $50,000 to $99,999 | 14 (2.2%) | 0 (0.0%) |
| $100,000 to $299,999 | 65 (10.1%) | 67 (6.8%) |
| $300,000 to $499,999 | 237 (36.9%) | 545 (55.2%) |
| $500,000 to $749,999 | 174 (27.1%) | 268 (27.1%) |
| $750,000 to $999,999 | 148 (23.0%) | 58 (5.9%) |
| $1,000,000 or more | 5 (0.8%) | 15 (1.5%) |
| Total | 643 (100.0%) | 988 (100.0%) |
Household Income by Mortgage Status in Ocean Bluff Brant Rock
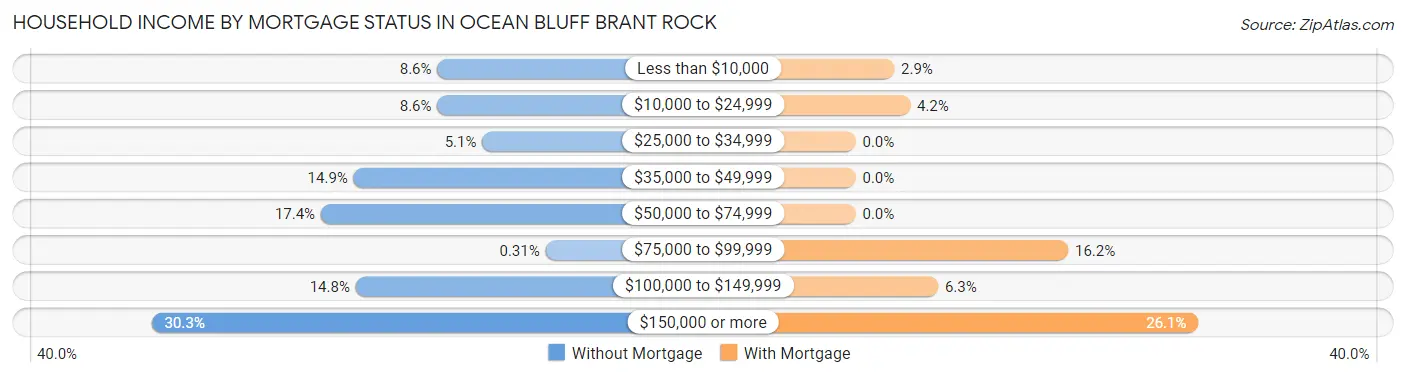
| Household Income | Without Mortgage | With Mortgage |
| Less than $10,000 | 55 (8.6%) | 29 (2.9%) |
| $10,000 to $24,999 | 55 (8.6%) | 41 (4.2%) |
| $25,000 to $34,999 | 33 (5.1%) | 0 (0.0%) |
| $35,000 to $49,999 | 96 (14.9%) | 0 (0.0%) |
| $50,000 to $74,999 | 112 (17.4%) | 0 (0.0%) |
| $75,000 to $99,999 | 2 (0.3%) | 160 (16.2%) |
| $100,000 to $149,999 | 95 (14.8%) | 62 (6.3%) |
| $150,000 or more | 195 (30.3%) | 258 (26.1%) |
| Total | 643 (100.0%) | 988 (100.0%) |
Property Value to Household Income Ratio in Ocean Bluff Brant Rock
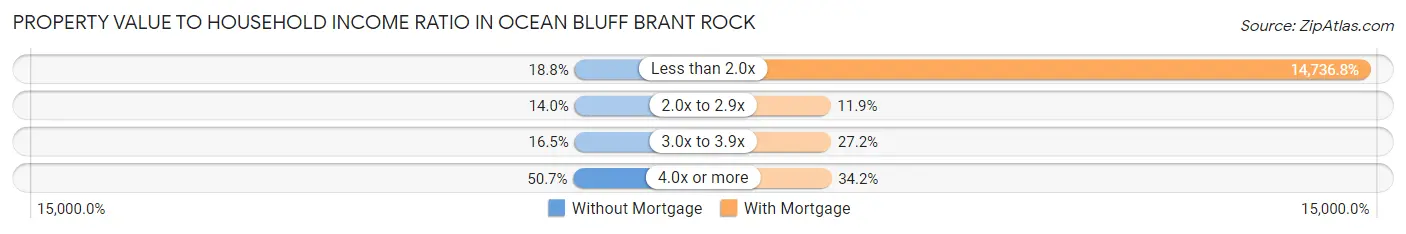
| Value-to-Income Ratio | Without Mortgage | With Mortgage |
| Less than 2.0x | 121 (18.8%) | 145,600 (14,736.8%) |
| 2.0x to 2.9x | 90 (14.0%) | 118 (11.9%) |
| 3.0x to 3.9x | 106 (16.5%) | 269 (27.2%) |
| 4.0x or more | 326 (50.7%) | 338 (34.2%) |
| Total | 643 (100.0%) | 988 (100.0%) |
Real Estate Taxes by Mortgage Status in Ocean Bluff Brant Rock
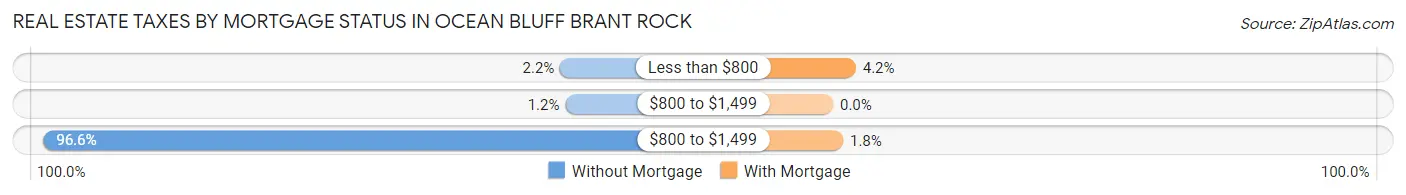
| Property Taxes | Without Mortgage | With Mortgage |
| Less than $800 | 14 (2.2%) | 41 (4.2%) |
| $800 to $1,499 | 8 (1.2%) | 0 (0.0%) |
| $800 to $1,499 | 621 (96.6%) | 18 (1.8%) |
| Total | 643 (100.0%) | 988 (100.0%) |
Health & Disability in Ocean Bluff Brant Rock
Health Insurance Coverage by Age in Ocean Bluff Brant Rock
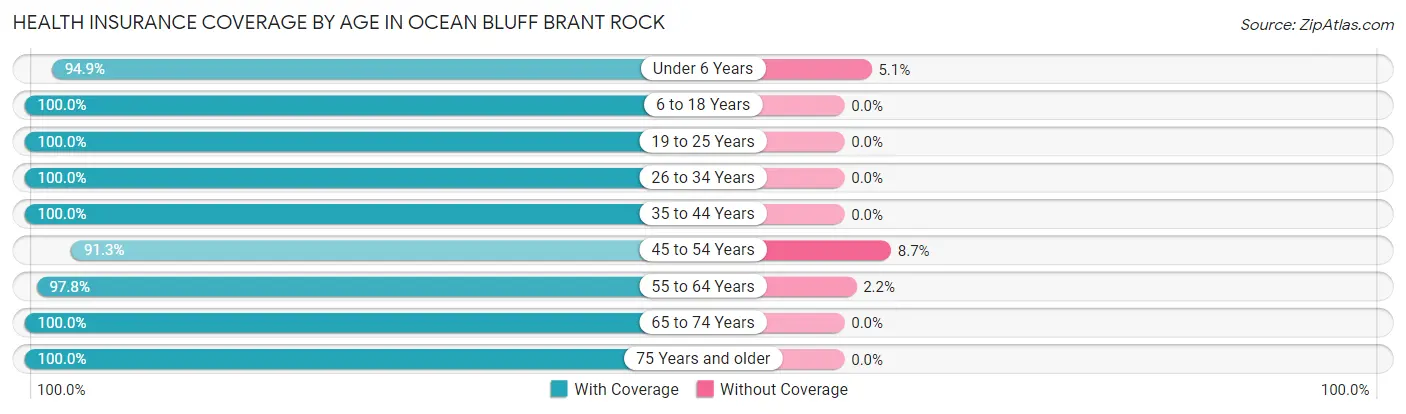
| Age Bracket | With Coverage | Without Coverage |
| Under 6 Years | 169 (94.9%) | 9 (5.1%) |
| 6 to 18 Years | 480 (100.0%) | 0 (0.0%) |
| 19 to 25 Years | 339 (100.0%) | 0 (0.0%) |
| 26 to 34 Years | 240 (100.0%) | 0 (0.0%) |
| 35 to 44 Years | 504 (100.0%) | 0 (0.0%) |
| 45 to 54 Years | 631 (91.3%) | 60 (8.7%) |
| 55 to 64 Years | 1,231 (97.8%) | 28 (2.2%) |
| 65 to 74 Years | 685 (100.0%) | 0 (0.0%) |
| 75 Years and older | 261 (100.0%) | 0 (0.0%) |
| Total | 4,540 (97.9%) | 97 (2.1%) |
Health Insurance Coverage by Citizenship Status in Ocean Bluff Brant Rock
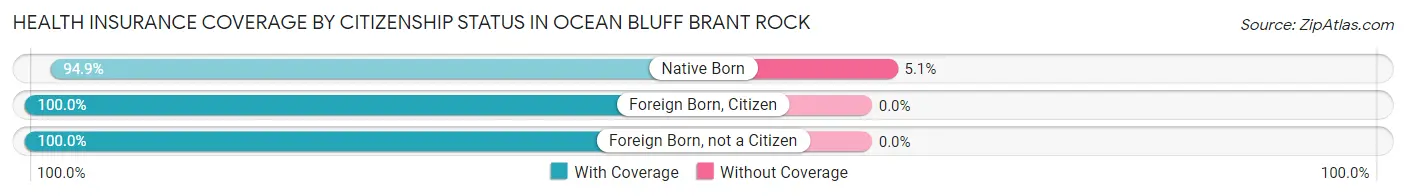
| Citizenship Status | With Coverage | Without Coverage |
| Native Born | 169 (94.9%) | 9 (5.1%) |
| Foreign Born, Citizen | 480 (100.0%) | 0 (0.0%) |
| Foreign Born, not a Citizen | 339 (100.0%) | 0 (0.0%) |
Health Insurance Coverage by Household Income in Ocean Bluff Brant Rock
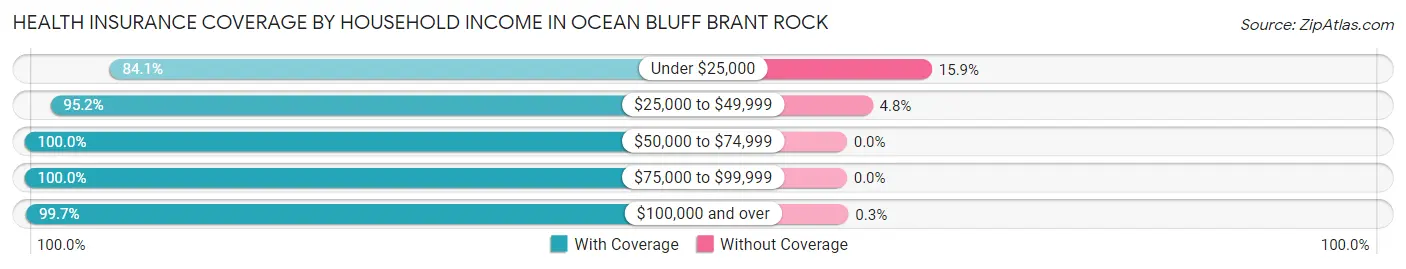
| Household Income | With Coverage | Without Coverage |
| Under $25,000 | 364 (84.1%) | 69 (15.9%) |
| $25,000 to $49,999 | 374 (95.2%) | 19 (4.8%) |
| $50,000 to $74,999 | 630 (100.0%) | 0 (0.0%) |
| $75,000 to $99,999 | 199 (100.0%) | 0 (0.0%) |
| $100,000 and over | 2,946 (99.7%) | 9 (0.3%) |
Public vs Private Health Insurance Coverage by Age in Ocean Bluff Brant Rock
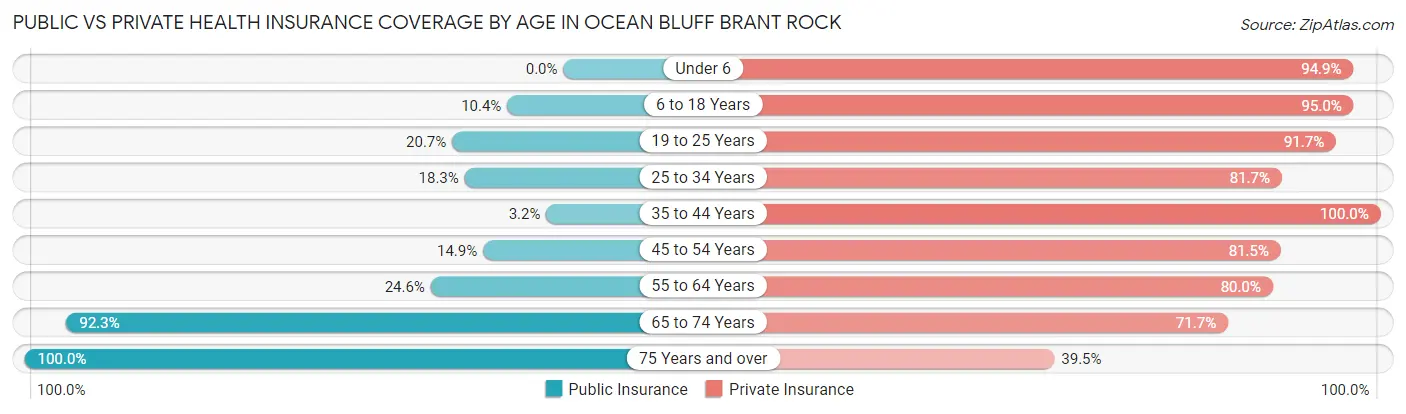
| Age Bracket | Public Insurance | Private Insurance |
| Under 6 | 0 (0.0%) | 169 (94.9%) |
| 6 to 18 Years | 50 (10.4%) | 456 (95.0%) |
| 19 to 25 Years | 70 (20.6%) | 311 (91.7%) |
| 25 to 34 Years | 44 (18.3%) | 196 (81.7%) |
| 35 to 44 Years | 16 (3.2%) | 504 (100.0%) |
| 45 to 54 Years | 103 (14.9%) | 563 (81.5%) |
| 55 to 64 Years | 310 (24.6%) | 1,007 (80.0%) |
| 65 to 74 Years | 632 (92.3%) | 491 (71.7%) |
| 75 Years and over | 261 (100.0%) | 103 (39.5%) |
| Total | 1,486 (32.1%) | 3,800 (82.0%) |
Disability Status by Sex by Age in Ocean Bluff Brant Rock
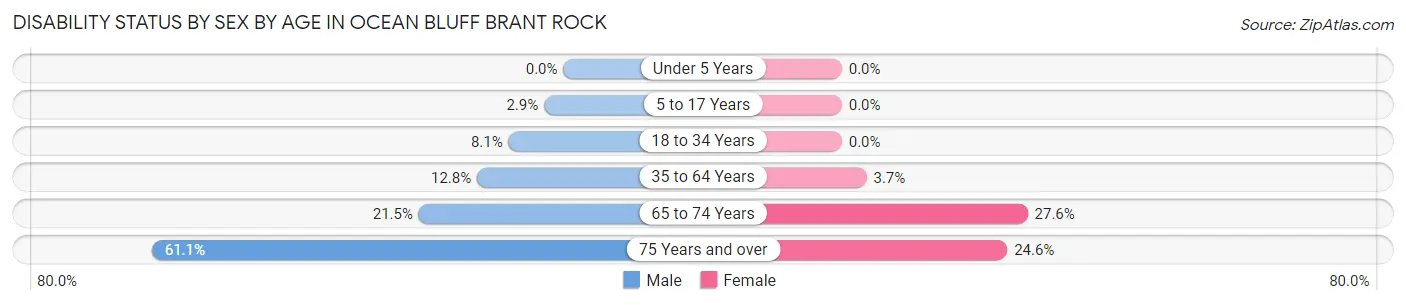
| Age Bracket | Male | Female |
| Under 5 Years | 0 (0.0%) | 0 (0.0%) |
| 5 to 17 Years | 7 (2.9%) | 0 (0.0%) |
| 18 to 34 Years | 31 (8.1%) | 0 (0.0%) |
| 35 to 64 Years | 168 (12.8%) | 42 (3.7%) |
| 65 to 74 Years | 56 (21.5%) | 117 (27.6%) |
| 75 Years and over | 55 (61.1%) | 42 (24.6%) |
Disability Class by Sex by Age in Ocean Bluff Brant Rock
Disability Class: Hearing Difficulty
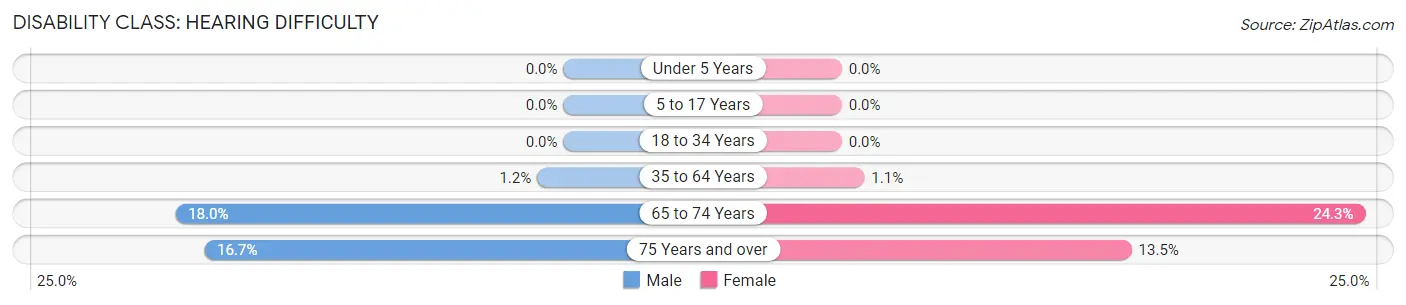
| Age Bracket | Male | Female |
| Under 5 Years | 0 (0.0%) | 0 (0.0%) |
| 5 to 17 Years | 0 (0.0%) | 0 (0.0%) |
| 18 to 34 Years | 0 (0.0%) | 0 (0.0%) |
| 35 to 64 Years | 16 (1.2%) | 12 (1.1%) |
| 65 to 74 Years | 47 (18.0%) | 103 (24.3%) |
| 75 Years and over | 15 (16.7%) | 23 (13.5%) |
Disability Class: Vision Difficulty
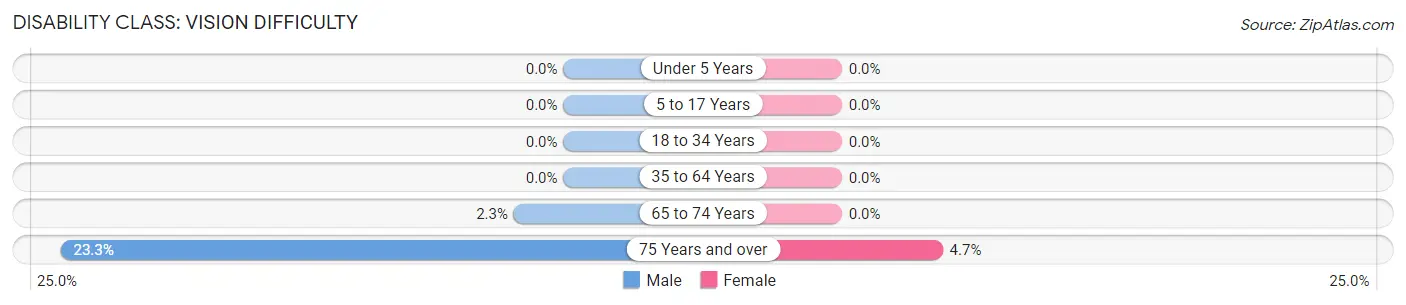
| Age Bracket | Male | Female |
| Under 5 Years | 0 (0.0%) | 0 (0.0%) |
| 5 to 17 Years | 0 (0.0%) | 0 (0.0%) |
| 18 to 34 Years | 0 (0.0%) | 0 (0.0%) |
| 35 to 64 Years | 0 (0.0%) | 0 (0.0%) |
| 65 to 74 Years | 6 (2.3%) | 0 (0.0%) |
| 75 Years and over | 21 (23.3%) | 8 (4.7%) |
Disability Class: Cognitive Difficulty
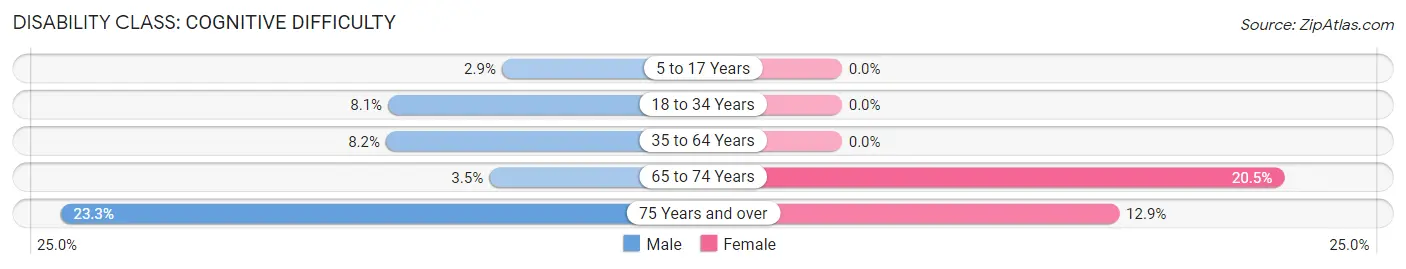
| Age Bracket | Male | Female |
| 5 to 17 Years | 7 (2.9%) | 0 (0.0%) |
| 18 to 34 Years | 31 (8.1%) | 0 (0.0%) |
| 35 to 64 Years | 108 (8.2%) | 0 (0.0%) |
| 65 to 74 Years | 9 (3.5%) | 87 (20.5%) |
| 75 Years and over | 21 (23.3%) | 22 (12.9%) |
Disability Class: Ambulatory Difficulty
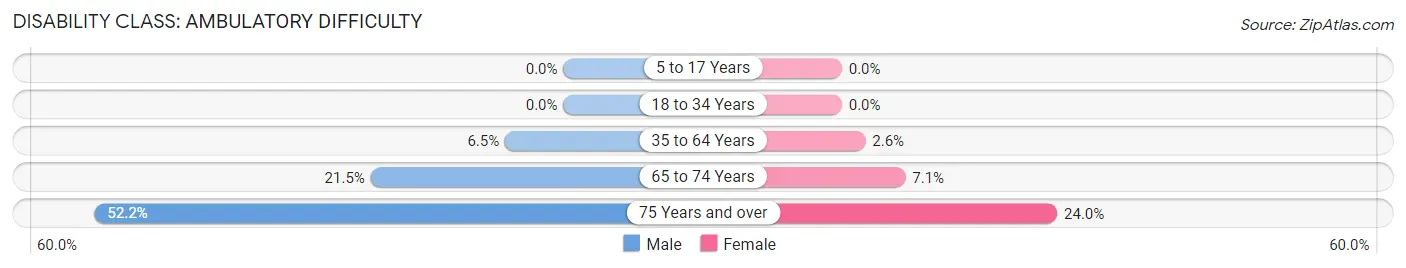
| Age Bracket | Male | Female |
| 5 to 17 Years | 0 (0.0%) | 0 (0.0%) |
| 18 to 34 Years | 0 (0.0%) | 0 (0.0%) |
| 35 to 64 Years | 85 (6.5%) | 30 (2.6%) |
| 65 to 74 Years | 56 (21.5%) | 30 (7.1%) |
| 75 Years and over | 47 (52.2%) | 41 (24.0%) |
Disability Class: Self-Care Difficulty
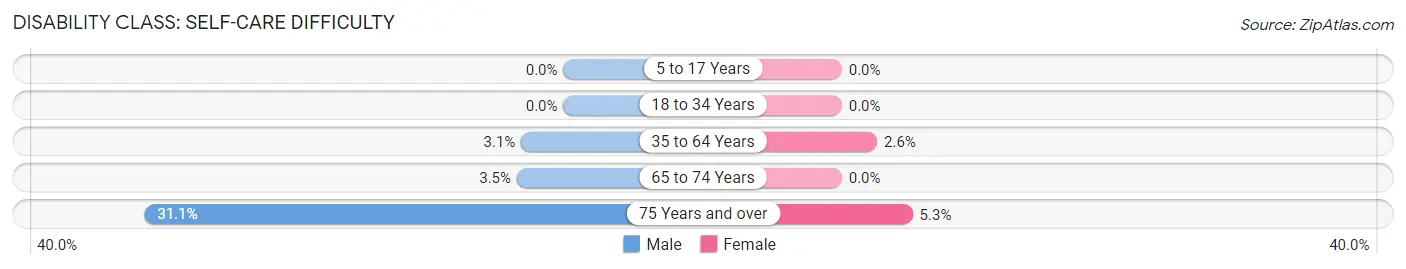
| Age Bracket | Male | Female |
| 5 to 17 Years | 0 (0.0%) | 0 (0.0%) |
| 18 to 34 Years | 0 (0.0%) | 0 (0.0%) |
| 35 to 64 Years | 41 (3.1%) | 30 (2.6%) |
| 65 to 74 Years | 9 (3.5%) | 0 (0.0%) |
| 75 Years and over | 28 (31.1%) | 9 (5.3%) |
Technology Access in Ocean Bluff Brant Rock
Computing Device Access in Ocean Bluff Brant Rock
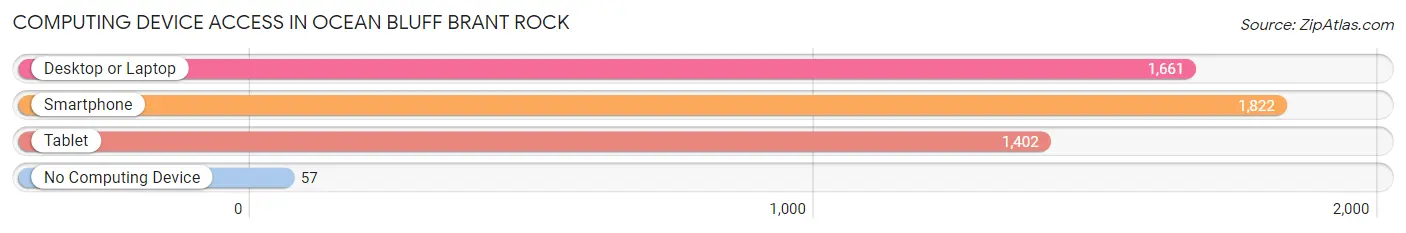
| Device Type | # Households | % Households |
| Desktop or Laptop | 1,661 | 81.7% |
| Smartphone | 1,822 | 89.7% |
| Tablet | 1,402 | 69.0% |
| No Computing Device | 57 | 2.8% |
| Total | 2,032 | 100.0% |
Internet Access in Ocean Bluff Brant Rock
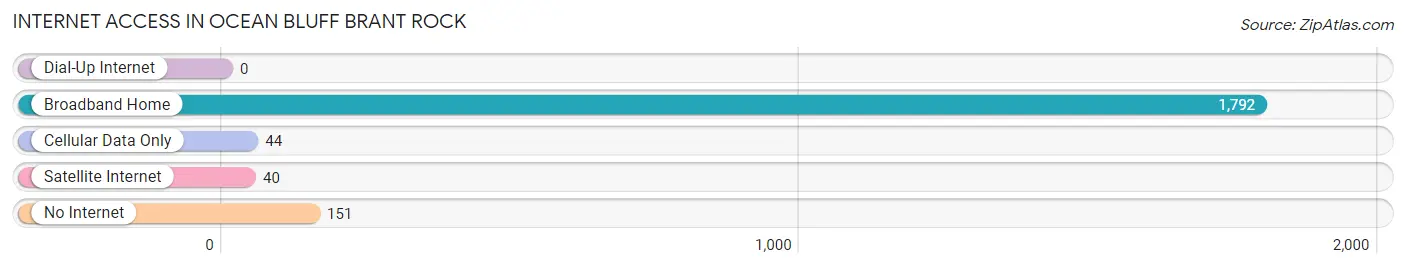
| Internet Type | # Households | % Households |
| Dial-Up Internet | 0 | 0.0% |
| Broadband Home | 1,792 | 88.2% |
| Cellular Data Only | 44 | 2.2% |
| Satellite Internet | 40 | 2.0% |
| No Internet | 151 | 7.4% |
| Total | 2,032 | 100.0% |
Ocean Bluff Brant Rock Summary
History
Ocean Bluff-Brant Rock is a small coastal village located in Plymouth County, Massachusetts. It is situated on the south shore of Massachusetts, approximately 25 miles south of Boston. The area was first settled in the early 1600s by English colonists, who named it “Brant Rock” after the brant, a type of sea bird. The area was primarily used for fishing and farming until the late 1800s, when it began to develop into a summer resort community.
In the early 1900s, the area was known as “Ocean Bluff” and was home to several large summer estates. These estates were owned by wealthy Bostonians who would come to the area to escape the city’s summer heat. The area was also popular with vacationers, who would come to enjoy the beaches and the ocean views.
In the 1920s, the area began to develop into a year-round community. The first permanent residents were fishermen and farmers, who were attracted to the area by its natural beauty and its proximity to Boston. The area was also popular with artists and writers, who were drawn to the area’s picturesque scenery.
In the 1950s, the area began to experience a period of rapid growth. The population increased from just over 1,000 in 1950 to over 5,000 in 1960. This growth was largely due to the development of the nearby town of Marshfield, which provided employment opportunities for many of the area’s residents.
Geography
Ocean Bluff-Brant Rock is located on the south shore of Massachusetts, approximately 25 miles south of Boston. The area is bordered by the towns of Marshfield to the north, Duxbury to the east, and Plymouth to the south. The area is situated on a peninsula, with the Atlantic Ocean to the east and the Massachusetts Bay to the west.
The area is characterized by its rocky coastline, which is dotted with small coves and inlets. The area is also home to several small islands, including Bird Island, which is located just off the coast. The area is also home to several freshwater ponds, including the Great Pond and the Little Pond.
Economy
The economy of Ocean Bluff-Brant Rock is largely based on tourism and fishing. The area is home to several popular beaches, which attract visitors from all over the region. The area is also home to several seafood restaurants, which serve fresh seafood caught in the local waters.
The area is also home to several small businesses, including a few retail stores, a marina, and a few restaurants. The area is also home to several small boatyards, which provide boat repair and maintenance services.
Demographics
As of the 2010 census, the population of Ocean Bluff-Brant Rock was 5,845. The population is largely white (94.3%), with small percentages of African American (2.2%), Asian (1.2%), and Hispanic (1.3%) residents. The median household income is $68,945, and the median home value is $521,000. The area is largely populated by families, with over half of the population (54.3%) being married couples.
Common Questions
What is the Total Population of Ocean Bluff Brant Rock?
Total Population of Ocean Bluff Brant Rock is 4,637.
What is the Total Male Population of Ocean Bluff Brant Rock?
Total Male Population of Ocean Bluff Brant Rock is 2,344.
What is the Total Female Population of Ocean Bluff Brant Rock?
Total Female Population of Ocean Bluff Brant Rock is 2,293.
What is the Ratio of Males per 100 Females in Ocean Bluff Brant Rock?
There are 102.22 Males per 100 Females in Ocean Bluff Brant Rock.
What is the Ratio of Females per 100 Males in Ocean Bluff Brant Rock?
There are 97.82 Females per 100 Males in Ocean Bluff Brant Rock.
What is the Median Population Age in Ocean Bluff Brant Rock?
Median Population Age in Ocean Bluff Brant Rock is 54.1 Years.
What is the Average Family Size in Ocean Bluff Brant Rock
Average Family Size in Ocean Bluff Brant Rock is 2.8 People.
What is the Average Household Size in Ocean Bluff Brant Rock
Average Household Size in Ocean Bluff Brant Rock is 2.3 People.
What is Per Capita Income in Ocean Bluff Brant Rock?
Per Capita income in Ocean Bluff Brant Rock is $52,831.
What is the Median Family Income in Ocean Bluff Brant Rock?
Median Family Income in Ocean Bluff Brant Rock is $130,156.
What is the Median Household income in Ocean Bluff Brant Rock?
Median Household Income in Ocean Bluff Brant Rock is $106,528.
What is Income or Wage Gap in Ocean Bluff Brant Rock?
Income or Wage Gap in Ocean Bluff Brant Rock is 7.8%.
Women in Ocean Bluff Brant Rock earn 92.2 cents for every dollar earned by a man.
What is Inequality or Gini Index in Ocean Bluff Brant Rock?
Inequality or Gini Index in Ocean Bluff Brant Rock is 0.42.
How Large is the Labor Force in Ocean Bluff Brant Rock?
There are 2,827 People in the Labor Forcein in Ocean Bluff Brant Rock.
What is the Percentage of People in the Labor Force in Ocean Bluff Brant Rock?
67.3% of People are in the Labor Force in Ocean Bluff Brant Rock.
What is the Unemployment Rate in Ocean Bluff Brant Rock?
Unemployment Rate in Ocean Bluff Brant Rock is 6.3%.