Cities with the Highest Percentage of Immigrants from Western Africa in Massachusetts
RELATED REPORTS & OPTIONS
Western Africa
Massachusetts
Compare Cities
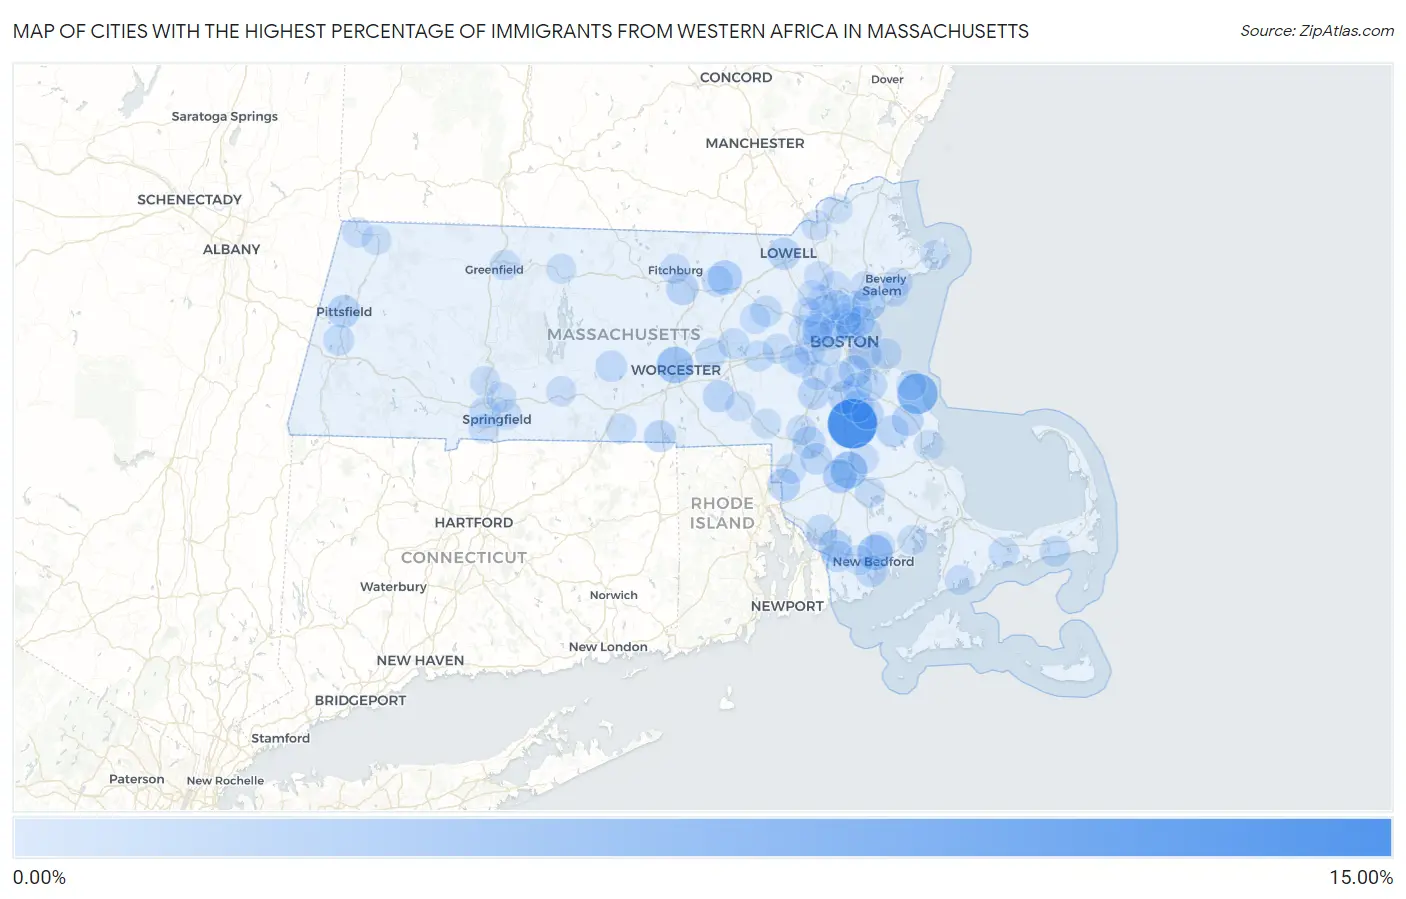
Map of Cities with the Highest Percentage of Immigrants from Western Africa in Massachusetts
0.00%
15.00%
Cities with the Highest Percentage of Immigrants from Western Africa in Massachusetts
| City | Western Africa | vs State | vs National | |
| 1. | Brockton | 12.03% | 0.88%(+11.2)#52 | 0.30%(+11.7)#899 |
| 2. | Scituate | 6.30% | 0.88%(+5.43)#53 | 0.30%(+6.01)#900 |
| 3. | Raynham Center | 4.08% | 0.88%(+3.20)#54 | 0.30%(+3.78)#901 |
| 4. | Worcester | 3.92% | 0.88%(+3.04)#55 | 0.30%(+3.62)#902 |
| 5. | New Bedford | 3.17% | 0.88%(+2.29)#56 | 0.30%(+2.87)#1,131 |
| 6. | Ayer | 2.49% | 0.88%(+1.62)#57 | 0.30%(+2.19)#1,132 |
| 7. | Taunton | 2.39% | 0.88%(+1.52)#58 | 0.30%(+2.10)#1,133 |
| 8. | Lynn | 1.99% | 0.88%(+1.11)#59 | 0.30%(+1.69)#1,134 |
| 9. | Randolph Town | 1.90% | 0.88%(+1.02)#60 | 0.30%(+1.60)#1,135 |
| 10. | Boston | 1.89% | 0.88%(+1.01)#61 | 0.30%(+1.59)#1,136 |
| 11. | Fall River | 1.85% | 0.88%(+0.973)#62 | 0.30%(+1.55)#1,137 |
| 12. | North Seekonk | 1.72% | 0.88%(+0.848)#63 | 0.30%(+1.43)#1,138 |
| 13. | Pittsfield | 1.60% | 0.88%(+0.724)#64 | 0.30%(+1.30)#1,139 |
| 14. | Leominster | 1.56% | 0.88%(+0.687)#65 | 0.30%(+1.27)#1,140 |
| 15. | Mansfield Center | 1.56% | 0.88%(+0.684)#66 | 0.30%(+1.26)#1,141 |
| 16. | Lowell | 1.38% | 0.88%(+0.505)#67 | 0.30%(+1.08)#1,142 |
| 17. | Quincy | 1.33% | 0.88%(+0.452)#68 | 0.30%(+1.03)#1,143 |
| 18. | Hanson | 1.29% | 0.88%(+0.417)#69 | 0.30%(+0.996)#1,144 |
| 19. | Norwood | 1.24% | 0.88%(+0.362)#70 | 0.30%(+0.940)#1,145 |
| 20. | Upton | 1.19% | 0.88%(+0.318)#71 | 0.30%(+0.896)#1,146 |
| 21. | Holbrook | 1.16% | 0.88%(+0.279)#72 | 0.30%(+0.858)#1,147 |
| 22. | North Pembroke | 1.14% | 0.88%(+0.262)#73 | 0.30%(+0.840)#1,148 |
| 23. | Webster | 1.13% | 0.88%(+0.249)#74 | 0.30%(+0.828)#1,149 |
| 24. | Abington | 1.12% | 0.88%(+0.247)#75 | 0.30%(+0.826)#1,150 |
| 25. | Bliss Corner | 1.07% | 0.88%(+0.197)#76 | 0.30%(+0.775)#1,151 |
| 26. | North Westport | 1.05% | 0.88%(+0.175)#77 | 0.30%(+0.754)#1,152 |
| 27. | Norton Center | 1.05% | 0.88%(+0.170)#78 | 0.30%(+0.749)#1,153 |
| 28. | Weymouth Town | 1.00% | 0.88%(+0.127)#79 | 0.30%(+0.706)#1,154 |
| 29. | North Brookfield | 0.94% | 0.88%(+0.067)#80 | 0.30%(+0.646)#1,155 |
| 30. | Winthrop Town | 0.85% | 0.88%(-0.030)#81 | 0.30%(+0.548)#1,156 |
| 31. | West Springfield Town | 0.84% | 0.88%(-0.038)#82 | 0.30%(+0.540)#1,157 |
| 32. | Northborough | 0.78% | 0.88%(-0.098)#83 | 0.30%(+0.481)#1,158 |
| 33. | Somerset | 0.73% | 0.88%(-0.143)#84 | 0.30%(+0.436)#1,159 |
| 34. | West Concord | 0.73% | 0.88%(-0.148)#85 | 0.30%(+0.431)#1,160 |
| 35. | Devens | 0.68% | 0.88%(-0.196)#86 | 0.30%(+0.383)#1,161 |
| 36. | Marlborough | 0.66% | 0.88%(-0.219)#87 | 0.30%(+0.359)#1,162 |
| 37. | Lenox | 0.65% | 0.88%(-0.226)#88 | 0.30%(+0.353)#1,163 |
| 38. | Amherst | 0.63% | 0.88%(-0.250)#89 | 0.30%(+0.328)#1,164 |
| 39. | Everett | 0.61% | 0.88%(-0.264)#90 | 0.30%(+0.314)#1,165 |
| 40. | Dennis Port | 0.58% | 0.88%(-0.301)#91 | 0.30%(+0.278)#1,166 |
| 41. | Framingham | 0.52% | 0.88%(-0.355)#92 | 0.30%(+0.223)#1,167 |
| 42. | Barnstable Town | 0.48% | 0.88%(-0.392)#93 | 0.30%(+0.187)#1,168 |
| 43. | Milton | 0.47% | 0.88%(-0.405)#94 | 0.30%(+0.173)#1,169 |
| 44. | Saugus | 0.45% | 0.88%(-0.425)#95 | 0.30%(+0.154)#1,170 |
| 45. | Cambridge | 0.43% | 0.88%(-0.449)#96 | 0.30%(+0.130)#1,171 |
| 46. | Hull | 0.42% | 0.88%(-0.461)#97 | 0.30%(+0.118)#1,172 |
| 47. | Southbridge Town | 0.41% | 0.88%(-0.469)#98 | 0.30%(+0.110)#1,173 |
| 48. | Reading | 0.40% | 0.88%(-0.475)#99 | 0.30%(+0.104)#1,174 |
| 49. | Maynard | 0.39% | 0.88%(-0.483)#100 | 0.30%(+0.096)#1,175 |
| 50. | Salem | 0.37% | 0.88%(-0.504)#101 | 0.30%(+0.075)#1,176 |
| 51. | Malden | 0.35% | 0.88%(-0.528)#102 | 0.30%(+0.051)#1,177 |
| 52. | Newton | 0.35% | 0.88%(-0.529)#103 | 0.30%(+0.049)#1,178 |
| 53. | Springfield | 0.34% | 0.88%(-0.538)#104 | 0.30%(+0.041)#1,179 |
| 54. | Somerville | 0.33% | 0.88%(-0.543)#105 | 0.30%(+0.035)#1,180 |
| 55. | North Lakeville | 0.33% | 0.88%(-0.546)#106 | 0.30%(+0.032)#1,181 |
| 56. | Turners Falls | 0.31% | 0.88%(-0.564)#107 | 0.30%(+0.015)#1,182 |
| 57. | Methuen Town | 0.31% | 0.88%(-0.564)#108 | 0.30%(+0.015)#1,183 |
| 58. | Winchester | 0.31% | 0.88%(-0.565)#109 | 0.30%(+0.014)#1,184 |
| 59. | North Scituate | 0.30% | 0.88%(-0.577)#110 | 0.30%(+0.002)#1,185 |
| 60. | Bridgewater Town | 0.29% | 0.88%(-0.585)#111 | 0.30%(-0.007)#1,186 |
| 61. | Williamstown | 0.29% | 0.88%(-0.587)#112 | 0.30%(-0.009)#1,187 |
| 62. | Acushnet Center | 0.28% | 0.88%(-0.592)#113 | 0.30%(-0.013)#1,188 |
| 63. | Holyoke | 0.26% | 0.88%(-0.615)#114 | 0.30%(-0.036)#1,189 |
| 64. | Melrose | 0.26% | 0.88%(-0.619)#115 | 0.30%(-0.040)#1,190 |
| 65. | Chelsea | 0.24% | 0.88%(-0.636)#116 | 0.30%(-0.057)#1,191 |
| 66. | Arlington | 0.24% | 0.88%(-0.639)#117 | 0.30%(-0.060)#1,192 |
| 67. | Agawam Town | 0.22% | 0.88%(-0.653)#118 | 0.30%(-0.074)#1,193 |
| 68. | Attleboro | 0.22% | 0.88%(-0.656)#119 | 0.30%(-0.078)#1,194 |
| 69. | Palmer Town | 0.22% | 0.88%(-0.659)#120 | 0.30%(-0.080)#1,195 |
| 70. | Beverly | 0.22% | 0.88%(-0.659)#121 | 0.30%(-0.081)#1,196 |
| 71. | South Duxbury | 0.21% | 0.88%(-0.671)#122 | 0.30%(-0.092)#1,197 |
| 72. | Franklin Town | 0.20% | 0.88%(-0.675)#123 | 0.30%(-0.096)#1,198 |
| 73. | Fitchburg | 0.20% | 0.88%(-0.677)#124 | 0.30%(-0.098)#1,199 |
| 74. | Revere | 0.19% | 0.88%(-0.690)#125 | 0.30%(-0.111)#1,200 |
| 75. | East Falmouth | 0.18% | 0.88%(-0.693)#126 | 0.30%(-0.115)#1,201 |
| 76. | Waltham | 0.18% | 0.88%(-0.696)#127 | 0.30%(-0.117)#1,202 |
| 77. | Needham | 0.18% | 0.88%(-0.701)#128 | 0.30%(-0.122)#1,203 |
| 78. | Watertown Town | 0.17% | 0.88%(-0.703)#129 | 0.30%(-0.124)#1,204 |
| 79. | Woburn | 0.17% | 0.88%(-0.706)#130 | 0.30%(-0.127)#1,205 |
| 80. | Chicopee | 0.17% | 0.88%(-0.710)#131 | 0.30%(-0.132)#1,206 |
| 81. | Lexington | 0.16% | 0.88%(-0.713)#132 | 0.30%(-0.134)#1,207 |
| 82. | Dedham | 0.16% | 0.88%(-0.713)#133 | 0.30%(-0.135)#1,208 |
| 83. | Foxborough | 0.16% | 0.88%(-0.718)#134 | 0.30%(-0.139)#1,209 |
| 84. | North Adams | 0.15% | 0.88%(-0.722)#135 | 0.30%(-0.143)#1,210 |
| 85. | Smith Mills | 0.15% | 0.88%(-0.723)#136 | 0.30%(-0.144)#1,211 |
| 86. | Cochituate | 0.14% | 0.88%(-0.732)#137 | 0.30%(-0.154)#1,212 |
| 87. | Peabody | 0.14% | 0.88%(-0.740)#138 | 0.30%(-0.161)#1,213 |
| 88. | Orange | 0.13% | 0.88%(-0.742)#139 | 0.30%(-0.164)#1,214 |
| 89. | Belmont | 0.13% | 0.88%(-0.747)#140 | 0.30%(-0.168)#1,215 |
| 90. | Brookline | 0.13% | 0.88%(-0.749)#141 | 0.30%(-0.170)#1,216 |
| 91. | Wellesley | 0.10% | 0.88%(-0.773)#142 | 0.30%(-0.194)#1,217 |
| 92. | Marion Center | 0.10% | 0.88%(-0.774)#143 | 0.30%(-0.196)#1,218 |
| 93. | Gloucester | 0.097% | 0.88%(-0.779)#144 | 0.30%(-0.200)#1,219 |
| 94. | Braintree Town | 0.095% | 0.88%(-0.781)#145 | 0.30%(-0.202)#1,220 |
| 95. | North Attleborough | 0.094% | 0.88%(-0.782)#146 | 0.30%(-0.203)#1,221 |
| 96. | Milford | 0.080% | 0.88%(-0.797)#147 | 0.30%(-0.218)#1,222 |
| 97. | Haverhill | 0.079% | 0.88%(-0.798)#148 | 0.30%(-0.219)#1,223 |
| 98. | Wilmington | 0.073% | 0.88%(-0.803)#149 | 0.30%(-0.224)#1,224 |
| 99. | Burlington | 0.061% | 0.88%(-0.815)#150 | 0.30%(-0.237)#1,225 |
| 100. | Stoneham | 0.061% | 0.88%(-0.815)#151 | 0.30%(-0.237)#1,226 |
Common Questions
What are the Top 10 Cities with the Highest Percentage of Immigrants from Western Africa in Massachusetts?
Top 10 Cities with the Highest Percentage of Immigrants from Western Africa in Massachusetts are:
#1
12.03%
#2
6.30%
#3
4.08%
#4
3.92%
#5
3.17%
#6
2.49%
#7
2.39%
#8
1.99%
#9
1.90%
#10
1.89%
What city has the Highest Percentage of Immigrants from Western Africa in Massachusetts?
Brockton has the Highest Percentage of Immigrants from Western Africa in Massachusetts with 12.03%.
What is the Percentage of Immigrants from Western Africa in the State of Massachusetts?
Percentage of Immigrants from Western Africa in Massachusetts is 0.88%.
What is the Percentage of Immigrants from Western Africa in the United States?
Percentage of Immigrants from Western Africa in the United States is 0.30%.