Cities with the Highest Percentage of Population Employed in Agriculture, Fishing & Hunting in Massachusetts
RELATED REPORTS & OPTIONS
Agriculture, Fishing & Hunting
Massachusetts
Compare Cities
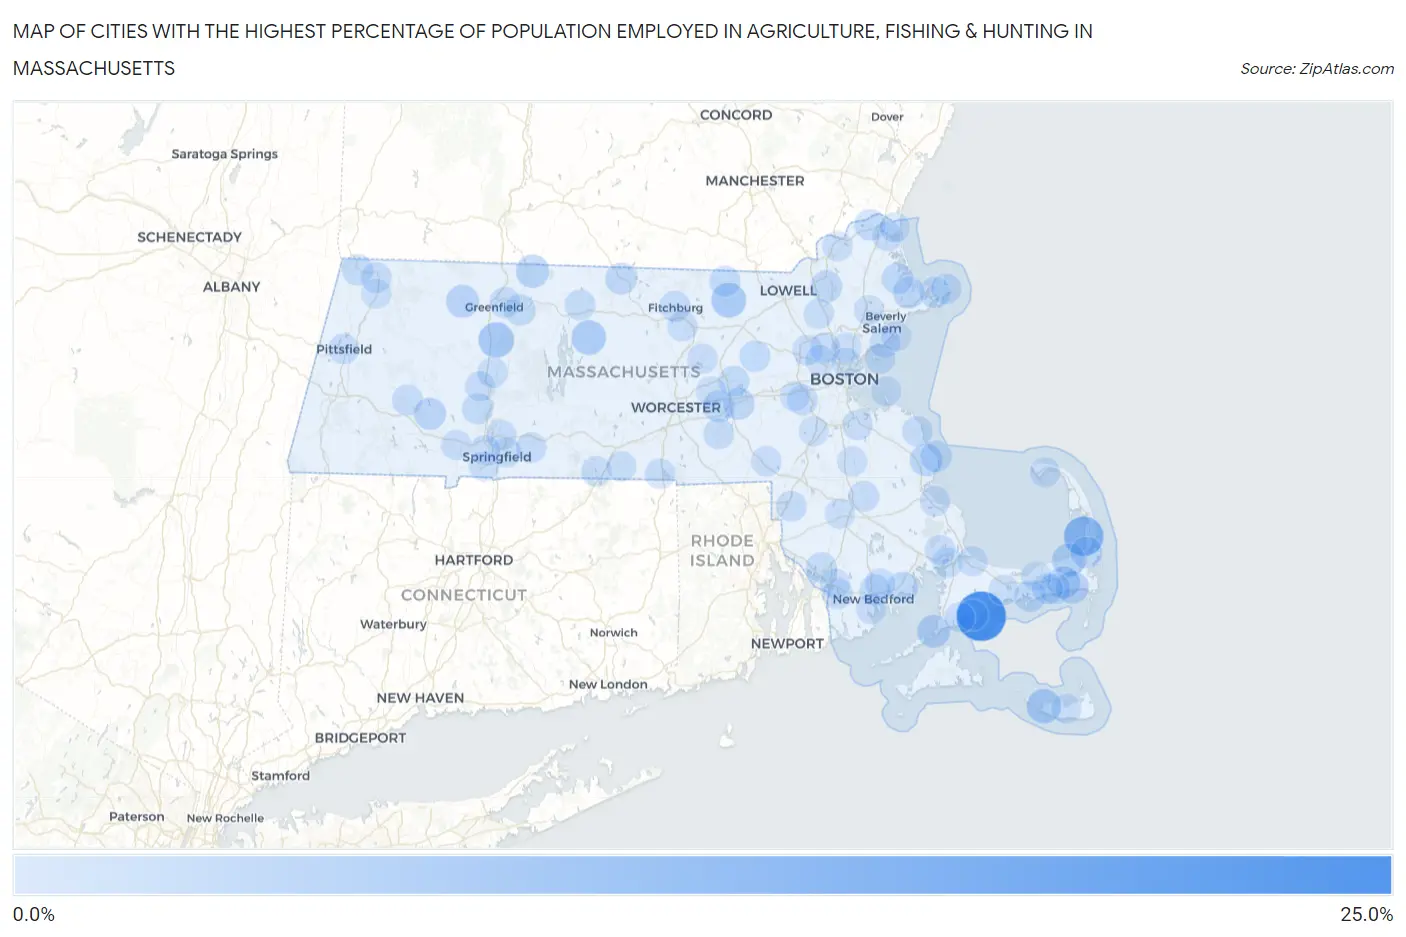
Map of Cities with the Highest Percentage of Population Employed in Agriculture, Fishing & Hunting in Massachusetts
0.0%
25.0%
Cities with the Highest Percentage of Population Employed in Agriculture, Fishing & Hunting in Massachusetts
| City | % Employed | vs State | vs National | |
| 1. | Popponesset | 20.6% | 0.39%(+20.2)#1 | 1.2%(+19.4)#963 |
| 2. | North Eastham | 10.0% | 0.39%(+9.62)#2 | 1.2%(+8.81)#2,420 |
| 3. | Oak Bluffs | 6.7% | 0.39%(+6.29)#3 | 1.2%(+5.49)#3,745 |
| 4. | South Deerfield | 5.7% | 0.39%(+5.29)#4 | 1.2%(+4.48)#4,316 |
| 5. | Groton | 5.0% | 0.39%(+4.61)#5 | 1.2%(+3.80)#4,830 |
| 6. | Petersham | 4.8% | 0.39%(+4.43)#6 | 1.2%(+3.63)#4,979 |
| 7. | Madaket | 4.7% | 0.39%(+4.29)#7 | 1.2%(+3.49)#5,096 |
| 8. | Brewster | 3.6% | 0.39%(+3.25)#8 | 1.2%(+2.45)#6,198 |
| 9. | Northfield | 3.3% | 0.39%(+2.93)#9 | 1.2%(+2.12)#6,608 |
| 10. | Woods Hole | 3.1% | 0.39%(+2.74)#10 | 1.2%(+1.93)#6,850 |
| 11. | Shelburne Falls | 3.0% | 0.39%(+2.58)#11 | 1.2%(+1.77)#7,077 |
| 12. | Harwich Port | 3.0% | 0.39%(+2.57)#12 | 1.2%(+1.76)#7,094 |
| 13. | Northwest Harwich | 2.9% | 0.39%(+2.48)#13 | 1.2%(+1.68)#7,217 |
| 14. | Marshfield | 2.6% | 0.39%(+2.21)#14 | 1.2%(+1.41)#7,664 |
| 15. | Huntington | 2.3% | 0.39%(+1.87)#15 | 1.2%(+1.06)#8,297 |
| 16. | Essex | 2.1% | 0.39%(+1.74)#16 | 1.2%(+0.934)#8,575 |
| 17. | Westborough | 2.1% | 0.39%(+1.68)#17 | 1.2%(+0.875)#8,691 |
| 18. | Cordaville | 2.0% | 0.39%(+1.63)#18 | 1.2%(+0.828)#8,788 |
| 19. | Orleans | 2.0% | 0.39%(+1.56)#19 | 1.2%(+0.756)#8,948 |
| 20. | Winchendon | 1.9% | 0.39%(+1.50)#20 | 1.2%(+0.699)#9,081 |
| 21. | West Yarmouth | 1.8% | 0.39%(+1.45)#21 | 1.2%(+0.643)#9,226 |
| 22. | Andover | 1.8% | 0.39%(+1.38)#22 | 1.2%(+0.574)#9,375 |
| 23. | Ocean Bluff Brant Rock | 1.7% | 0.39%(+1.30)#23 | 1.2%(+0.499)#9,565 |
| 24. | Amesbury Town | 1.5% | 0.39%(+1.15)#24 | 1.2%(+0.341)#9,980 |
| 25. | Ipswich | 1.5% | 0.39%(+1.13)#25 | 1.2%(+0.325)#10,032 |
| 26. | Greenfield | 1.5% | 0.39%(+1.13)#26 | 1.2%(+0.323)#10,042 |
| 27. | Mattapoisett Center | 1.5% | 0.39%(+1.08)#27 | 1.2%(+0.279)#10,166 |
| 28. | Gloucester | 1.4% | 0.39%(+1.02)#28 | 1.2%(+0.211)#10,369 |
| 29. | Williamstown | 1.4% | 0.39%(+0.989)#29 | 1.2%(+0.184)#10,433 |
| 30. | Seabrook | 1.4% | 0.39%(+0.971)#30 | 1.2%(+0.167)#10,497 |
| 31. | New Bedford | 1.3% | 0.39%(+0.954)#31 | 1.2%(+0.149)#10,554 |
| 32. | Millers Falls | 1.3% | 0.39%(+0.911)#32 | 1.2%(+0.107)#10,674 |
| 33. | Maynard | 1.3% | 0.39%(+0.873)#33 | 1.2%(+0.068)#10,806 |
| 34. | Pepperell | 1.3% | 0.39%(+0.872)#34 | 1.2%(+0.068)#10,811 |
| 35. | Dennis Port | 1.3% | 0.39%(+0.858)#35 | 1.2%(+0.054)#10,856 |
| 36. | Easthampton Town | 1.2% | 0.39%(+0.804)#36 | 1.2%(-0.000)#11,033 |
| 37. | Turners Falls | 1.2% | 0.39%(+0.773)#37 | 1.2%(-0.031)#11,168 |
| 38. | Marlborough | 1.1% | 0.39%(+0.752)#38 | 1.2%(-0.053)#11,229 |
| 39. | West Dennis | 1.1% | 0.39%(+0.697)#39 | 1.2%(-0.107)#11,427 |
| 40. | Fitchburg | 0.99% | 0.39%(+0.593)#40 | 1.2%(-0.211)#11,834 |
| 41. | Upton | 0.90% | 0.39%(+0.508)#41 | 1.2%(-0.297)#12,169 |
| 42. | North Westport | 0.90% | 0.39%(+0.506)#42 | 1.2%(-0.299)#12,181 |
| 43. | Somerset | 0.90% | 0.39%(+0.502)#43 | 1.2%(-0.302)#12,197 |
| 44. | Needham | 0.88% | 0.39%(+0.489)#44 | 1.2%(-0.315)#12,256 |
| 45. | Athol | 0.87% | 0.39%(+0.474)#45 | 1.2%(-0.330)#12,320 |
| 46. | Bridgewater Town | 0.86% | 0.39%(+0.470)#46 | 1.2%(-0.335)#12,335 |
| 47. | Wilbraham | 0.86% | 0.39%(+0.465)#47 | 1.2%(-0.340)#12,353 |
| 48. | Scituate | 0.85% | 0.39%(+0.457)#48 | 1.2%(-0.348)#12,387 |
| 49. | Chester | 0.84% | 0.39%(+0.443)#49 | 1.2%(-0.361)#12,445 |
| 50. | North Adams | 0.82% | 0.39%(+0.423)#50 | 1.2%(-0.381)#12,537 |
| 51. | Attleboro | 0.81% | 0.39%(+0.411)#51 | 1.2%(-0.393)#12,595 |
| 52. | Rockport | 0.80% | 0.39%(+0.410)#52 | 1.2%(-0.395)#12,601 |
| 53. | Pittsfield | 0.73% | 0.39%(+0.333)#53 | 1.2%(-0.471)#12,956 |
| 54. | Buzzards Bay | 0.72% | 0.39%(+0.323)#54 | 1.2%(-0.482)#13,015 |
| 55. | East Falmouth | 0.72% | 0.39%(+0.323)#55 | 1.2%(-0.482)#13,019 |
| 56. | Lexington | 0.68% | 0.39%(+0.284)#56 | 1.2%(-0.520)#13,212 |
| 57. | Hatfield | 0.67% | 0.39%(+0.279)#57 | 1.2%(-0.525)#13,238 |
| 58. | Clinton | 0.67% | 0.39%(+0.279)#58 | 1.2%(-0.526)#13,240 |
| 59. | Holland | 0.64% | 0.39%(+0.248)#59 | 1.2%(-0.557)#13,409 |
| 60. | Franklin Town | 0.63% | 0.39%(+0.231)#60 | 1.2%(-0.573)#13,526 |
| 61. | White Island Shores | 0.63% | 0.39%(+0.231)#61 | 1.2%(-0.574)#13,530 |
| 62. | Bliss Corner | 0.59% | 0.39%(+0.197)#62 | 1.2%(-0.607)#13,716 |
| 63. | Acushnet Center | 0.58% | 0.39%(+0.180)#63 | 1.2%(-0.624)#13,818 |
| 64. | Webster | 0.57% | 0.39%(+0.180)#64 | 1.2%(-0.625)#13,826 |
| 65. | Barnstable Town | 0.57% | 0.39%(+0.176)#65 | 1.2%(-0.629)#13,844 |
| 66. | Leominster | 0.56% | 0.39%(+0.170)#66 | 1.2%(-0.635)#13,881 |
| 67. | Sandwich | 0.55% | 0.39%(+0.154)#67 | 1.2%(-0.651)#13,982 |
| 68. | Newburyport | 0.54% | 0.39%(+0.145)#68 | 1.2%(-0.660)#14,039 |
| 69. | Swampscott | 0.52% | 0.39%(+0.123)#69 | 1.2%(-0.682)#14,167 |
| 70. | Chicopee | 0.51% | 0.39%(+0.112)#70 | 1.2%(-0.692)#14,242 |
| 71. | Northampton | 0.50% | 0.39%(+0.102)#71 | 1.2%(-0.703)#14,305 |
| 72. | Winchester | 0.49% | 0.39%(+0.099)#72 | 1.2%(-0.705)#14,325 |
| 73. | Nahant | 0.48% | 0.39%(+0.082)#73 | 1.2%(-0.722)#14,422 |
| 74. | Braintree Town | 0.48% | 0.39%(+0.082)#74 | 1.2%(-0.723)#14,426 |
| 75. | Southbridge Town | 0.46% | 0.39%(+0.064)#75 | 1.2%(-0.740)#14,510 |
| 76. | Springfield | 0.46% | 0.39%(+0.064)#76 | 1.2%(-0.741)#14,512 |
| 77. | Provincetown | 0.46% | 0.39%(+0.063)#77 | 1.2%(-0.741)#14,517 |
| 78. | West Springfield Town | 0.45% | 0.39%(+0.056)#78 | 1.2%(-0.749)#14,568 |
| 79. | Plymouth | 0.45% | 0.39%(+0.053)#79 | 1.2%(-0.752)#14,590 |
| 80. | Westfield | 0.44% | 0.39%(+0.047)#80 | 1.2%(-0.757)#14,621 |
| 81. | Wilmington | 0.42% | 0.39%(+0.025)#81 | 1.2%(-0.780)#14,773 |
| 82. | Salisbury | 0.41% | 0.39%(+0.010)#82 | 1.2%(-0.794)#14,857 |
| 83. | Agawam Town | 0.40% | 0.39%(+0.006)#83 | 1.2%(-0.799)#14,883 |
| 84. | Yarmouth Port | 0.40% | 0.39%(+0.001)#84 | 1.2%(-0.804)#14,924 |
| 85. | Haverhill | 0.38% | 0.39%(-0.012)#85 | 1.2%(-0.816)#15,000 |
| 86. | Northborough | 0.37% | 0.39%(-0.023)#86 | 1.2%(-0.828)#15,081 |
| 87. | Melrose | 0.36% | 0.39%(-0.032)#87 | 1.2%(-0.836)#15,138 |
| 88. | Marblehead | 0.36% | 0.39%(-0.033)#88 | 1.2%(-0.838)#15,144 |
| 89. | Fall River | 0.36% | 0.39%(-0.034)#89 | 1.2%(-0.839)#15,154 |
| 90. | Nantucket | 0.35% | 0.39%(-0.040)#90 | 1.2%(-0.844)#15,196 |
| 91. | Danvers | 0.35% | 0.39%(-0.040)#91 | 1.2%(-0.845)#15,201 |
| 92. | Amherst | 0.34% | 0.39%(-0.055)#92 | 1.2%(-0.859)#15,309 |
| 93. | Wellesley | 0.34% | 0.39%(-0.059)#93 | 1.2%(-0.864)#15,354 |
| 94. | Taunton | 0.33% | 0.39%(-0.062)#94 | 1.2%(-0.866)#15,369 |
| 95. | Hull | 0.29% | 0.39%(-0.104)#95 | 1.2%(-0.908)#15,679 |
| 96. | Norwood | 0.28% | 0.39%(-0.110)#96 | 1.2%(-0.915)#15,732 |
| 97. | Adams | 0.27% | 0.39%(-0.127)#97 | 1.2%(-0.931)#15,850 |
| 98. | Brockton | 0.27% | 0.39%(-0.127)#98 | 1.2%(-0.932)#15,854 |
| 99. | Arlington | 0.24% | 0.39%(-0.152)#99 | 1.2%(-0.957)#16,019 |
| 100. | Everett | 0.24% | 0.39%(-0.153)#100 | 1.2%(-0.957)#16,023 |
Common Questions
What are the Top 10 Cities with the Highest Percentage of Population Employed in Agriculture, Fishing & Hunting in Massachusetts?
Top 10 Cities with the Highest Percentage of Population Employed in Agriculture, Fishing & Hunting in Massachusetts are:
#1
20.6%
#2
10.0%
#3
5.7%
#4
5.0%
#5
4.8%
#6
4.7%
#7
3.6%
#8
3.3%
#9
3.1%
#10
3.0%
What city has the Highest Percentage of Population Employed in Agriculture, Fishing & Hunting in Massachusetts?
Popponesset has the Highest Percentage of Population Employed in Agriculture, Fishing & Hunting in Massachusetts with 20.6%.
What is the Percentage of Population Employed in Agriculture, Fishing & Hunting in the State of Massachusetts?
Percentage of Population Employed in Agriculture, Fishing & Hunting in Massachusetts is 0.39%.
What is the Percentage of Population Employed in Agriculture, Fishing & Hunting in the United States?
Percentage of Population Employed in Agriculture, Fishing & Hunting in the United States is 1.2%.