Cities with the Highest Percentage of Population Employed in Health Technologists in Massachusetts
RELATED REPORTS & OPTIONS
Health Technologists
Massachusetts
Compare Cities
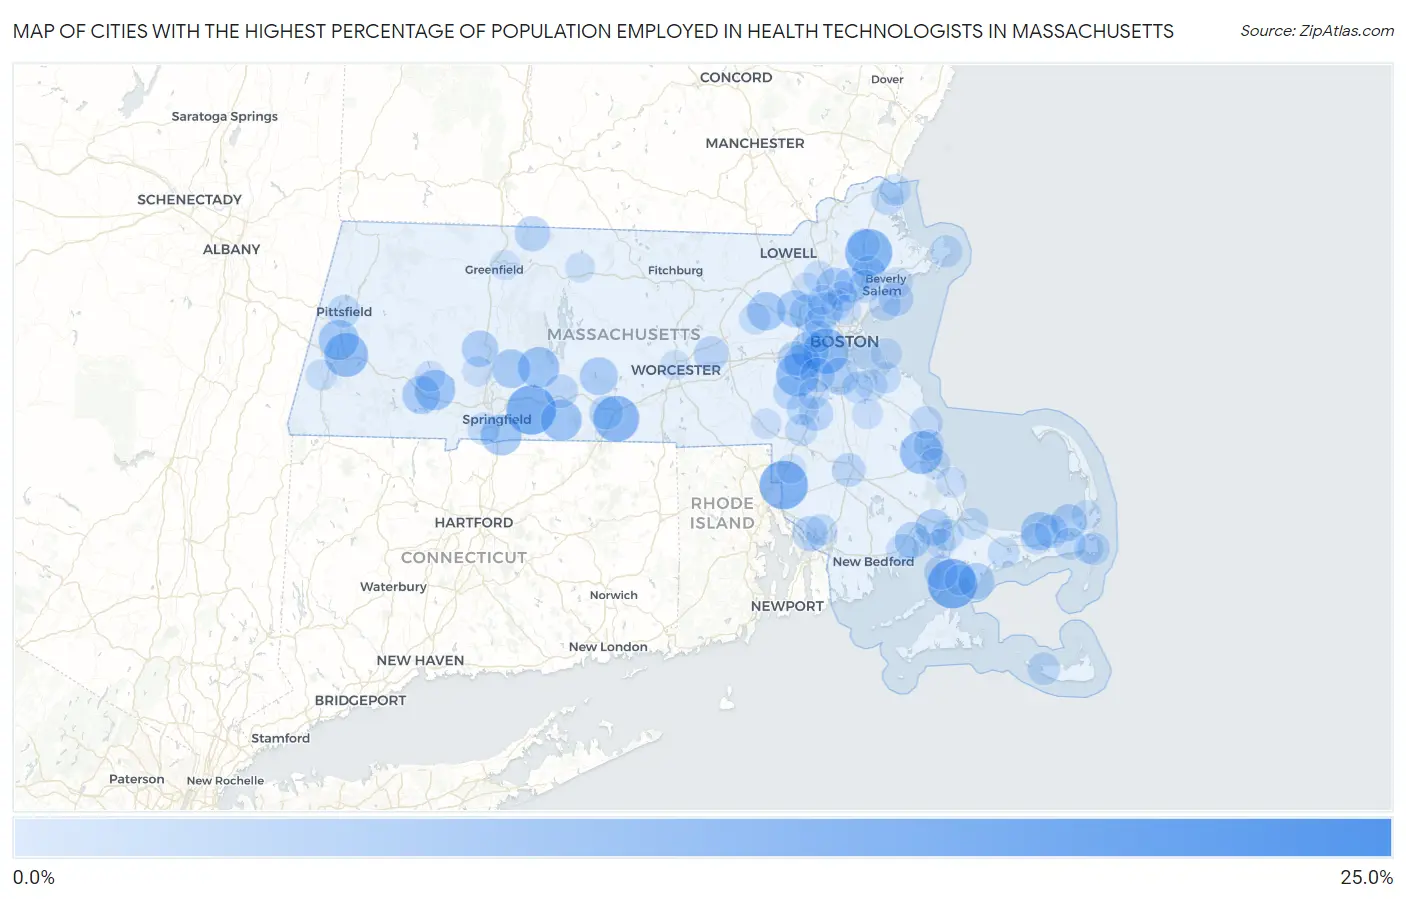
Map of Cities with the Highest Percentage of Population Employed in Health Technologists in Massachusetts
0.0%
25.0%
Cities with the Highest Percentage of Population Employed in Health Technologists in Massachusetts
| City | % Employed | vs State | vs National | |
| 1. | Oak Bluffs | 22.3% | 5.0%(+17.3)#1 | 4.3%(+18.0)#290 |
| 2. | Teaticket | 15.2% | 5.0%(+10.2)#2 | 4.3%(+10.9)#667 |
| 3. | Wilbraham | 15.2% | 5.0%(+10.2)#3 | 4.3%(+10.9)#670 |
| 4. | Cedar Crest | 14.7% | 5.0%(+9.68)#4 | 4.3%(+10.4)#722 |
| 5. | North Seekonk | 14.6% | 5.0%(+9.64)#5 | 4.3%(+10.4)#732 |
| 6. | Topsfield | 13.9% | 5.0%(+8.91)#6 | 4.3%(+9.63)#823 |
| 7. | Sturbridge | 13.3% | 5.0%(+8.26)#7 | 4.3%(+8.98)#936 |
| 8. | Brookline | 13.0% | 5.0%(+7.95)#8 | 4.3%(+8.67)#986 |
| 9. | Lee | 12.1% | 5.0%(+7.10)#9 | 4.3%(+7.82)#1,165 |
| 10. | Kingston | 11.6% | 5.0%(+6.64)#10 | 4.3%(+7.36)#1,276 |
| 11. | Dover | 11.6% | 5.0%(+6.59)#11 | 4.3%(+7.31)#1,288 |
| 12. | Monson Center | 10.7% | 5.0%(+5.67)#12 | 4.3%(+6.38)#1,552 |
| 13. | Belchertown | 10.6% | 5.0%(+5.62)#13 | 4.3%(+6.34)#1,562 |
| 14. | Longmeadow | 10.4% | 5.0%(+5.43)#14 | 4.3%(+6.15)#1,626 |
| 15. | Russell | 10.2% | 5.0%(+5.24)#15 | 4.3%(+5.96)#1,705 |
| 16. | Lenox | 10.2% | 5.0%(+5.16)#16 | 4.3%(+5.87)#1,730 |
| 17. | Granby | 9.3% | 5.0%(+4.27)#17 | 4.3%(+4.99)#2,127 |
| 18. | West Concord | 9.2% | 5.0%(+4.23)#18 | 4.3%(+4.95)#2,147 |
| 19. | Dennis | 9.1% | 5.0%(+4.13)#19 | 4.3%(+4.85)#2,190 |
| 20. | Newton | 9.1% | 5.0%(+4.13)#20 | 4.3%(+4.85)#2,193 |
| 21. | Blandford | 9.0% | 5.0%(+3.98)#21 | 4.3%(+4.70)#2,294 |
| 22. | West Brookfield | 9.0% | 5.0%(+3.95)#22 | 4.3%(+4.67)#2,320 |
| 23. | Milton | 8.7% | 5.0%(+3.70)#23 | 4.3%(+4.42)#2,474 |
| 24. | Reading | 8.5% | 5.0%(+3.52)#24 | 4.3%(+4.24)#2,579 |
| 25. | Hanscom Afb | 8.4% | 5.0%(+3.42)#25 | 4.3%(+4.14)#2,661 |
| 26. | Onset | 8.3% | 5.0%(+3.25)#26 | 4.3%(+3.97)#2,759 |
| 27. | Brewster | 8.2% | 5.0%(+3.20)#27 | 4.3%(+3.92)#2,800 |
| 28. | Needham | 8.2% | 5.0%(+3.20)#28 | 4.3%(+3.92)#2,803 |
| 29. | Northampton | 8.2% | 5.0%(+3.18)#29 | 4.3%(+3.90)#2,819 |
| 30. | New Seabury | 8.2% | 5.0%(+3.15)#30 | 4.3%(+3.87)#2,853 |
| 31. | Lexington | 8.2% | 5.0%(+3.15)#31 | 4.3%(+3.87)#2,855 |
| 32. | Marion Center | 8.0% | 5.0%(+2.99)#32 | 4.3%(+3.70)#2,990 |
| 33. | Winchester | 7.7% | 5.0%(+2.73)#33 | 4.3%(+3.45)#3,207 |
| 34. | Ocean Grove | 7.6% | 5.0%(+2.57)#34 | 4.3%(+3.29)#3,366 |
| 35. | Northfield | 7.6% | 5.0%(+2.56)#35 | 4.3%(+3.28)#3,378 |
| 36. | Wellesley | 7.4% | 5.0%(+2.44)#36 | 4.3%(+3.16)#3,494 |
| 37. | Lynnfield | 7.3% | 5.0%(+2.27)#37 | 4.3%(+2.99)#3,644 |
| 38. | Northborough | 7.2% | 5.0%(+2.24)#38 | 4.3%(+2.96)#3,677 |
| 39. | West Falmouth | 7.1% | 5.0%(+2.13)#39 | 4.3%(+2.85)#3,816 |
| 40. | Marblehead | 7.1% | 5.0%(+2.08)#40 | 4.3%(+2.80)#3,871 |
| 41. | Dedham | 7.1% | 5.0%(+2.07)#41 | 4.3%(+2.78)#3,888 |
| 42. | Fiskdale | 6.9% | 5.0%(+1.92)#42 | 4.3%(+2.63)#4,059 |
| 43. | Sharon | 6.9% | 5.0%(+1.92)#43 | 4.3%(+2.63)#4,060 |
| 44. | Medfield | 6.8% | 5.0%(+1.75)#44 | 4.3%(+2.47)#4,271 |
| 45. | Raynham Center | 6.7% | 5.0%(+1.72)#45 | 4.3%(+2.44)#4,296 |
| 46. | East Dennis | 6.7% | 5.0%(+1.72)#46 | 4.3%(+2.44)#4,301 |
| 47. | Danvers | 6.7% | 5.0%(+1.69)#47 | 4.3%(+2.41)#4,341 |
| 48. | Palmer Town | 6.7% | 5.0%(+1.69)#48 | 4.3%(+2.41)#4,354 |
| 49. | Marshfield | 6.3% | 5.0%(+1.34)#49 | 4.3%(+2.06)#4,803 |
| 50. | Peabody | 6.3% | 5.0%(+1.28)#50 | 4.3%(+2.00)#4,906 |
| 51. | Boxford | 6.2% | 5.0%(+1.25)#51 | 4.3%(+1.96)#4,946 |
| 52. | Madaket | 6.2% | 5.0%(+1.25)#52 | 4.3%(+1.96)#4,956 |
| 53. | Pittsfield | 6.2% | 5.0%(+1.18)#53 | 4.3%(+1.90)#5,071 |
| 54. | Chatham | 6.2% | 5.0%(+1.17)#54 | 4.3%(+1.89)#5,079 |
| 55. | Newburyport | 6.2% | 5.0%(+1.16)#55 | 4.3%(+1.88)#5,092 |
| 56. | Walpole | 6.1% | 5.0%(+1.11)#56 | 4.3%(+1.83)#5,191 |
| 57. | Mattapoisett Center | 6.1% | 5.0%(+1.08)#57 | 4.3%(+1.80)#5,236 |
| 58. | Agawam Town | 6.0% | 5.0%(+1.04)#58 | 4.3%(+1.75)#5,310 |
| 59. | Rockport | 6.0% | 5.0%(+1.01)#59 | 4.3%(+1.73)#5,360 |
| 60. | Foxborough | 6.0% | 5.0%(+0.977)#60 | 4.3%(+1.70)#5,411 |
| 61. | Harwich Center | 6.0% | 5.0%(+0.948)#61 | 4.3%(+1.67)#5,457 |
| 62. | Watertown Town | 5.9% | 5.0%(+0.912)#62 | 4.3%(+1.63)#5,508 |
| 63. | Swampscott | 5.8% | 5.0%(+0.837)#63 | 4.3%(+1.56)#5,631 |
| 64. | Monument Beach | 5.8% | 5.0%(+0.836)#64 | 4.3%(+1.55)#5,635 |
| 65. | Weymouth Town | 5.8% | 5.0%(+0.806)#65 | 4.3%(+1.53)#5,695 |
| 66. | Hingham | 5.8% | 5.0%(+0.790)#66 | 4.3%(+1.51)#5,720 |
| 67. | Somerset | 5.7% | 5.0%(+0.729)#67 | 4.3%(+1.45)#5,822 |
| 68. | Barnstable Town | 5.7% | 5.0%(+0.701)#68 | 4.3%(+1.42)#5,878 |
| 69. | Salisbury | 5.7% | 5.0%(+0.667)#69 | 4.3%(+1.39)#5,937 |
| 70. | Braintree Town | 5.7% | 5.0%(+0.648)#70 | 4.3%(+1.37)#5,966 |
| 71. | Boston | 5.6% | 5.0%(+0.626)#71 | 4.3%(+1.34)#6,021 |
| 72. | Sandwich | 5.6% | 5.0%(+0.619)#72 | 4.3%(+1.34)#6,032 |
| 73. | Maynard | 5.6% | 5.0%(+0.566)#73 | 4.3%(+1.28)#6,122 |
| 74. | Arlington | 5.6% | 5.0%(+0.563)#74 | 4.3%(+1.28)#6,130 |
| 75. | Hull | 5.5% | 5.0%(+0.506)#75 | 4.3%(+1.22)#6,246 |
| 76. | Yarmouth Port | 5.5% | 5.0%(+0.495)#76 | 4.3%(+1.21)#6,269 |
| 77. | South Duxbury | 5.5% | 5.0%(+0.454)#77 | 4.3%(+1.17)#6,346 |
| 78. | Plymouth | 5.4% | 5.0%(+0.432)#78 | 4.3%(+1.15)#6,384 |
| 79. | Wilmington | 5.4% | 5.0%(+0.422)#79 | 4.3%(+1.14)#6,404 |
| 80. | Housatonic | 5.4% | 5.0%(+0.404)#80 | 4.3%(+1.12)#6,440 |
| 81. | East Falmouth | 5.3% | 5.0%(+0.329)#81 | 4.3%(+1.05)#6,607 |
| 82. | Norwood | 5.3% | 5.0%(+0.251)#82 | 4.3%(+0.969)#6,799 |
| 83. | Stoneham | 5.2% | 5.0%(+0.241)#83 | 4.3%(+0.960)#6,819 |
| 84. | Huntington | 5.2% | 5.0%(+0.199)#84 | 4.3%(+0.918)#6,913 |
| 85. | The Pinehills | 5.2% | 5.0%(+0.169)#85 | 4.3%(+0.887)#6,973 |
| 86. | Easthampton Town | 5.2% | 5.0%(+0.163)#86 | 4.3%(+0.882)#6,990 |
| 87. | Beverly | 5.2% | 5.0%(+0.153)#87 | 4.3%(+0.871)#7,006 |
| 88. | Abington | 5.1% | 5.0%(+0.095)#88 | 4.3%(+0.814)#7,142 |
| 89. | Wakefield | 5.0% | 5.0%(+0.027)#89 | 4.3%(+0.746)#7,312 |
| 90. | Franklin Town | 5.0% | 5.0%(+0.015)#90 | 4.3%(+0.734)#7,339 |
| 91. | Melrose | 5.0% | 5.0%(-0.049)#91 | 4.3%(+0.670)#7,448 |
| 92. | Athol | 4.9% | 5.0%(-0.073)#92 | 4.3%(+0.646)#7,497 |
| 93. | Turners Falls | 4.9% | 5.0%(-0.098)#93 | 4.3%(+0.621)#7,556 |
| 94. | Pocasset | 4.9% | 5.0%(-0.111)#94 | 4.3%(+0.607)#7,589 |
| 95. | Worcester | 4.9% | 5.0%(-0.130)#95 | 4.3%(+0.589)#7,641 |
| 96. | Pinehurst | 4.9% | 5.0%(-0.132)#96 | 4.3%(+0.586)#7,647 |
| 97. | Woburn | 4.8% | 5.0%(-0.172)#97 | 4.3%(+0.547)#7,742 |
| 98. | West Chatham | 4.8% | 5.0%(-0.173)#98 | 4.3%(+0.546)#7,746 |
| 99. | Orleans | 4.8% | 5.0%(-0.181)#99 | 4.3%(+0.538)#7,770 |
| 100. | Attleboro | 4.8% | 5.0%(-0.196)#100 | 4.3%(+0.522)#7,811 |
Common Questions
What are the Top 10 Cities with the Highest Percentage of Population Employed in Health Technologists in Massachusetts?
Top 10 Cities with the Highest Percentage of Population Employed in Health Technologists in Massachusetts are:
#1
15.2%
#2
15.2%
#3
14.6%
#4
13.9%
#5
13.3%
#6
13.0%
#7
12.1%
#8
11.6%
#9
11.6%
#10
10.7%
What city has the Highest Percentage of Population Employed in Health Technologists in Massachusetts?
Teaticket has the Highest Percentage of Population Employed in Health Technologists in Massachusetts with 15.2%.
What is the Percentage of Population Employed in Health Technologists in the State of Massachusetts?
Percentage of Population Employed in Health Technologists in Massachusetts is 5.0%.
What is the Percentage of Population Employed in Health Technologists in the United States?
Percentage of Population Employed in Health Technologists in the United States is 4.3%.