Cities with the Most Immigrants from Caribbean in Massachusetts
RELATED REPORTS & OPTIONS
Caribbean
Massachusetts
Compare Cities
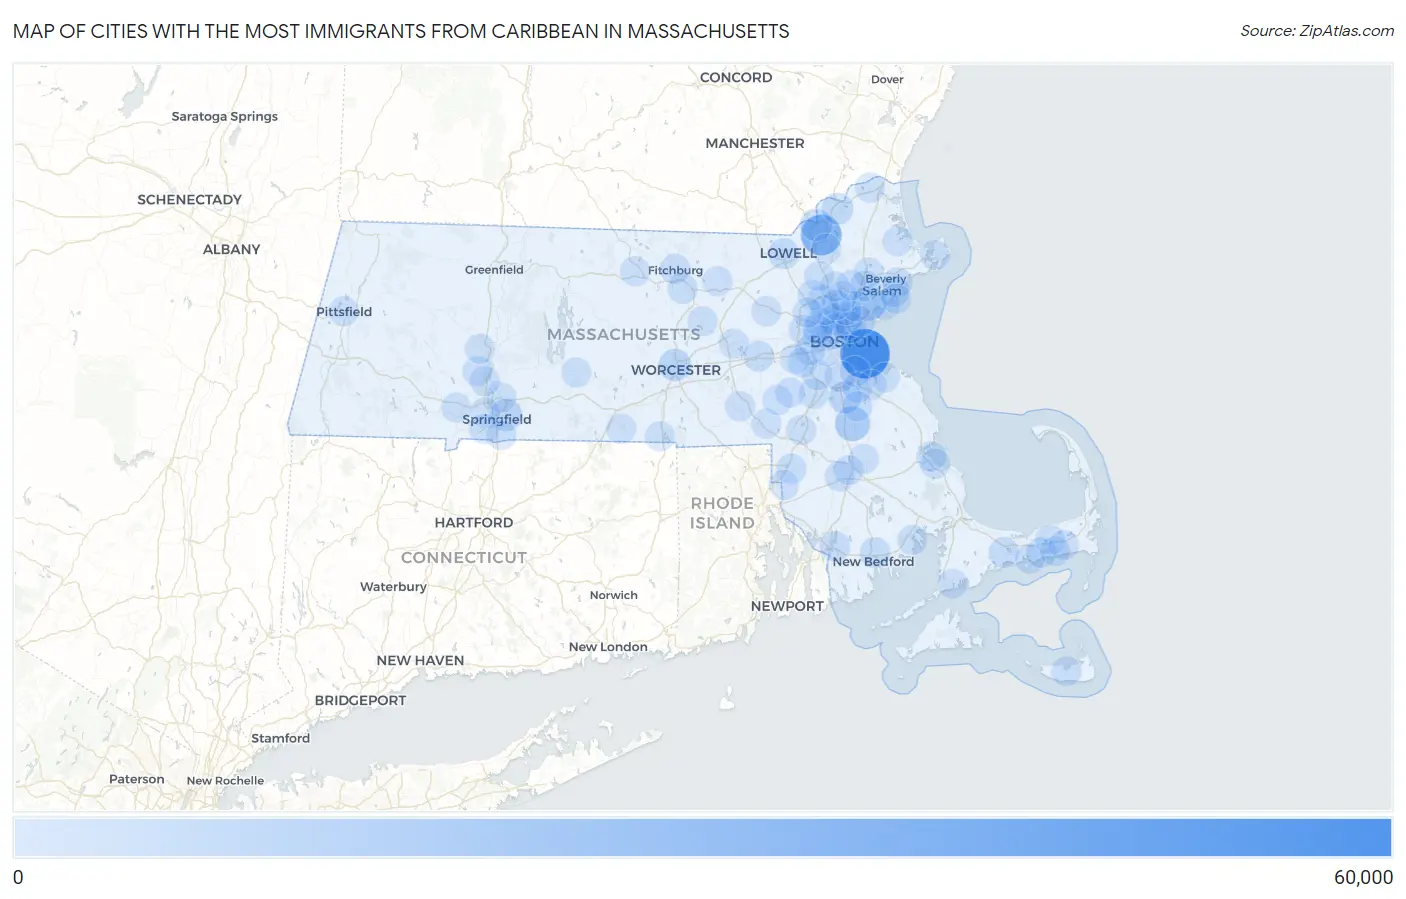
Map of Cities with the Most Immigrants from Caribbean in Massachusetts
0
60,000
Cities with the Most Immigrants from Caribbean in Massachusetts
| City | Caribbean | vs State | vs National | |
| 1. | Boston | 57,386 | 205,247(27.96%)#1 | 4,544,093(1.26%)#4 |
| 2. | Lawrence | 30,665 | 205,247(14.94%)#2 | 4,544,093(0.67%)#9 |
| 3. | Brockton | 13,611 | 205,247(6.63%)#3 | 4,544,093(0.30%)#48 |
| 4. | Lynn | 12,449 | 205,247(6.07%)#4 | 4,544,093(0.27%)#55 |
| 5. | Worcester | 6,797 | 205,247(3.31%)#5 | 4,544,093(0.15%)#96 |
| 6. | Randolph Town | 6,681 | 205,247(3.26%)#6 | 4,544,093(0.15%)#98 |
| 7. | Methuen Town | 6,350 | 205,247(3.09%)#7 | 4,544,093(0.14%)#102 |
| 8. | Springfield | 5,896 | 205,247(2.87%)#8 | 4,544,093(0.13%)#110 |
| 9. | Haverhill | 4,250 | 205,247(2.07%)#9 | 4,544,093(0.09%)#137 |
| 10. | Malden | 3,247 | 205,247(1.58%)#10 | 4,544,093(0.07%)#164 |
| 11. | Salem | 2,837 | 205,247(1.38%)#11 | 4,544,093(0.06%)#185 |
| 12. | Everett | 2,764 | 205,247(1.35%)#12 | 4,544,093(0.06%)#191 |
| 13. | Cambridge | 2,550 | 205,247(1.24%)#13 | 4,544,093(0.06%)#203 |
| 14. | Lowell | 2,486 | 205,247(1.21%)#14 | 4,544,093(0.05%)#209 |
| 15. | Peabody | 2,452 | 205,247(1.19%)#15 | 4,544,093(0.05%)#212 |
| 16. | Milton | 2,274 | 205,247(1.11%)#16 | 4,544,093(0.05%)#224 |
| 17. | Barnstable Town | 1,801 | 205,247(0.88%)#17 | 4,544,093(0.04%)#279 |
| 18. | New Bedford | 1,696 | 205,247(0.83%)#18 | 4,544,093(0.04%)#292 |
| 19. | Medford | 1,679 | 205,247(0.82%)#19 | 4,544,093(0.04%)#295 |
| 20. | Chelsea | 1,598 | 205,247(0.78%)#20 | 4,544,093(0.04%)#301 |
| 21. | Framingham | 1,483 | 205,247(0.72%)#21 | 4,544,093(0.03%)#316 |
| 22. | Waltham | 1,355 | 205,247(0.66%)#22 | 4,544,093(0.03%)#336 |
| 23. | Fall River | 1,270 | 205,247(0.62%)#23 | 4,544,093(0.03%)#353 |
| 24. | Somerville | 1,269 | 205,247(0.62%)#24 | 4,544,093(0.03%)#355 |
| 25. | Quincy | 1,141 | 205,247(0.56%)#25 | 4,544,093(0.03%)#387 |
| 26. | Taunton | 1,115 | 205,247(0.54%)#26 | 4,544,093(0.02%)#395 |
| 27. | Revere | 1,045 | 205,247(0.51%)#27 | 4,544,093(0.02%)#410 |
| 28. | Woburn | 773 | 205,247(0.38%)#28 | 4,544,093(0.02%)#511 |
| 29. | Norwood | 735 | 205,247(0.36%)#29 | 4,544,093(0.02%)#524 |
| 30. | Beverly | 668 | 205,247(0.33%)#30 | 4,544,093(0.01%)#567 |
| 31. | Weymouth Town | 642 | 205,247(0.31%)#31 | 4,544,093(0.01%)#580 |
| 32. | Braintree Town | 550 | 205,247(0.27%)#32 | 4,544,093(0.01%)#630 |
| 33. | Leominster | 530 | 205,247(0.26%)#33 | 4,544,093(0.01%)#650 |
| 34. | Fitchburg | 502 | 205,247(0.24%)#34 | 4,544,093(0.01%)#670 |
| 35. | Attleboro | 496 | 205,247(0.24%)#35 | 4,544,093(0.01%)#673 |
| 36. | Dedham | 496 | 205,247(0.24%)#36 | 4,544,093(0.01%)#674 |
| 37. | South Yarmouth | 480 | 205,247(0.23%)#37 | 4,544,093(0.01%)#689 |
| 38. | Watertown Town | 457 | 205,247(0.22%)#38 | 4,544,093(0.01%)#717 |
| 39. | Holbrook | 437 | 205,247(0.21%)#39 | 4,544,093(0.01%)#742 |
| 40. | Saugus | 410 | 205,247(0.20%)#40 | 4,544,093(0.01%)#783 |
| 41. | Milford | 387 | 205,247(0.19%)#41 | 4,544,093(0.01%)#816 |
| 42. | Brookline | 375 | 205,247(0.18%)#42 | 4,544,093(0.01%)#834 |
| 43. | Marlborough | 331 | 205,247(0.16%)#43 | 4,544,093(0.01%)#926 |
| 44. | Nantucket | 322 | 205,247(0.16%)#44 | 4,544,093(0.01%)#950 |
| 45. | Chicopee | 314 | 205,247(0.15%)#45 | 4,544,093(0.01%)#966 |
| 46. | Newton | 289 | 205,247(0.14%)#46 | 4,544,093(0.01%)#1,016 |
| 47. | Holyoke | 270 | 205,247(0.13%)#47 | 4,544,093(0.01%)#1,074 |
| 48. | Melrose | 269 | 205,247(0.13%)#48 | 4,544,093(0.01%)#1,079 |
| 49. | Arlington | 259 | 205,247(0.13%)#49 | 4,544,093(0.01%)#1,106 |
| 50. | Gloucester | 248 | 205,247(0.12%)#50 | 4,544,093(0.01%)#1,154 |
| 51. | Bridgewater Town | 247 | 205,247(0.12%)#51 | 4,544,093(0.01%)#1,155 |
| 52. | North Attleborough | 236 | 205,247(0.11%)#52 | 4,544,093(0.01%)#1,181 |
| 53. | Clinton | 227 | 205,247(0.11%)#53 | 4,544,093(0.00%)#1,223 |
| 54. | West Springfield Town | 222 | 205,247(0.11%)#54 | 4,544,093(0.00%)#1,241 |
| 55. | Andover | 218 | 205,247(0.11%)#55 | 4,544,093(0.00%)#1,257 |
| 56. | West Yarmouth | 207 | 205,247(0.10%)#56 | 4,544,093(0.00%)#1,304 |
| 57. | Westfield | 199 | 205,247(0.10%)#57 | 4,544,093(0.00%)#1,340 |
| 58. | Belmont | 195 | 205,247(0.10%)#58 | 4,544,093(0.00%)#1,365 |
| 59. | Pittsfield | 172 | 205,247(0.08%)#59 | 4,544,093(0.00%)#1,479 |
| 60. | West Concord | 161 | 205,247(0.08%)#60 | 4,544,093(0.00%)#1,556 |
| 61. | Raynham Center | 154 | 205,247(0.08%)#61 | 4,544,093(0.00%)#1,595 |
| 62. | Wellesley | 152 | 205,247(0.07%)#62 | 4,544,093(0.00%)#1,603 |
| 63. | Franklin Town | 149 | 205,247(0.07%)#63 | 4,544,093(0.00%)#1,625 |
| 64. | Needham | 149 | 205,247(0.07%)#64 | 4,544,093(0.00%)#1,626 |
| 65. | Danvers | 149 | 205,247(0.07%)#65 | 4,544,093(0.00%)#1,627 |
| 66. | North Seekonk | 137 | 205,247(0.07%)#66 | 4,544,093(0.00%)#1,710 |
| 67. | Winchester | 131 | 205,247(0.06%)#67 | 4,544,093(0.00%)#1,762 |
| 68. | Agawam Town | 130 | 205,247(0.06%)#68 | 4,544,093(0.00%)#1,773 |
| 69. | Millis Clicquot | 128 | 205,247(0.06%)#69 | 4,544,093(0.00%)#1,792 |
| 70. | Devens | 124 | 205,247(0.06%)#70 | 4,544,093(0.00%)#1,827 |
| 71. | Easthampton Town | 123 | 205,247(0.06%)#71 | 4,544,093(0.00%)#1,832 |
| 72. | Foxborough | 122 | 205,247(0.06%)#72 | 4,544,093(0.00%)#1,844 |
| 73. | Webster | 117 | 205,247(0.06%)#73 | 4,544,093(0.00%)#1,890 |
| 74. | South Dennis | 115 | 205,247(0.06%)#74 | 4,544,093(0.00%)#1,914 |
| 75. | Wakefield | 110 | 205,247(0.05%)#75 | 4,544,093(0.00%)#1,971 |
| 76. | Ware | 108 | 205,247(0.05%)#76 | 4,544,093(0.00%)#1,995 |
| 77. | Burlington | 103 | 205,247(0.05%)#77 | 4,544,093(0.00%)#2,040 |
| 78. | Marion Center | 100 | 205,247(0.05%)#78 | 4,544,093(0.00%)#2,090 |
| 79. | Wilmington | 94 | 205,247(0.05%)#79 | 4,544,093(0.00%)#2,173 |
| 80. | Gardner | 92 | 205,247(0.04%)#80 | 4,544,093(0.00%)#2,201 |
| 81. | Swampscott | 90 | 205,247(0.04%)#81 | 4,544,093(0.00%)#2,236 |
| 82. | Amesbury Town | 86 | 205,247(0.04%)#82 | 4,544,093(0.00%)#2,280 |
| 83. | Lynnfield | 86 | 205,247(0.04%)#83 | 4,544,093(0.00%)#2,283 |
| 84. | Marblehead | 78 | 205,247(0.04%)#84 | 4,544,093(0.00%)#2,408 |
| 85. | North Plymouth | 75 | 205,247(0.04%)#85 | 4,544,093(0.00%)#2,471 |
| 86. | Southbridge Town | 69 | 205,247(0.03%)#86 | 4,544,093(0.00%)#2,564 |
| 87. | Longmeadow | 69 | 205,247(0.03%)#87 | 4,544,093(0.00%)#2,565 |
| 88. | Medfield | 68 | 205,247(0.03%)#88 | 4,544,093(0.00%)#2,589 |
| 89. | Plymouth | 64 | 205,247(0.03%)#89 | 4,544,093(0.00%)#2,657 |
| 90. | Teaticket | 64 | 205,247(0.03%)#90 | 4,544,093(0.00%)#2,662 |
| 91. | Amherst | 61 | 205,247(0.03%)#91 | 4,544,093(0.00%)#2,719 |
| 92. | Lexington | 60 | 205,247(0.03%)#92 | 4,544,093(0.00%)#2,747 |
| 93. | Stoneham | 60 | 205,247(0.03%)#93 | 4,544,093(0.00%)#2,750 |
| 94. | Ipswich | 59 | 205,247(0.03%)#94 | 4,544,093(0.00%)#2,783 |
| 95. | Northampton | 55 | 205,247(0.03%)#95 | 4,544,093(0.00%)#2,860 |
| 96. | Hingham | 55 | 205,247(0.03%)#96 | 4,544,093(0.00%)#2,874 |
| 97. | Dennis Port | 51 | 205,247(0.02%)#97 | 4,544,093(0.00%)#2,981 |
| 98. | Greenfield | 47 | 205,247(0.02%)#98 | 4,544,093(0.00%)#3,079 |
| 99. | Reading | 46 | 205,247(0.02%)#99 | 4,544,093(0.00%)#3,108 |
| 100. | Northwest Harwich | 46 | 205,247(0.02%)#100 | 4,544,093(0.00%)#3,124 |
Common Questions
What are the Top 10 Cities with the Most Immigrants from Caribbean in Massachusetts?
Top 10 Cities with the Most Immigrants from Caribbean in Massachusetts are:
#1
57,386
#2
30,665
#3
13,611
#4
12,449
#5
6,797
#6
6,681
#7
6,350
#8
5,896
#9
4,250
#10
3,247
What city has the Most Immigrants from Caribbean in Massachusetts?
Boston has the Most Immigrants from Caribbean in Massachusetts with 57,386.
What is the Total Immigrants from Caribbean in the State of Massachusetts?
Total Immigrants from Caribbean in Massachusetts is 205,247.
What is the Total Immigrants from Caribbean in the United States?
Total Immigrants from Caribbean in the United States is 4,544,093.