Cities with the Highest Percentage of Immigrants from South America in Massachusetts
RELATED REPORTS & OPTIONS
South America
Massachusetts
Compare Cities
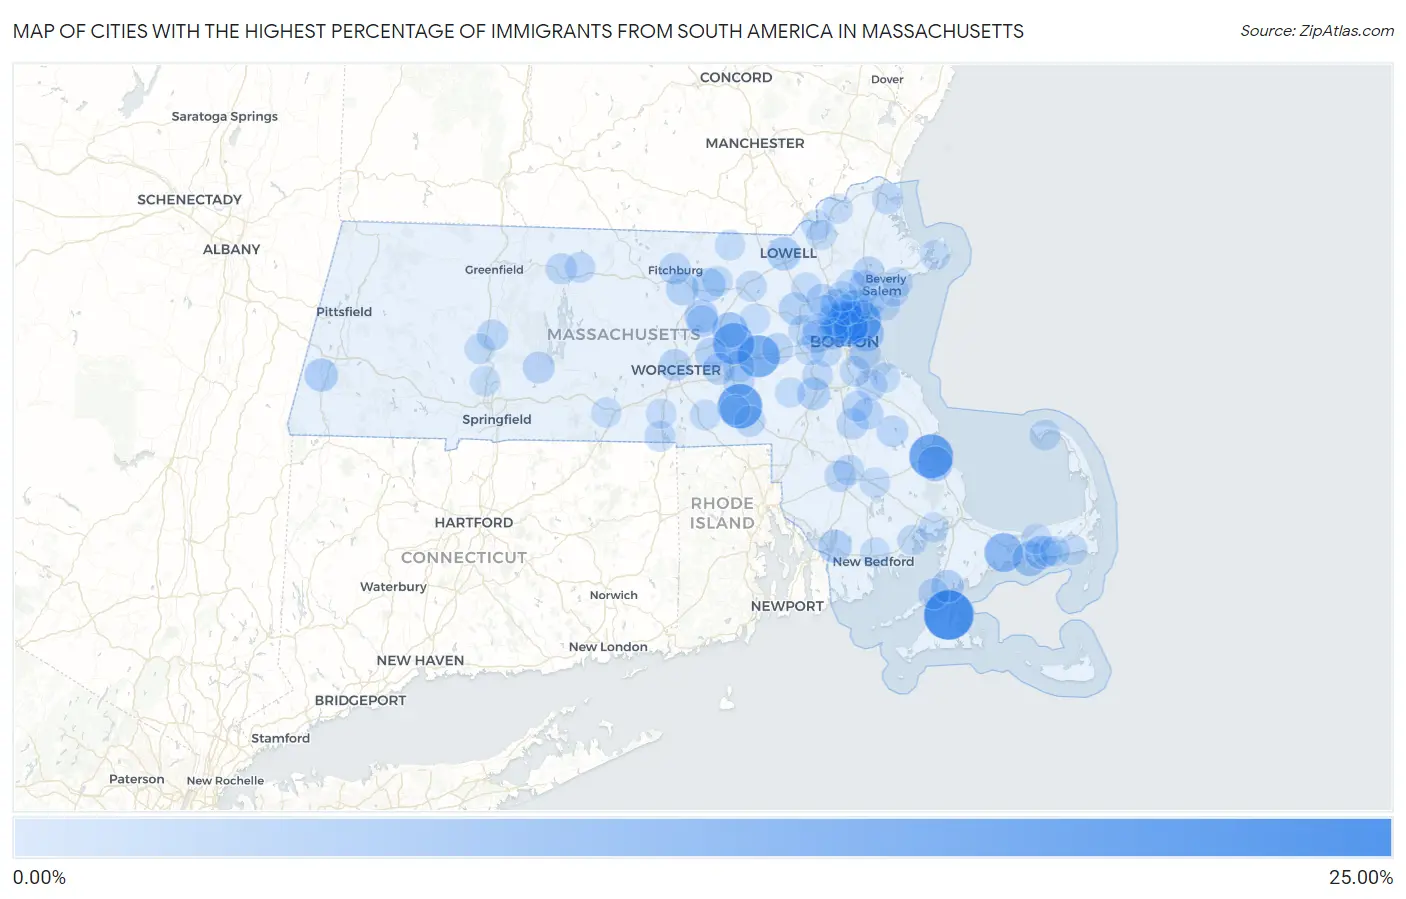
Map of Cities with the Highest Percentage of Immigrants from South America in Massachusetts
0.00%
25.00%
Cities with the Highest Percentage of Immigrants from South America in Massachusetts
| City | South America | vs State | vs National | |
| 1. | Vineyard Haven | 21.72% | 2.25%(+19.5)#-1 | 1.10%(+20.6)#0 |
| 2. | Milford | 16.06% | 2.25%(+13.8)#32 | 1.10%(+15.0)#7,582 |
| 3. | North Plymouth | 15.44% | 2.25%(+13.2)#33 | 1.10%(+14.3)#7,583 |
| 4. | Everett | 14.76% | 2.25%(+12.5)#34 | 1.10%(+13.7)#7,584 |
| 5. | Framingham | 13.55% | 2.25%(+11.3)#35 | 1.10%(+12.5)#7,585 |
| 6. | Revere | 13.45% | 2.25%(+11.2)#36 | 1.10%(+12.3)#7,586 |
| 7. | Marlborough | 12.77% | 2.25%(+10.5)#37 | 1.10%(+11.7)#7,587 |
| 8. | Barnstable Town | 9.96% | 2.25%(+7.70)#77 | 1.10%(+8.86)#11,926 |
| 9. | Malden | 6.61% | 2.25%(+4.36)#78 | 1.10%(+5.51)#11,927 |
| 10. | Winthrop Town | 6.49% | 2.25%(+4.24)#79 | 1.10%(+5.40)#11,928 |
| 11. | Hudson | 6.47% | 2.25%(+4.21)#80 | 1.10%(+5.37)#11,929 |
| 12. | West Yarmouth | 6.15% | 2.25%(+3.90)#110 | 1.10%(+5.05)#13,542 |
| 13. | Plymouth | 6.13% | 2.25%(+3.88)#111 | 1.10%(+5.03)#13,543 |
| 14. | South Yarmouth | 4.68% | 2.25%(+2.42)#112 | 1.10%(+3.58)#13,544 |
| 15. | Lowell | 4.68% | 2.25%(+2.42)#113 | 1.10%(+3.58)#13,545 |
| 16. | South Lancaster | 4.51% | 2.25%(+2.25)#114 | 1.10%(+3.41)#13,546 |
| 17. | Shirley | 4.49% | 2.25%(+2.24)#115 | 1.10%(+3.39)#13,547 |
| 18. | Chelsea | 4.41% | 2.25%(+2.16)#116 | 1.10%(+3.31)#13,548 |
| 19. | Saugus | 4.35% | 2.25%(+2.10)#117 | 1.10%(+3.25)#13,549 |
| 20. | Fall River | 4.35% | 2.25%(+2.09)#118 | 1.10%(+3.25)#13,550 |
| 21. | Housatonic | 4.16% | 2.25%(+1.91)#119 | 1.10%(+3.06)#13,551 |
| 22. | Leominster | 4.01% | 2.25%(+1.76)#120 | 1.10%(+2.91)#13,552 |
| 23. | Somerville | 3.88% | 2.25%(+1.63)#121 | 1.10%(+2.78)#13,553 |
| 24. | Oak Bluffs | 3.88% | 2.25%(+1.63)#122 | 1.10%(+2.78)#13,554 |
| 25. | Norwood | 3.75% | 2.25%(+1.50)#123 | 1.10%(+2.65)#13,555 |
| 26. | Medford | 3.66% | 2.25%(+1.41)#124 | 1.10%(+2.56)#13,556 |
| 27. | Falmouth | 3.63% | 2.25%(+1.38)#125 | 1.10%(+2.53)#13,557 |
| 28. | Hanscom Afb | 3.59% | 2.25%(+1.34)#126 | 1.10%(+2.49)#13,558 |
| 29. | Northborough | 3.40% | 2.25%(+1.15)#127 | 1.10%(+2.30)#13,559 |
| 30. | Woburn | 3.21% | 2.25%(+0.958)#128 | 1.10%(+2.11)#13,560 |
| 31. | Worcester | 3.11% | 2.25%(+0.857)#129 | 1.10%(+2.01)#13,561 |
| 32. | Watertown Town | 3.06% | 2.25%(+0.809)#130 | 1.10%(+1.96)#13,562 |
| 33. | Peabody | 2.98% | 2.25%(+0.727)#131 | 1.10%(+1.88)#13,563 |
| 34. | Westborough | 2.88% | 2.25%(+0.624)#132 | 1.10%(+1.78)#13,564 |
| 35. | Stoneham | 2.84% | 2.25%(+0.588)#133 | 1.10%(+1.74)#13,565 |
| 36. | Belchertown | 2.83% | 2.25%(+0.580)#134 | 1.10%(+1.73)#13,566 |
| 37. | Clinton | 2.76% | 2.25%(+0.506)#135 | 1.10%(+1.66)#13,567 |
| 38. | Danvers | 2.72% | 2.25%(+0.471)#136 | 1.10%(+1.62)#13,568 |
| 39. | Fitchburg | 2.71% | 2.25%(+0.460)#137 | 1.10%(+1.61)#13,569 |
| 40. | Brockton | 2.54% | 2.25%(+0.286)#138 | 1.10%(+1.44)#13,570 |
| 41. | Cordaville | 2.46% | 2.25%(+0.210)#139 | 1.10%(+1.36)#13,571 |
| 42. | Hanson | 2.44% | 2.25%(+0.192)#140 | 1.10%(+1.35)#13,572 |
| 43. | Boston | 2.43% | 2.25%(+0.178)#141 | 1.10%(+1.33)#13,573 |
| 44. | Abington | 2.43% | 2.25%(+0.177)#142 | 1.10%(+1.33)#13,574 |
| 45. | Cochituate | 2.42% | 2.25%(+0.170)#143 | 1.10%(+1.32)#13,575 |
| 46. | Lynn | 2.39% | 2.25%(+0.141)#144 | 1.10%(+1.30)#13,576 |
| 47. | Weymouth Town | 2.38% | 2.25%(+0.127)#145 | 1.10%(+1.28)#13,577 |
| 48. | Taunton | 2.34% | 2.25%(+0.087)#146 | 1.10%(+1.24)#13,578 |
| 49. | Hopkinton | 2.15% | 2.25%(-0.099)#147 | 1.10%(+1.05)#13,579 |
| 50. | Woods Hole | 2.12% | 2.25%(-0.135)#148 | 1.10%(+1.02)#13,580 |
| 51. | Bellingham | 2.07% | 2.25%(-0.181)#149 | 1.10%(+0.972)#13,581 |
| 52. | Orange | 2.04% | 2.25%(-0.215)#150 | 1.10%(+0.939)#13,582 |
| 53. | Cambridge | 2.04% | 2.25%(-0.216)#151 | 1.10%(+0.938)#13,583 |
| 54. | Hatfield | 2.03% | 2.25%(-0.224)#152 | 1.10%(+0.930)#13,584 |
| 55. | Brookline | 1.96% | 2.25%(-0.295)#153 | 1.10%(+0.859)#13,585 |
| 56. | Amherst | 1.95% | 2.25%(-0.299)#154 | 1.10%(+0.854)#13,586 |
| 57. | Newburyport | 1.94% | 2.25%(-0.313)#155 | 1.10%(+0.841)#13,587 |
| 58. | Quincy | 1.91% | 2.25%(-0.347)#156 | 1.10%(+0.807)#13,588 |
| 59. | Littleton Common | 1.88% | 2.25%(-0.371)#157 | 1.10%(+0.783)#13,589 |
| 60. | Swampscott | 1.81% | 2.25%(-0.441)#158 | 1.10%(+0.713)#13,590 |
| 61. | Provincetown | 1.81% | 2.25%(-0.446)#159 | 1.10%(+0.708)#13,591 |
| 62. | Webster | 1.79% | 2.25%(-0.458)#160 | 1.10%(+0.696)#13,592 |
| 63. | Raynham Center | 1.75% | 2.25%(-0.498)#161 | 1.10%(+0.656)#13,593 |
| 64. | Athol | 1.75% | 2.25%(-0.503)#162 | 1.10%(+0.651)#13,594 |
| 65. | Melrose | 1.73% | 2.25%(-0.522)#163 | 1.10%(+0.632)#13,595 |
| 66. | Waltham | 1.72% | 2.25%(-0.529)#164 | 1.10%(+0.625)#13,596 |
| 67. | Salem | 1.71% | 2.25%(-0.544)#165 | 1.10%(+0.610)#13,597 |
| 68. | Holbrook | 1.69% | 2.25%(-0.559)#166 | 1.10%(+0.595)#13,832 |
| 69. | Dedham | 1.67% | 2.25%(-0.578)#167 | 1.10%(+0.576)#13,833 |
| 70. | Beverly | 1.62% | 2.25%(-0.632)#168 | 1.10%(+0.521)#13,834 |
| 71. | Northampton | 1.60% | 2.25%(-0.652)#169 | 1.10%(+0.502)#13,835 |
| 72. | Whitinsville | 1.55% | 2.25%(-0.698)#170 | 1.10%(+0.455)#13,836 |
| 73. | Devens | 1.47% | 2.25%(-0.777)#171 | 1.10%(+0.376)#13,837 |
| 74. | Methuen Town | 1.44% | 2.25%(-0.811)#172 | 1.10%(+0.343)#13,838 |
| 75. | Harwich Port | 1.42% | 2.25%(-0.831)#173 | 1.10%(+0.323)#13,839 |
| 76. | Newton | 1.41% | 2.25%(-0.839)#174 | 1.10%(+0.315)#13,840 |
| 77. | West Dennis | 1.39% | 2.25%(-0.861)#175 | 1.10%(+0.293)#13,841 |
| 78. | Lynnfield | 1.34% | 2.25%(-0.914)#176 | 1.10%(+0.240)#13,952 |
| 79. | Middleborough Center | 1.33% | 2.25%(-0.920)#177 | 1.10%(+0.234)#14,032 |
| 80. | Hopedale | 1.33% | 2.25%(-0.923)#178 | 1.10%(+0.231)#14,033 |
| 81. | Marion Center | 1.33% | 2.25%(-0.926)#179 | 1.10%(+0.228)#14,034 |
| 82. | Wakefield | 1.31% | 2.25%(-0.940)#180 | 1.10%(+0.214)#14,035 |
| 83. | Oxford | 1.26% | 2.25%(-0.995)#181 | 1.10%(+0.159)#14,036 |
| 84. | East Pepperell | 1.25% | 2.25%(-1.00)#182 | 1.10%(+0.152)#14,037 |
| 85. | Holyoke | 1.25% | 2.25%(-1.01)#183 | 1.10%(+0.147)#14,038 |
| 86. | Gloucester | 1.23% | 2.25%(-1.02)#184 | 1.10%(+0.135)#14,039 |
| 87. | Belmont | 1.23% | 2.25%(-1.02)#185 | 1.10%(+0.135)#14,040 |
| 88. | Maynard | 1.19% | 2.25%(-1.06)#186 | 1.10%(+0.092)#14,041 |
| 89. | Haverhill | 1.19% | 2.25%(-1.06)#187 | 1.10%(+0.091)#14,042 |
| 90. | Lawrence | 1.18% | 2.25%(-1.07)#188 | 1.10%(+0.086)#14,043 |
| 91. | New Bedford | 1.18% | 2.25%(-1.07)#189 | 1.10%(+0.081)#14,044 |
| 92. | Winchester | 1.15% | 2.25%(-1.10)#190 | 1.10%(+0.050)#14,045 |
| 93. | Onset | 1.13% | 2.25%(-1.12)#191 | 1.10%(+0.033)#14,046 |
| 94. | Yarmouth Port | 1.12% | 2.25%(-1.13)#192 | 1.10%(+0.024)#14,047 |
| 95. | Dennis Port | 1.12% | 2.25%(-1.13)#193 | 1.10%(+0.023)#14,048 |
| 96. | Hingham | 1.03% | 2.25%(-1.22)#194 | 1.10%(-0.064)#14,049 |
| 97. | Greenfield | 1.02% | 2.25%(-1.23)#195 | 1.10%(-0.080)#14,050 |
| 98. | Medfield | 1.01% | 2.25%(-1.24)#196 | 1.10%(-0.085)#14,051 |
| 99. | Pinehurst | 1.01% | 2.25%(-1.24)#197 | 1.10%(-0.087)#14,052 |
| 100. | Fiskdale | 0.99% | 2.25%(-1.26)#198 | 1.10%(-0.108)#14,053 |
Common Questions
What are the Top 10 Cities with the Highest Percentage of Immigrants from South America in Massachusetts?
Top 10 Cities with the Highest Percentage of Immigrants from South America in Massachusetts are:
#1
21.72%
#2
16.06%
#3
15.44%
#4
14.76%
#5
13.55%
#6
13.45%
#7
12.77%
#8
9.96%
#9
6.61%
#10
6.49%
What city has the Highest Percentage of Immigrants from South America in Massachusetts?
Vineyard Haven has the Highest Percentage of Immigrants from South America in Massachusetts with 21.72%.
What is the Percentage of Immigrants from South America in the State of Massachusetts?
Percentage of Immigrants from South America in Massachusetts is 2.25%.
What is the Percentage of Immigrants from South America in the United States?
Percentage of Immigrants from South America in the United States is 1.10%.