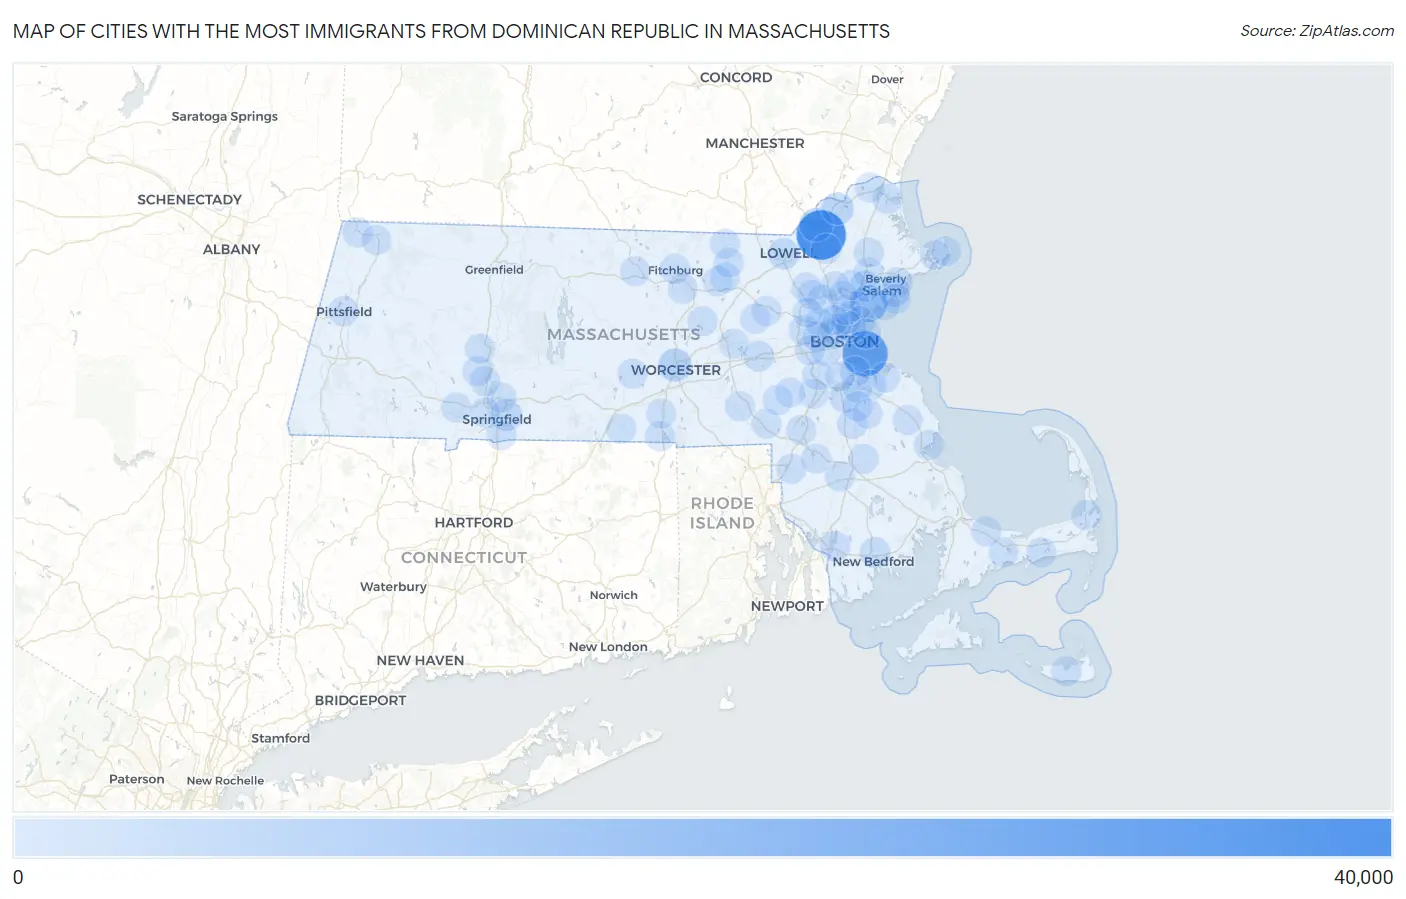
Cities with the Most Immigrants from Dominican Republic in Massachusetts
RELATED REPORTS & OPTIONS
Dominican Republic
Massachusetts
Compare Cities
Map of Cities with the Most Immigrants from Dominican Republic in Massachusetts
0
40,000
Cities with the Most Immigrants from Dominican Republic in Massachusetts
| City | Dominican Republic | vs State | vs National | |
| 1. | Lawrence | 30,009 | 101,767(29.49%)#1 | 1,223,316(2.45%)#3 |
| 2. | Boston | 23,522 | 101,767(23.11%)#2 | 1,223,316(1.92%)#5 |
| 3. | Lynn | 10,374 | 101,767(10.19%)#3 | 1,223,316(0.85%)#13 |
| 4. | Methuen Town | 5,199 | 101,767(5.11%)#4 | 1,223,316(0.42%)#21 |
| 5. | Worcester | 4,500 | 101,767(4.42%)#5 | 1,223,316(0.37%)#24 |
| 6. | Haverhill | 3,500 | 101,767(3.44%)#6 | 1,223,316(0.29%)#32 |
| 7. | Salem | 2,521 | 101,767(2.48%)#7 | 1,223,316(0.21%)#43 |
| 8. | Springfield | 2,441 | 101,767(2.40%)#8 | 1,223,316(0.20%)#46 |
| 9. | Lowell | 1,793 | 101,767(1.76%)#9 | 1,223,316(0.15%)#61 |
| 10. | Peabody | 1,772 | 101,767(1.74%)#10 | 1,223,316(0.14%)#62 |
| 11. | Chelsea | 1,104 | 101,767(1.08%)#11 | 1,223,316(0.09%)#99 |
| 12. | Randolph Town | 1,012 | 101,767(0.99%)#12 | 1,223,316(0.08%)#105 |
| 13. | New Bedford | 1,000 | 101,767(0.98%)#13 | 1,223,316(0.08%)#108 |
| 14. | Framingham | 862 | 101,767(0.85%)#14 | 1,223,316(0.07%)#125 |
| 15. | Brockton | 670 | 101,767(0.66%)#15 | 1,223,316(0.05%)#161 |
| 16. | Fall River | 532 | 101,767(0.52%)#16 | 1,223,316(0.04%)#205 |
| 17. | Beverly | 505 | 101,767(0.50%)#17 | 1,223,316(0.04%)#213 |
| 18. | Revere | 460 | 101,767(0.45%)#18 | 1,223,316(0.04%)#230 |
| 19. | Somerville | 420 | 101,767(0.41%)#19 | 1,223,316(0.03%)#251 |
| 20. | Waltham | 395 | 101,767(0.39%)#20 | 1,223,316(0.03%)#260 |
| 21. | Cambridge | 356 | 101,767(0.35%)#21 | 1,223,316(0.03%)#284 |
| 22. | Quincy | 292 | 101,767(0.29%)#22 | 1,223,316(0.02%)#336 |
| 23. | Nantucket | 246 | 101,767(0.24%)#23 | 1,223,316(0.02%)#385 |
| 24. | Taunton | 242 | 101,767(0.24%)#24 | 1,223,316(0.02%)#392 |
| 25. | Fitchburg | 233 | 101,767(0.23%)#25 | 1,223,316(0.02%)#402 |
| 26. | Clinton | 227 | 101,767(0.22%)#26 | 1,223,316(0.02%)#406 |
| 27. | Holyoke | 221 | 101,767(0.22%)#27 | 1,223,316(0.02%)#419 |
| 28. | Gloucester | 220 | 101,767(0.22%)#28 | 1,223,316(0.02%)#420 |
| 29. | Chicopee | 210 | 101,767(0.21%)#29 | 1,223,316(0.02%)#435 |
| 30. | Westfield | 180 | 101,767(0.18%)#30 | 1,223,316(0.01%)#493 |
| 31. | Norwood | 180 | 101,767(0.18%)#31 | 1,223,316(0.01%)#494 |
| 32. | West Springfield Town | 170 | 101,767(0.17%)#32 | 1,223,316(0.01%)#523 |
| 33. | Malden | 168 | 101,767(0.17%)#33 | 1,223,316(0.01%)#527 |
| 34. | Marlborough | 164 | 101,767(0.16%)#34 | 1,223,316(0.01%)#535 |
| 35. | Milford | 156 | 101,767(0.15%)#35 | 1,223,316(0.01%)#551 |
| 36. | Weymouth Town | 148 | 101,767(0.15%)#36 | 1,223,316(0.01%)#574 |
| 37. | Brookline | 145 | 101,767(0.14%)#37 | 1,223,316(0.01%)#579 |
| 38. | Saugus | 141 | 101,767(0.14%)#38 | 1,223,316(0.01%)#593 |
| 39. | Everett | 140 | 101,767(0.14%)#39 | 1,223,316(0.01%)#596 |
| 40. | Braintree Town | 134 | 101,767(0.13%)#40 | 1,223,316(0.01%)#615 |
| 41. | Leominster | 126 | 101,767(0.12%)#41 | 1,223,316(0.01%)#641 |
| 42. | Barnstable Town | 125 | 101,767(0.12%)#42 | 1,223,316(0.01%)#645 |
| 43. | Easthampton Town | 123 | 101,767(0.12%)#43 | 1,223,316(0.01%)#654 |
| 44. | Watertown Town | 108 | 101,767(0.11%)#44 | 1,223,316(0.01%)#705 |
| 45. | Foxborough | 104 | 101,767(0.10%)#45 | 1,223,316(0.01%)#717 |
| 46. | Pittsfield | 95 | 101,767(0.09%)#46 | 1,223,316(0.01%)#764 |
| 47. | Woburn | 95 | 101,767(0.09%)#47 | 1,223,316(0.01%)#765 |
| 48. | Andover | 95 | 101,767(0.09%)#48 | 1,223,316(0.01%)#769 |
| 49. | Attleboro | 83 | 101,767(0.08%)#49 | 1,223,316(0.01%)#846 |
| 50. | Franklin Town | 82 | 101,767(0.08%)#50 | 1,223,316(0.01%)#855 |
| 51. | Melrose | 82 | 101,767(0.08%)#51 | 1,223,316(0.01%)#856 |
| 52. | Marblehead | 78 | 101,767(0.08%)#52 | 1,223,316(0.01%)#881 |
| 53. | Gardner | 75 | 101,767(0.07%)#53 | 1,223,316(0.01%)#911 |
| 54. | South Yarmouth | 75 | 101,767(0.07%)#54 | 1,223,316(0.01%)#914 |
| 55. | North Attleborough | 74 | 101,767(0.07%)#55 | 1,223,316(0.01%)#924 |
| 56. | Wakefield | 69 | 101,767(0.07%)#56 | 1,223,316(0.01%)#970 |
| 57. | Southbridge Town | 69 | 101,767(0.07%)#57 | 1,223,316(0.01%)#971 |
| 58. | Medford | 68 | 101,767(0.07%)#58 | 1,223,316(0.01%)#979 |
| 59. | Burlington | 67 | 101,767(0.07%)#59 | 1,223,316(0.01%)#986 |
| 60. | Webster | 63 | 101,767(0.06%)#60 | 1,223,316(0.01%)#1,015 |
| 61. | Arlington | 52 | 101,767(0.05%)#61 | 1,223,316(0.00%)#1,124 |
| 62. | Greenfield | 47 | 101,767(0.05%)#62 | 1,223,316(0.00%)#1,185 |
| 63. | Spencer | 45 | 101,767(0.04%)#63 | 1,223,316(0.00%)#1,220 |
| 64. | Holbrook | 44 | 101,767(0.04%)#64 | 1,223,316(0.00%)#1,231 |
| 65. | Millis Clicquot | 44 | 101,767(0.04%)#65 | 1,223,316(0.00%)#1,232 |
| 66. | Dedham | 43 | 101,767(0.04%)#66 | 1,223,316(0.00%)#1,237 |
| 67. | Newton | 42 | 101,767(0.04%)#67 | 1,223,316(0.00%)#1,247 |
| 68. | Amherst | 41 | 101,767(0.04%)#68 | 1,223,316(0.00%)#1,266 |
| 69. | Danvers | 33 | 101,767(0.03%)#69 | 1,223,316(0.00%)#1,430 |
| 70. | Oxford | 33 | 101,767(0.03%)#70 | 1,223,316(0.00%)#1,442 |
| 71. | Winthrop Town | 29 | 101,767(0.03%)#71 | 1,223,316(0.00%)#1,518 |
| 72. | Lynnfield | 29 | 101,767(0.03%)#72 | 1,223,316(0.00%)#1,523 |
| 73. | North Pembroke | 27 | 101,767(0.03%)#73 | 1,223,316(0.00%)#1,584 |
| 74. | Orleans | 27 | 101,767(0.03%)#74 | 1,223,316(0.00%)#1,588 |
| 75. | Swampscott | 26 | 101,767(0.03%)#75 | 1,223,316(0.00%)#1,608 |
| 76. | Topsfield | 26 | 101,767(0.03%)#76 | 1,223,316(0.00%)#1,621 |
| 77. | Bridgewater Town | 23 | 101,767(0.02%)#77 | 1,223,316(0.00%)#1,684 |
| 78. | Longmeadow | 23 | 101,767(0.02%)#78 | 1,223,316(0.00%)#1,689 |
| 79. | Hingham | 21 | 101,767(0.02%)#79 | 1,223,316(0.00%)#1,773 |
| 80. | Milton | 20 | 101,767(0.02%)#80 | 1,223,316(0.00%)#1,787 |
| 81. | Williamstown | 18 | 101,767(0.02%)#81 | 1,223,316(0.00%)#1,870 |
| 82. | Norton Center | 18 | 101,767(0.02%)#82 | 1,223,316(0.00%)#1,877 |
| 83. | Newburyport | 17 | 101,767(0.02%)#83 | 1,223,316(0.00%)#1,900 |
| 84. | Maynard | 17 | 101,767(0.02%)#84 | 1,223,316(0.00%)#1,907 |
| 85. | Devens | 16 | 101,767(0.02%)#85 | 1,223,316(0.00%)#1,974 |
| 86. | Reading | 15 | 101,767(0.01%)#86 | 1,223,316(0.00%)#1,988 |
| 87. | Pepperell | 15 | 101,767(0.01%)#87 | 1,223,316(0.00%)#2,012 |
| 88. | Rockport | 13 | 101,767(0.01%)#88 | 1,223,316(0.00%)#2,090 |
| 89. | Amesbury Town | 12 | 101,767(0.01%)#89 | 1,223,316(0.00%)#2,122 |
| 90. | Medfield | 12 | 101,767(0.01%)#90 | 1,223,316(0.00%)#2,137 |
| 91. | Northampton | 10 | 101,767(0.01%)#91 | 1,223,316(0.00%)#2,219 |
| 92. | Ayer | 9 | 101,767(0.01%)#92 | 1,223,316(0.00%)#2,300 |
| 93. | Abington | 8 | 101,767(0.01%)#93 | 1,223,316(0.00%)#2,336 |
| 94. | Groton | 8 | 101,767(0.01%)#94 | 1,223,316(0.00%)#2,364 |
| 95. | North Adams | 7 | 101,767(0.01%)#95 | 1,223,316(0.00%)#2,392 |
| 96. | West Concord | 7 | 101,767(0.01%)#96 | 1,223,316(0.00%)#2,400 |
| 97. | Pinehurst | 7 | 101,767(0.01%)#97 | 1,223,316(0.00%)#2,401 |
| 98. | East Sandwich | 5 | 101,767(0.00%)#98 | 1,223,316(0.00%)#2,529 |
| 99. | South Duxbury | 3 | 101,767(0.00%)#99 | 1,223,316(0.00%)#2,629 |
| 100. | Lexington | 2 | 101,767(0.00%)#100 | 1,223,316(0.00%)#2,666 |
Common Questions
What are the Top 10 Cities with the Most Immigrants from Dominican Republic in Massachusetts?
Top 10 Cities with the Most Immigrants from Dominican Republic in Massachusetts are:
#1
30,009
#2
23,522
#3
10,374
#4
5,199
#5
4,500
#6
3,500
#7
2,521
#8
2,441
#9
1,793
#10
1,772
What city has the Most Immigrants from Dominican Republic in Massachusetts?
Lawrence has the Most Immigrants from Dominican Republic in Massachusetts with 30,009.
What is the Total Immigrants from Dominican Republic in the State of Massachusetts?
Total Immigrants from Dominican Republic in Massachusetts is 101,767.
What is the Total Immigrants from Dominican Republic in the United States?
Total Immigrants from Dominican Republic in the United States is 1,223,316.