Cities with the Most Immigrants from China in Massachusetts
RELATED REPORTS & OPTIONS
China
Massachusetts
Compare Cities
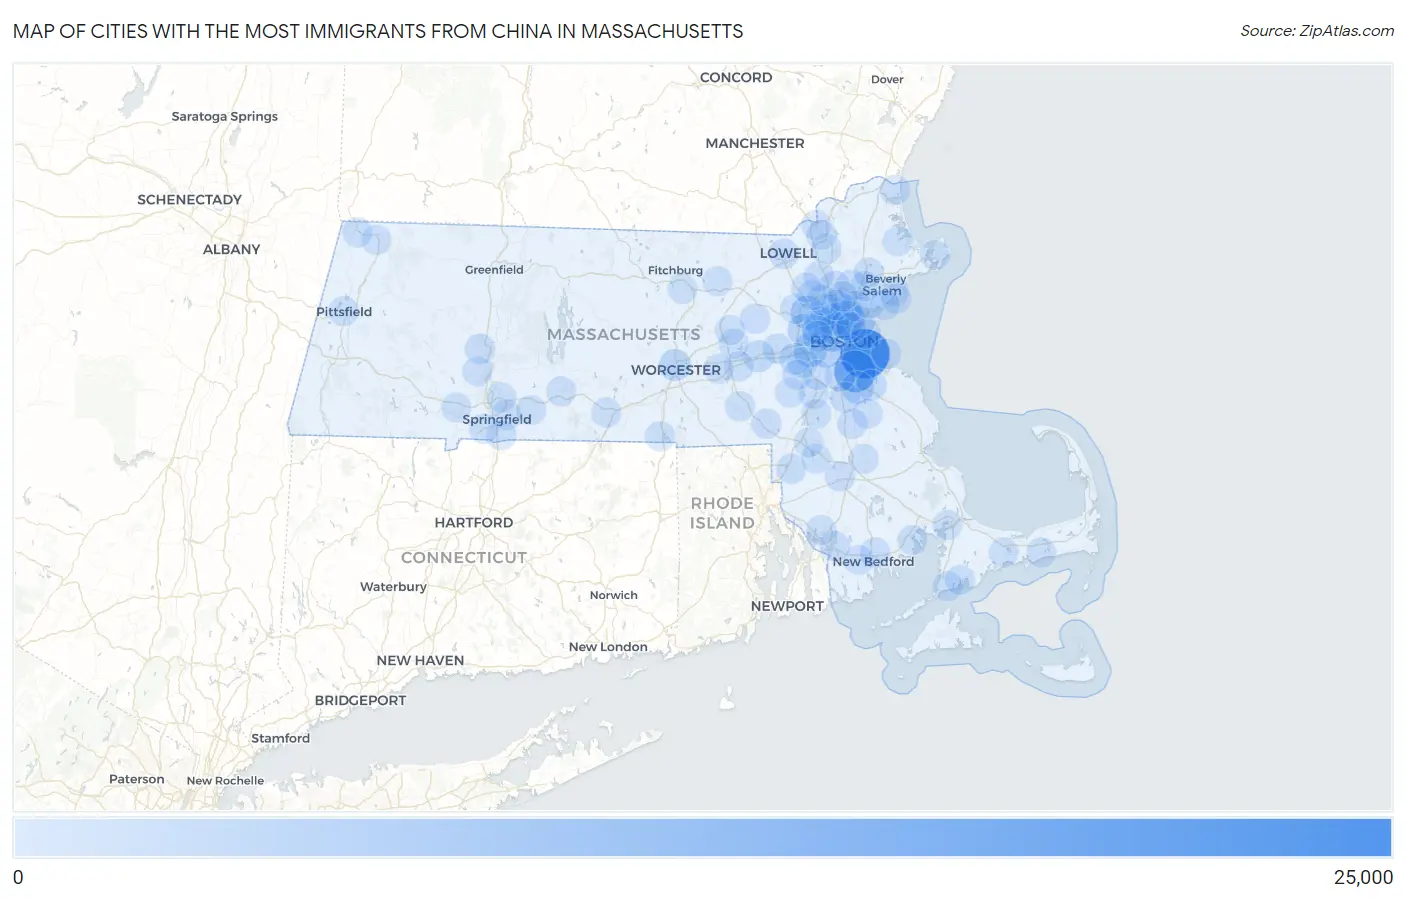
Map of Cities with the Most Immigrants from China in Massachusetts
0
25,000
Cities with the Most Immigrants from China in Massachusetts
| City | China | vs State | vs National | |
| 1. | Boston | 22,132 | 120,039(18.44%)#1 | 2,829,008(0.78%)#12 |
| 2. | Quincy | 13,259 | 120,039(11.05%)#2 | 2,829,008(0.47%)#21 |
| 3. | Malden | 7,527 | 120,039(6.27%)#3 | 2,829,008(0.27%)#44 |
| 4. | Cambridge | 6,086 | 120,039(5.07%)#4 | 2,829,008(0.22%)#53 |
| 5. | Newton | 4,064 | 120,039(3.39%)#5 | 2,829,008(0.14%)#91 |
| 6. | Lexington | 4,019 | 120,039(3.35%)#6 | 2,829,008(0.14%)#94 |
| 7. | Brookline | 3,431 | 120,039(2.86%)#7 | 2,829,008(0.12%)#103 |
| 8. | Braintree Town | 2,951 | 120,039(2.46%)#8 | 2,829,008(0.10%)#119 |
| 9. | Waltham | 2,814 | 120,039(2.34%)#9 | 2,829,008(0.10%)#129 |
| 10. | Worcester | 2,174 | 120,039(1.81%)#10 | 2,829,008(0.08%)#158 |
| 11. | Medford | 2,107 | 120,039(1.76%)#11 | 2,829,008(0.07%)#161 |
| 12. | Belmont | 1,844 | 120,039(1.54%)#12 | 2,829,008(0.07%)#184 |
| 13. | Somerville | 1,600 | 120,039(1.33%)#13 | 2,829,008(0.06%)#214 |
| 14. | Framingham | 1,583 | 120,039(1.32%)#14 | 2,829,008(0.06%)#218 |
| 15. | Wellesley | 1,492 | 120,039(1.24%)#15 | 2,829,008(0.05%)#230 |
| 16. | Winchester | 1,443 | 120,039(1.20%)#16 | 2,829,008(0.05%)#240 |
| 17. | Arlington | 1,343 | 120,039(1.12%)#17 | 2,829,008(0.05%)#263 |
| 18. | Melrose | 1,135 | 120,039(0.95%)#18 | 2,829,008(0.04%)#307 |
| 19. | Amherst | 1,071 | 120,039(0.89%)#19 | 2,829,008(0.04%)#327 |
| 20. | Weymouth Town | 1,022 | 120,039(0.85%)#20 | 2,829,008(0.04%)#342 |
| 21. | Needham | 882 | 120,039(0.73%)#21 | 2,829,008(0.03%)#393 |
| 22. | Revere | 722 | 120,039(0.60%)#22 | 2,829,008(0.03%)#468 |
| 23. | Randolph Town | 694 | 120,039(0.58%)#23 | 2,829,008(0.02%)#486 |
| 24. | Reading | 685 | 120,039(0.57%)#24 | 2,829,008(0.02%)#493 |
| 25. | Watertown Town | 678 | 120,039(0.56%)#25 | 2,829,008(0.02%)#498 |
| 26. | Woburn | 525 | 120,039(0.44%)#26 | 2,829,008(0.02%)#612 |
| 27. | Everett | 507 | 120,039(0.42%)#27 | 2,829,008(0.02%)#628 |
| 28. | Milton | 485 | 120,039(0.40%)#28 | 2,829,008(0.02%)#645 |
| 29. | Stoneham | 465 | 120,039(0.39%)#29 | 2,829,008(0.02%)#669 |
| 30. | Lynnfield | 457 | 120,039(0.38%)#30 | 2,829,008(0.02%)#677 |
| 31. | Lowell | 433 | 120,039(0.36%)#31 | 2,829,008(0.02%)#697 |
| 32. | Franklin Town | 386 | 120,039(0.32%)#32 | 2,829,008(0.01%)#758 |
| 33. | Taunton | 354 | 120,039(0.29%)#33 | 2,829,008(0.01%)#819 |
| 34. | Springfield | 336 | 120,039(0.28%)#34 | 2,829,008(0.01%)#848 |
| 35. | Northampton | 335 | 120,039(0.28%)#35 | 2,829,008(0.01%)#851 |
| 36. | Brockton | 331 | 120,039(0.28%)#36 | 2,829,008(0.01%)#856 |
| 37. | Saugus | 312 | 120,039(0.26%)#37 | 2,829,008(0.01%)#900 |
| 38. | Cochituate | 312 | 120,039(0.26%)#38 | 2,829,008(0.01%)#901 |
| 39. | Marlborough | 296 | 120,039(0.25%)#39 | 2,829,008(0.01%)#930 |
| 40. | Wilmington | 293 | 120,039(0.24%)#40 | 2,829,008(0.01%)#941 |
| 41. | Chelsea | 288 | 120,039(0.24%)#41 | 2,829,008(0.01%)#946 |
| 42. | Burlington | 278 | 120,039(0.23%)#42 | 2,829,008(0.01%)#971 |
| 43. | Andover | 258 | 120,039(0.21%)#43 | 2,829,008(0.01%)#1,049 |
| 44. | Fall River | 257 | 120,039(0.21%)#44 | 2,829,008(0.01%)#1,051 |
| 45. | North Attleborough | 249 | 120,039(0.21%)#45 | 2,829,008(0.01%)#1,067 |
| 46. | New Bedford | 241 | 120,039(0.20%)#46 | 2,829,008(0.01%)#1,093 |
| 47. | Norwood | 229 | 120,039(0.19%)#47 | 2,829,008(0.01%)#1,150 |
| 48. | Lynn | 220 | 120,039(0.18%)#48 | 2,829,008(0.01%)#1,189 |
| 49. | Maynard | 216 | 120,039(0.18%)#49 | 2,829,008(0.01%)#1,205 |
| 50. | Attleboro | 212 | 120,039(0.18%)#50 | 2,829,008(0.01%)#1,224 |
| 51. | Peabody | 205 | 120,039(0.17%)#51 | 2,829,008(0.01%)#1,256 |
| 52. | Wakefield | 198 | 120,039(0.16%)#52 | 2,829,008(0.01%)#1,293 |
| 53. | Salem | 188 | 120,039(0.16%)#53 | 2,829,008(0.01%)#1,337 |
| 54. | Danvers | 162 | 120,039(0.13%)#54 | 2,829,008(0.01%)#1,482 |
| 55. | Dedham | 161 | 120,039(0.13%)#55 | 2,829,008(0.01%)#1,490 |
| 56. | Barnstable Town | 158 | 120,039(0.13%)#56 | 2,829,008(0.01%)#1,508 |
| 57. | Cordaville | 156 | 120,039(0.13%)#57 | 2,829,008(0.01%)#1,533 |
| 58. | Chicopee | 155 | 120,039(0.13%)#58 | 2,829,008(0.01%)#1,534 |
| 59. | Hanscom Afb | 154 | 120,039(0.13%)#59 | 2,829,008(0.01%)#1,548 |
| 60. | Palmer Town | 139 | 120,039(0.12%)#60 | 2,829,008(0.00%)#1,642 |
| 61. | Westfield | 129 | 120,039(0.11%)#61 | 2,829,008(0.00%)#1,722 |
| 62. | Medfield | 123 | 120,039(0.10%)#62 | 2,829,008(0.00%)#1,785 |
| 63. | Methuen Town | 120 | 120,039(0.10%)#63 | 2,829,008(0.00%)#1,802 |
| 64. | Longmeadow | 120 | 120,039(0.10%)#64 | 2,829,008(0.00%)#1,809 |
| 65. | Sharon | 118 | 120,039(0.10%)#65 | 2,829,008(0.00%)#1,826 |
| 66. | Winthrop Town | 117 | 120,039(0.10%)#66 | 2,829,008(0.00%)#1,832 |
| 67. | Easthampton Town | 112 | 120,039(0.09%)#67 | 2,829,008(0.00%)#1,880 |
| 68. | Devens | 110 | 120,039(0.09%)#68 | 2,829,008(0.00%)#1,901 |
| 69. | Falmouth | 109 | 120,039(0.09%)#69 | 2,829,008(0.00%)#1,913 |
| 70. | Dover | 107 | 120,039(0.09%)#70 | 2,829,008(0.00%)#1,940 |
| 71. | Leominster | 105 | 120,039(0.09%)#71 | 2,829,008(0.00%)#1,955 |
| 72. | Somerset | 104 | 120,039(0.09%)#72 | 2,829,008(0.00%)#1,963 |
| 73. | Salisbury | 104 | 120,039(0.09%)#73 | 2,829,008(0.00%)#1,970 |
| 74. | Ipswich | 97 | 120,039(0.08%)#74 | 2,829,008(0.00%)#2,068 |
| 75. | Abington | 95 | 120,039(0.08%)#75 | 2,829,008(0.00%)#2,091 |
| 76. | Marblehead | 90 | 120,039(0.07%)#76 | 2,829,008(0.00%)#2,147 |
| 77. | Westborough | 90 | 120,039(0.07%)#77 | 2,829,008(0.00%)#2,155 |
| 78. | Gloucester | 85 | 120,039(0.07%)#78 | 2,829,008(0.00%)#2,224 |
| 79. | Hudson | 83 | 120,039(0.07%)#79 | 2,829,008(0.00%)#2,247 |
| 80. | Lawrence | 82 | 120,039(0.07%)#80 | 2,829,008(0.00%)#2,258 |
| 81. | Wilbraham | 81 | 120,039(0.07%)#81 | 2,829,008(0.00%)#2,293 |
| 82. | Hull | 76 | 120,039(0.06%)#82 | 2,829,008(0.00%)#2,367 |
| 83. | Norton Center | 75 | 120,039(0.06%)#83 | 2,829,008(0.00%)#2,392 |
| 84. | Bridgewater Town | 73 | 120,039(0.06%)#84 | 2,829,008(0.00%)#2,410 |
| 85. | North Adams | 64 | 120,039(0.05%)#85 | 2,829,008(0.00%)#2,595 |
| 86. | Agawam Town | 63 | 120,039(0.05%)#86 | 2,829,008(0.00%)#2,614 |
| 87. | Mansfield Center | 59 | 120,039(0.05%)#87 | 2,829,008(0.00%)#2,715 |
| 88. | Williamstown | 57 | 120,039(0.05%)#88 | 2,829,008(0.00%)#2,766 |
| 89. | Marion Center | 53 | 120,039(0.04%)#89 | 2,829,008(0.00%)#2,858 |
| 90. | Pinehurst | 51 | 120,039(0.04%)#90 | 2,829,008(0.00%)#2,913 |
| 91. | Swampscott | 49 | 120,039(0.04%)#91 | 2,829,008(0.00%)#2,972 |
| 92. | South Yarmouth | 49 | 120,039(0.04%)#92 | 2,829,008(0.00%)#2,976 |
| 93. | Buzzards Bay | 49 | 120,039(0.04%)#93 | 2,829,008(0.00%)#2,991 |
| 94. | Smith Mills | 48 | 120,039(0.04%)#94 | 2,829,008(0.00%)#3,026 |
| 95. | Webster | 47 | 120,039(0.04%)#95 | 2,829,008(0.00%)#3,045 |
| 96. | Fiskdale | 47 | 120,039(0.04%)#96 | 2,829,008(0.00%)#3,058 |
| 97. | East Falmouth | 42 | 120,039(0.03%)#97 | 2,829,008(0.00%)#3,212 |
| 98. | Pittsfield | 41 | 120,039(0.03%)#98 | 2,829,008(0.00%)#3,226 |
| 99. | Milford | 40 | 120,039(0.03%)#99 | 2,829,008(0.00%)#3,262 |
| 100. | Greenfield | 39 | 120,039(0.03%)#100 | 2,829,008(0.00%)#3,308 |
Common Questions
What are the Top 10 Cities with the Most Immigrants from China in Massachusetts?
Top 10 Cities with the Most Immigrants from China in Massachusetts are:
What city has the Most Immigrants from China in Massachusetts?
Boston has the Most Immigrants from China in Massachusetts with 22,132.
What is the Total Immigrants from China in the State of Massachusetts?
Total Immigrants from China in Massachusetts is 120,039.
What is the Total Immigrants from China in the United States?
Total Immigrants from China in the United States is 2,829,008.