Nantucket, MA
Nantucket Map
Nantucket Overview
10,479
TOTAL POPULATION
5,584
MALE POPULATION
4,895
FEMALE POPULATION
114.08
MALES / 100 FEMALES
87.66
FEMALES / 100 MALES
39.7
MEDIAN AGE
3.6
AVG FAMILY SIZE
3.1
AVG HOUSEHOLD SIZE
$56,829
PER CAPITA INCOME
$134,138
AVG FAMILY INCOME
$131,736
AVG HOUSEHOLD INCOME
2.6%
WAGE / INCOME GAP [ % ]
97.4¢/ $1
WAGE / INCOME GAP [ $ ]
0.44
INEQUALITY / GINI INDEX
6,012
LABOR FORCE [ PEOPLE ]
71.5%
PERCENT IN LABOR FORCE
6.3%
UNEMPLOYMENT RATE
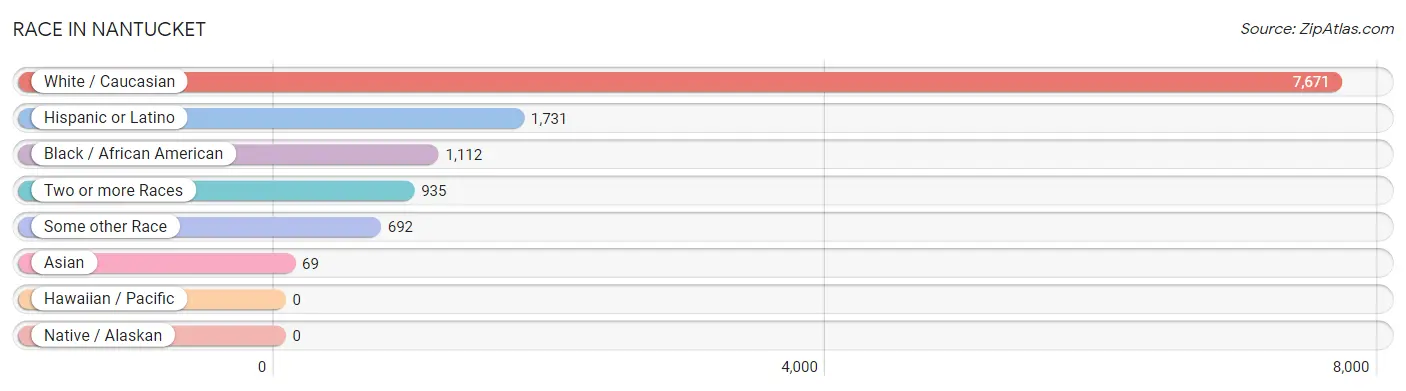
Race in Nantucket
The most populous races in Nantucket are White / Caucasian (7,671 | 73.2%), Hispanic or Latino (1,731 | 16.5%), and Black / African American (1,112 | 10.6%).
| Race | # Population | % Population |
| Asian | 69 | 0.7% |
| Black / African American | 1,112 | 10.6% |
| Hawaiian / Pacific | 0 | 0.0% |
| Hispanic or Latino | 1,731 | 16.5% |
| Native / Alaskan | 0 | 0.0% |
| White / Caucasian | 7,671 | 73.2% |
| Two or more Races | 935 | 8.9% |
| Some other Race | 692 | 6.6% |
| Total | 10,479 | 100.0% |
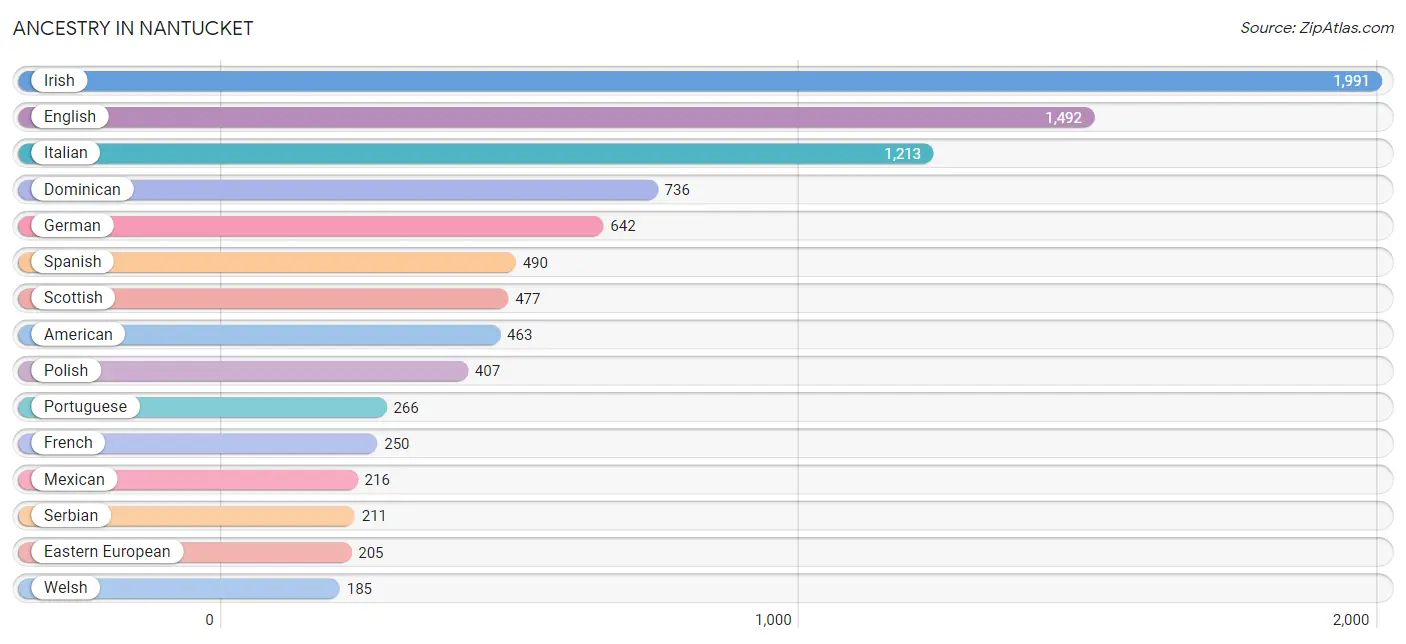
Ancestry in Nantucket
The most populous ancestries reported in Nantucket are Irish (1,991 | 19.0%), English (1,492 | 14.2%), Italian (1,213 | 11.6%), Dominican (736 | 7.0%), and German (642 | 6.1%), together accounting for 58.0% of all Nantucket residents.
| Ancestry | # Population | % Population |
| African | 8 | 0.1% |
| American | 463 | 4.4% |
| Arab | 6 | 0.1% |
| Armenian | 6 | 0.1% |
| Austrian | 4 | 0.0% |
| Bhutanese | 4 | 0.0% |
| British | 24 | 0.2% |
| Bulgarian | 51 | 0.5% |
| Canadian | 27 | 0.3% |
| Celtic | 8 | 0.1% |
| Central American | 66 | 0.6% |
| Croatian | 11 | 0.1% |
| Cuban | 90 | 0.9% |
| Czechoslovakian | 6 | 0.1% |
| Danish | 23 | 0.2% |
| Dominican | 736 | 7.0% |
| Dutch | 86 | 0.8% |
| Eastern European | 205 | 2.0% |
| English | 1,492 | 14.2% |
| European | 83 | 0.8% |
| Finnish | 3 | 0.0% |
| French | 250 | 2.4% |
| French Canadian | 101 | 1.0% |
| German | 642 | 6.1% |
| Greek | 1 | 0.0% |
| Honduran | 1 | 0.0% |
| Hungarian | 32 | 0.3% |
| Indian (Asian) | 21 | 0.2% |
| Irish | 1,991 | 19.0% |
| Italian | 1,213 | 11.6% |
| Jamaican | 76 | 0.7% |
| Latvian | 27 | 0.3% |
| Lebanese | 6 | 0.1% |
| Lithuanian | 32 | 0.3% |
| Mexican | 216 | 2.1% |
| Northern European | 7 | 0.1% |
| Norwegian | 140 | 1.3% |
| Polish | 407 | 3.9% |
| Portuguese | 266 | 2.5% |
| Puerto Rican | 29 | 0.3% |
| Russian | 87 | 0.8% |
| Salvadoran | 65 | 0.6% |
| Scotch-Irish | 54 | 0.5% |
| Scottish | 477 | 4.5% |
| Serbian | 211 | 2.0% |
| Slovak | 18 | 0.2% |
| Spaniard | 93 | 0.9% |
| Spanish | 490 | 4.7% |
| Subsaharan African | 8 | 0.1% |
| Swedish | 124 | 1.2% |
| Swiss | 18 | 0.2% |
| Thai | 48 | 0.5% |
| Ukrainian | 8 | 0.1% |
| Welsh | 185 | 1.8% | View All 54 Rows |
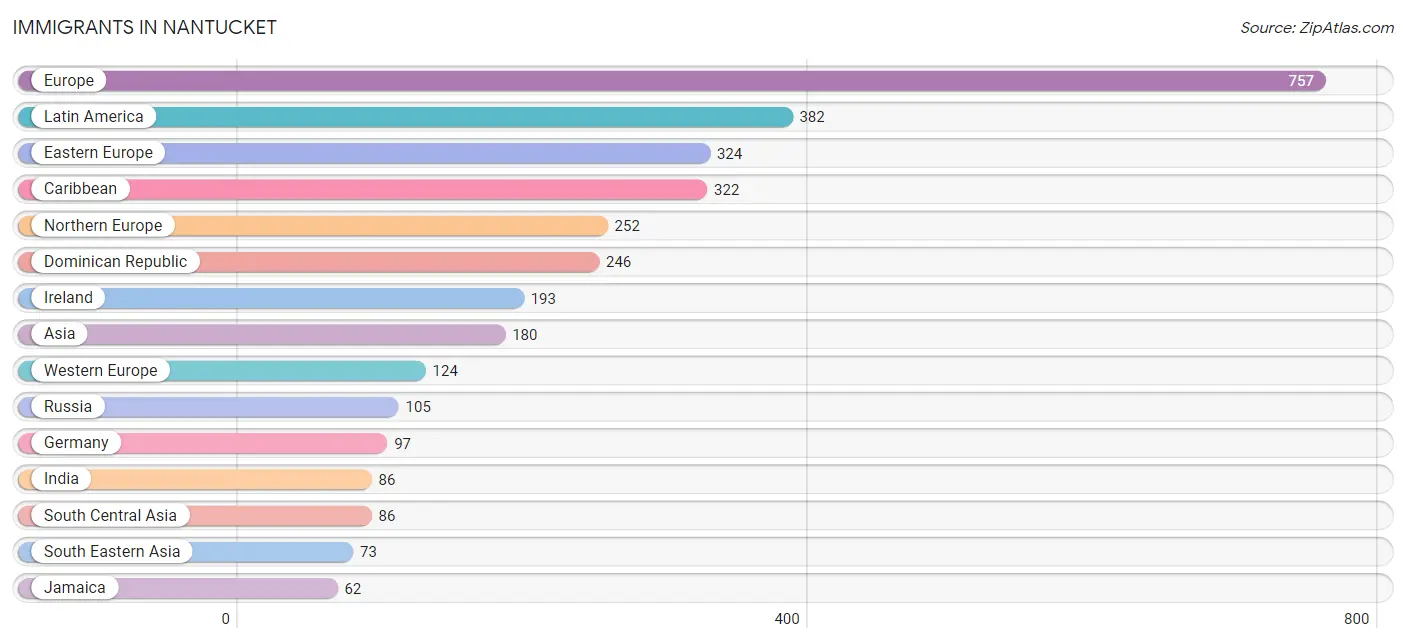
Immigrants in Nantucket
The most numerous immigrant groups reported in Nantucket came from Europe (757 | 7.2%), Latin America (382 | 3.6%), Eastern Europe (324 | 3.1%), Caribbean (322 | 3.1%), and Northern Europe (252 | 2.4%), together accounting for 19.4% of all Nantucket residents.
| Immigration Origin | # Population | % Population |
| Asia | 180 | 1.7% |
| Austria | 22 | 0.2% |
| Belarus | 20 | 0.2% |
| Brazil | 59 | 0.6% |
| Bulgaria | 47 | 0.4% |
| Canada | 29 | 0.3% |
| Caribbean | 322 | 3.1% |
| Central America | 1 | 0.0% |
| China | 21 | 0.2% |
| Croatia | 11 | 0.1% |
| Denmark | 5 | 0.1% |
| Dominican Republic | 246 | 2.4% |
| Eastern Asia | 21 | 0.2% |
| Eastern Europe | 324 | 3.1% |
| England | 28 | 0.3% |
| Europe | 757 | 7.2% |
| France | 5 | 0.1% |
| Germany | 97 | 0.9% |
| Haiti | 14 | 0.1% |
| Honduras | 1 | 0.0% |
| Hong Kong | 12 | 0.1% |
| India | 86 | 0.8% |
| Ireland | 193 | 1.8% |
| Jamaica | 62 | 0.6% |
| Latin America | 382 | 3.6% |
| Latvia | 27 | 0.3% |
| Lithuania | 17 | 0.2% |
| Northern Europe | 252 | 2.4% |
| Philippines | 42 | 0.4% |
| Poland | 62 | 0.6% |
| Portugal | 54 | 0.5% |
| Russia | 105 | 1.0% |
| Scotland | 7 | 0.1% |
| Serbia | 35 | 0.3% |
| South America | 59 | 0.6% |
| South Central Asia | 86 | 0.8% |
| South Eastern Asia | 73 | 0.7% |
| Southern Europe | 57 | 0.5% |
| Spain | 3 | 0.0% |
| Vietnam | 31 | 0.3% |
| Western Europe | 124 | 1.2% | View All 41 Rows |
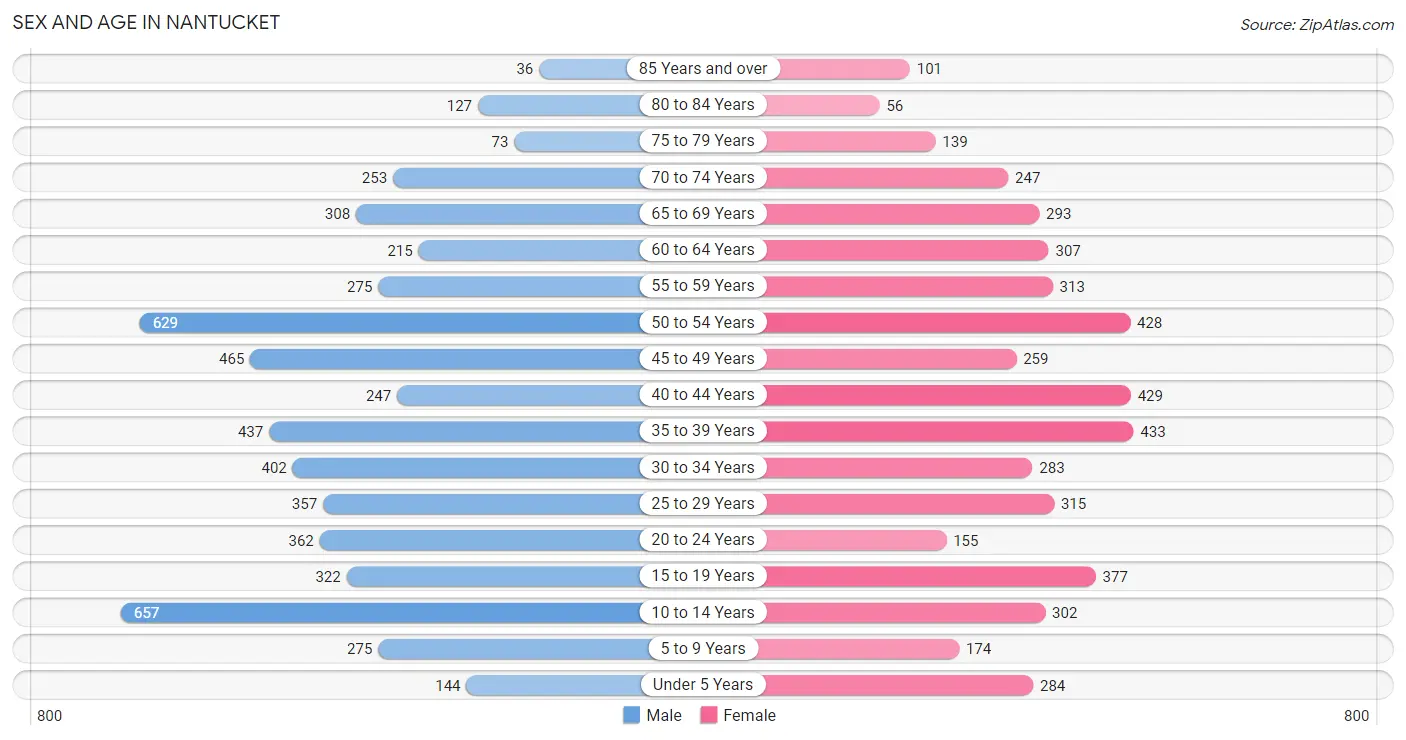
Sex and Age in Nantucket
Sex and Age in Nantucket
The most populous age groups in Nantucket are 10 to 14 Years (657 | 11.8%) for men and 35 to 39 Years (433 | 8.8%) for women.
| Age Bracket | Male | Female |
| Under 5 Years | 144 (2.6%) | 284 (5.8%) |
| 5 to 9 Years | 275 (4.9%) | 174 (3.5%) |
| 10 to 14 Years | 657 (11.8%) | 302 (6.2%) |
| 15 to 19 Years | 322 (5.8%) | 377 (7.7%) |
| 20 to 24 Years | 362 (6.5%) | 155 (3.2%) |
| 25 to 29 Years | 357 (6.4%) | 315 (6.4%) |
| 30 to 34 Years | 402 (7.2%) | 283 (5.8%) |
| 35 to 39 Years | 437 (7.8%) | 433 (8.8%) |
| 40 to 44 Years | 247 (4.4%) | 429 (8.8%) |
| 45 to 49 Years | 465 (8.3%) | 259 (5.3%) |
| 50 to 54 Years | 629 (11.3%) | 428 (8.7%) |
| 55 to 59 Years | 275 (4.9%) | 313 (6.4%) |
| 60 to 64 Years | 215 (3.8%) | 307 (6.3%) |
| 65 to 69 Years | 308 (5.5%) | 293 (6.0%) |
| 70 to 74 Years | 253 (4.5%) | 247 (5.1%) |
| 75 to 79 Years | 73 (1.3%) | 139 (2.8%) |
| 80 to 84 Years | 127 (2.3%) | 56 (1.1%) |
| 85 Years and over | 36 (0.6%) | 101 (2.1%) |
| Total | 5,584 (100.0%) | 4,895 (100.0%) |
Families and Households in Nantucket
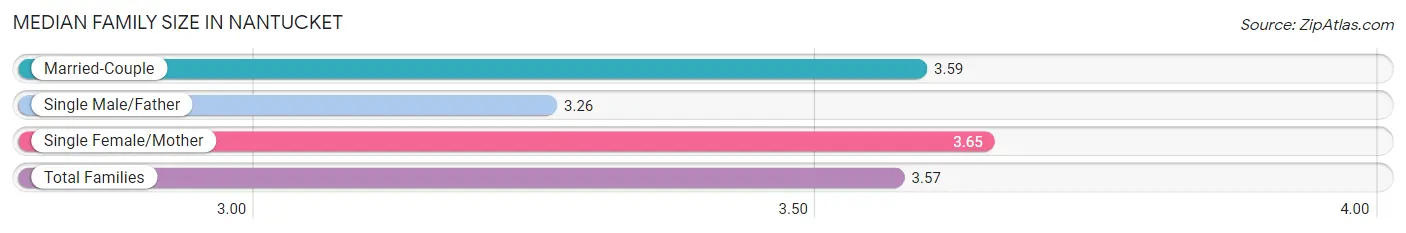
Median Family Size in Nantucket
The median family size in Nantucket is 3.57 persons per family, with single female/mother families (267 | 12.4%) accounting for the largest median family size of 3.65 persons per family. On the other hand, single male/father families (149 | 6.9%) represent the smallest median family size with 3.26 persons per family.
| Family Type | # Families | Family Size |
| Married-Couple | 1,736 (80.7%) | 3.59 |
| Single Male/Father | 149 (6.9%) | 3.26 |
| Single Female/Mother | 267 (12.4%) | 3.65 |
| Total Families | 2,152 (100.0%) | 3.57 |
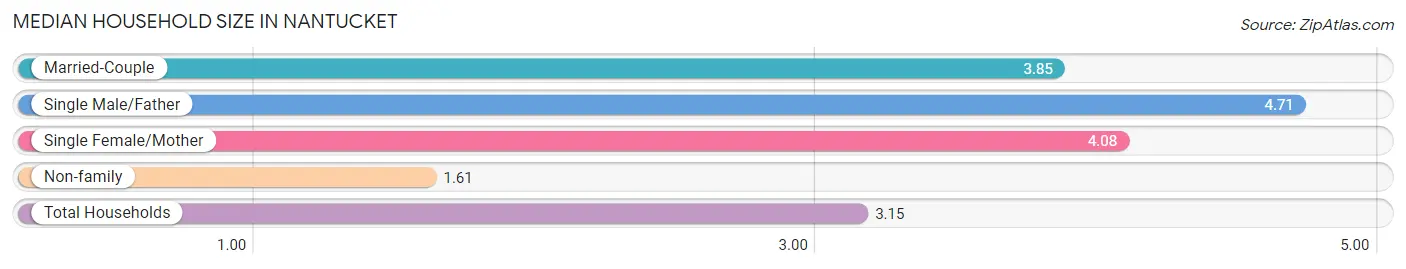
Median Household Size in Nantucket
The median household size in Nantucket is 3.15 persons per household, with single male/father households (149 | 4.6%) accounting for the largest median household size of 4.71 persons per household. non-family households (1,109 | 34.0%) represent the smallest median household size with 1.61 persons per household.
| Household Type | # Households | Household Size |
| Married-Couple | 1,736 (53.2%) | 3.85 |
| Single Male/Father | 149 (4.6%) | 4.71 |
| Single Female/Mother | 267 (8.2%) | 4.08 |
| Non-family | 1,109 (34.0%) | 1.61 |
| Total Households | 3,261 (100.0%) | 3.15 |
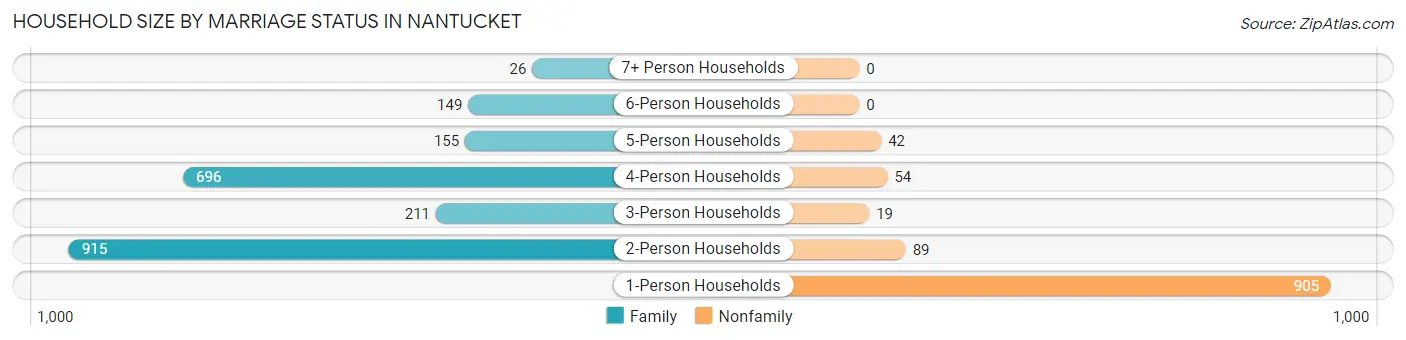
Household Size by Marriage Status in Nantucket
Out of a total of 3,261 households in Nantucket, 2,152 (66.0%) are family households, while 1,109 (34.0%) are nonfamily households. The most numerous type of family households are 2-person households, comprising 915, and the most common type of nonfamily households are 1-person households, comprising 905.
| Household Size | Family Households | Nonfamily Households |
| 1-Person Households | - | 905 (27.8%) |
| 2-Person Households | 915 (28.1%) | 89 (2.7%) |
| 3-Person Households | 211 (6.5%) | 19 (0.6%) |
| 4-Person Households | 696 (21.3%) | 54 (1.7%) |
| 5-Person Households | 155 (4.8%) | 42 (1.3%) |
| 6-Person Households | 149 (4.6%) | 0 (0.0%) |
| 7+ Person Households | 26 (0.8%) | 0 (0.0%) |
| Total | 2,152 (66.0%) | 1,109 (34.0%) |
Female Fertility in Nantucket
Fertility by Age in Nantucket
Average fertility rate in Nantucket is 39.0 births per 1,000 women. Women in the age bracket of 35 to 50 years have the highest fertility rate with 56.0 births per 1,000 women. Women in the age bracket of 35 to 50 years acount for 74.4% of all women with births.
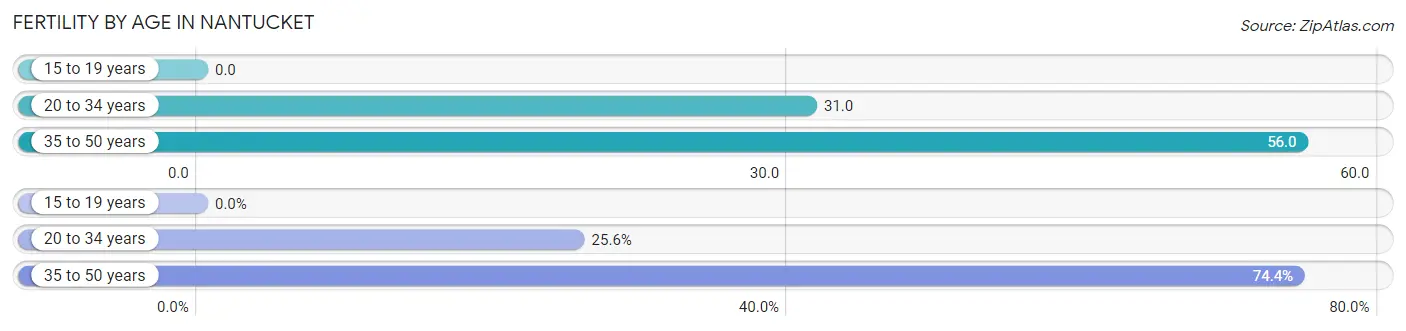
| Age Bracket | Women with Births | Births / 1,000 Women |
| 15 to 19 years | 0 (0.0%) | 0.0 |
| 20 to 34 years | 23 (25.6%) | 31.0 |
| 35 to 50 years | 67 (74.4%) | 56.0 |
| Total | 90 (100.0%) | 39.0 |
Fertility by Age by Marriage Status in Nantucket
43.3% of women with births (90) in Nantucket are married. The highest percentage of unmarried women with births falls into 20 to 34 years age bracket with 73.9% of them unmarried at the time of birth, while the lowest percentage of unmarried women with births belong to 35 to 50 years age bracket with 50.8% of them unmarried.
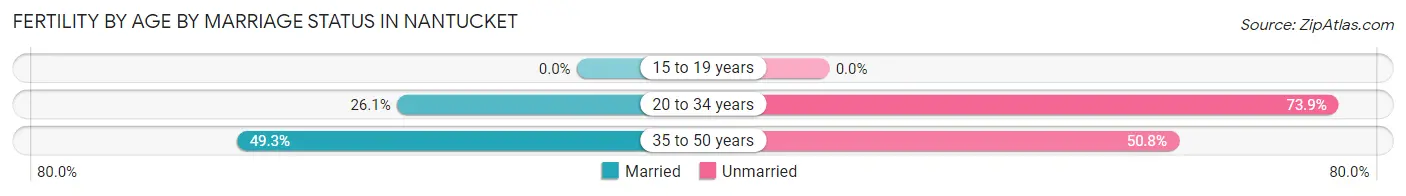
| Age Bracket | Married | Unmarried |
| 15 to 19 years | 0 (0.0%) | 0 (0.0%) |
| 20 to 34 years | 6 (26.1%) | 17 (73.9%) |
| 35 to 50 years | 33 (49.2%) | 34 (50.7%) |
| Total | 39 (43.3%) | 51 (56.7%) |
Fertility by Education in Nantucket
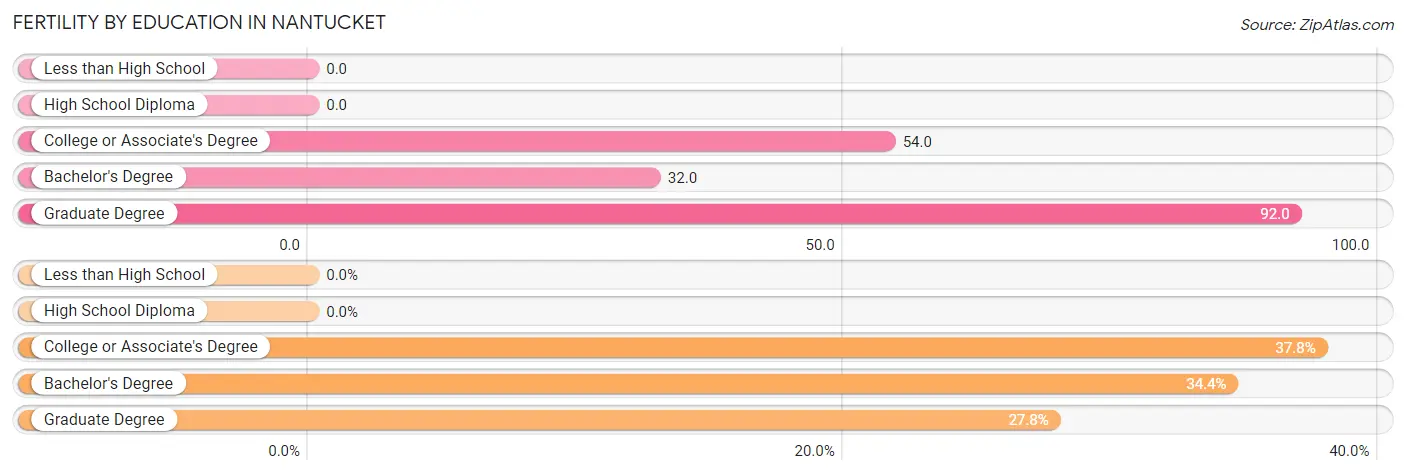
| Educational Attainment | Women with Births | Births / 1,000 Women |
| Less than High School | 0 (0.0%) | 0.0 |
| High School Diploma | 0 (0.0%) | 0.0 |
| College or Associate's Degree | 34 (37.8%) | 54.0 |
| Bachelor's Degree | 31 (34.4%) | 32.0 |
| Graduate Degree | 25 (27.8%) | 92.0 |
| Total | 90 (100.0%) | 39.0 |
Fertility by Education by Marriage Status in Nantucket
56.7% of women with births in Nantucket are unmarried. Women with the educational attainment of graduate degree are most likely to be married with 100.0% of them married at childbirth, while women with the educational attainment of college or associate's degree are least likely to be married with 100.0% of them unmarried at childbirth.
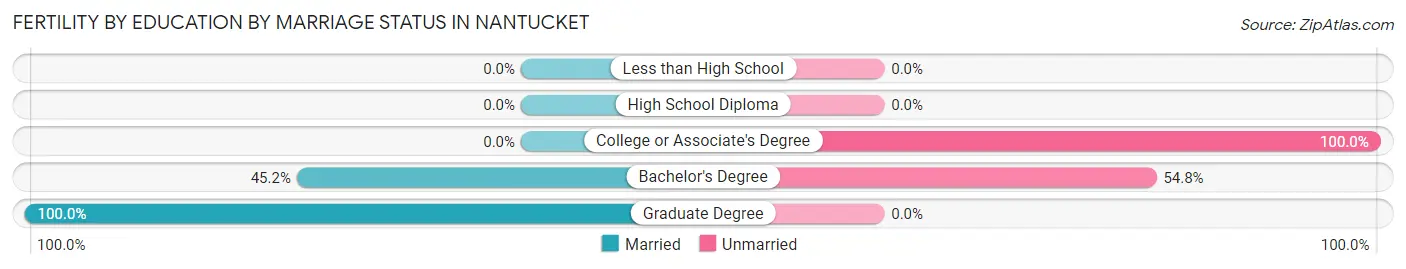
| Educational Attainment | Married | Unmarried |
| Less than High School | 0 (0.0%) | 0 (0.0%) |
| High School Diploma | 0 (0.0%) | 0 (0.0%) |
| College or Associate's Degree | 0 (0.0%) | 34 (100.0%) |
| Bachelor's Degree | 14 (45.2%) | 17 (54.8%) |
| Graduate Degree | 25 (100.0%) | 0 (0.0%) |
| Total | 39 (43.3%) | 51 (56.7%) |
Income in Nantucket
Income Overview in Nantucket
Per Capita Income in Nantucket is $56,829, while median incomes of families and households are $134,138 and $131,736 respectively.
| Characteristic | Number | Measure |
| Per Capita Income | 10,479 | $56,829 |
| Median Family Income | 2,152 | $134,138 |
| Mean Family Income | 2,152 | $171,828 |
| Median Household Income | 3,261 | $131,736 |
| Mean Household Income | 3,261 | $165,471 |
| Income Deficit | 2,152 | $0 |
| Wage / Income Gap (%) | 10,479 | 2.62% |
| Wage / Income Gap ($) | 10,479 | 97.38¢ per $1 |
| Gini / Inequality Index | 10,479 | 0.44 |
Earnings by Sex in Nantucket
Average Earnings in Nantucket are $54,649, $55,673 for men and $54,216 for women, a difference of 2.6%.
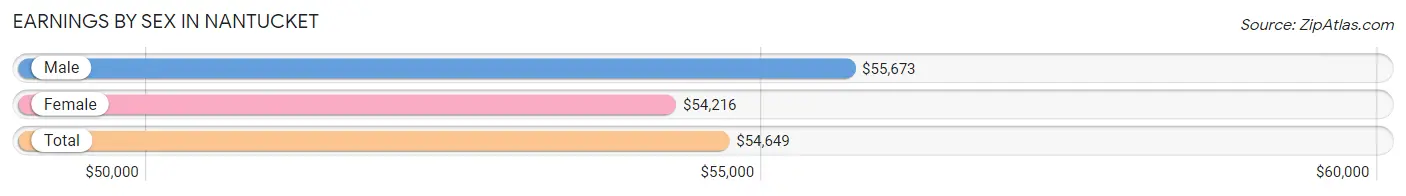
| Sex | Number | Average Earnings |
| Male | 3,436 (52.9%) | $55,673 |
| Female | 3,054 (47.1%) | $54,216 |
| Total | 6,490 (100.0%) | $54,649 |
Earnings by Sex by Income Bracket in Nantucket
The most common earnings brackets in Nantucket are $75,000 to $99,999 for men (659 | 19.2%) and $100,000+ for women (545 | 17.8%).
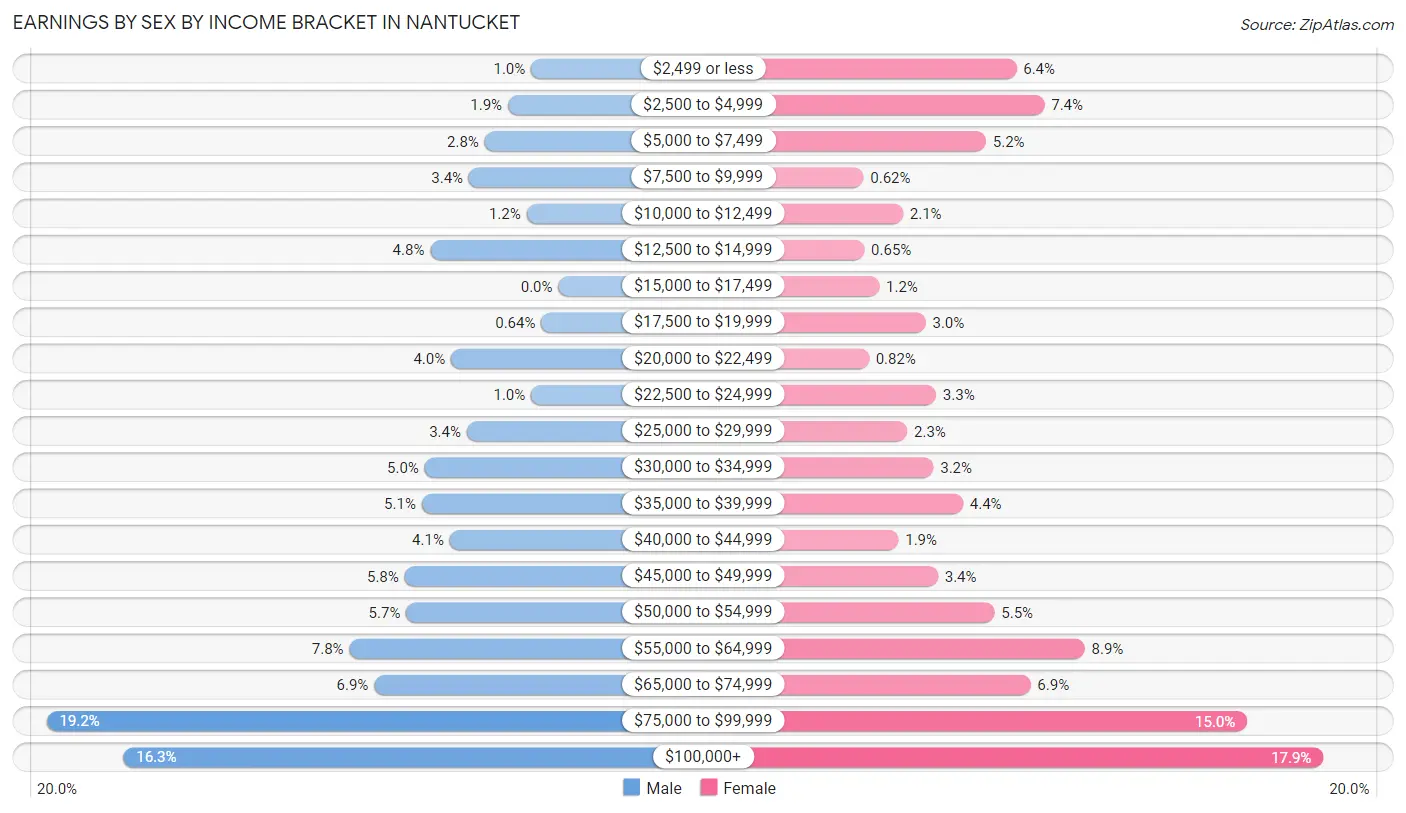
| Income | Male | Female |
| $2,499 or less | 35 (1.0%) | 194 (6.4%) |
| $2,500 to $4,999 | 65 (1.9%) | 226 (7.4%) |
| $5,000 to $7,499 | 95 (2.8%) | 159 (5.2%) |
| $7,500 to $9,999 | 115 (3.4%) | 19 (0.6%) |
| $10,000 to $12,499 | 41 (1.2%) | 64 (2.1%) |
| $12,500 to $14,999 | 165 (4.8%) | 20 (0.6%) |
| $15,000 to $17,499 | 0 (0.0%) | 37 (1.2%) |
| $17,500 to $19,999 | 22 (0.6%) | 90 (2.9%) |
| $20,000 to $22,499 | 138 (4.0%) | 25 (0.8%) |
| $22,500 to $24,999 | 35 (1.0%) | 102 (3.3%) |
| $25,000 to $29,999 | 118 (3.4%) | 69 (2.3%) |
| $30,000 to $34,999 | 172 (5.0%) | 99 (3.2%) |
| $35,000 to $39,999 | 176 (5.1%) | 133 (4.3%) |
| $40,000 to $44,999 | 140 (4.1%) | 59 (1.9%) |
| $45,000 to $49,999 | 198 (5.8%) | 104 (3.4%) |
| $50,000 to $54,999 | 196 (5.7%) | 169 (5.5%) |
| $55,000 to $64,999 | 269 (7.8%) | 272 (8.9%) |
| $65,000 to $74,999 | 237 (6.9%) | 210 (6.9%) |
| $75,000 to $99,999 | 659 (19.2%) | 458 (15.0%) |
| $100,000+ | 560 (16.3%) | 545 (17.8%) |
| Total | 3,436 (100.0%) | 3,054 (100.0%) |
Earnings by Sex by Educational Attainment in Nantucket
Average earnings in Nantucket are $62,328 for men and $57,905 for women, a difference of 7.1%. Men with an educational attainment of college or associate's degree enjoy the highest average annual earnings of $75,179, while those with high school diploma education earn the least with $52,110. Women with an educational attainment of graduate degree earn the most with the average annual earnings of $90,150, while those with high school diploma education have the smallest earnings of $34,022.
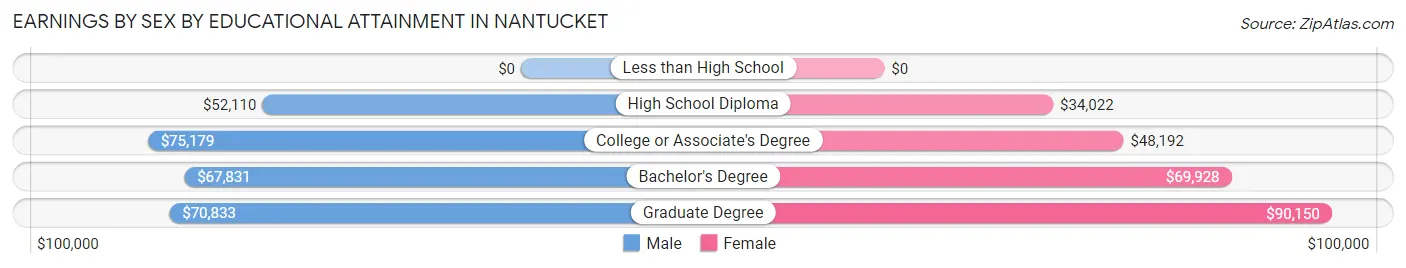
| Educational Attainment | Male Income | Female Income |
| Less than High School | - | - |
| High School Diploma | $52,110 | $34,022 |
| College or Associate's Degree | $75,179 | $48,192 |
| Bachelor's Degree | $67,831 | $69,928 |
| Graduate Degree | $70,833 | $90,150 |
| Total | $62,328 | $57,905 |
Family Income in Nantucket
Family Income Brackets in Nantucket
According to the Nantucket family income data, there are 695 families falling into the $200,000+ income range, which is the most common income bracket and makes up 32.3% of all families.
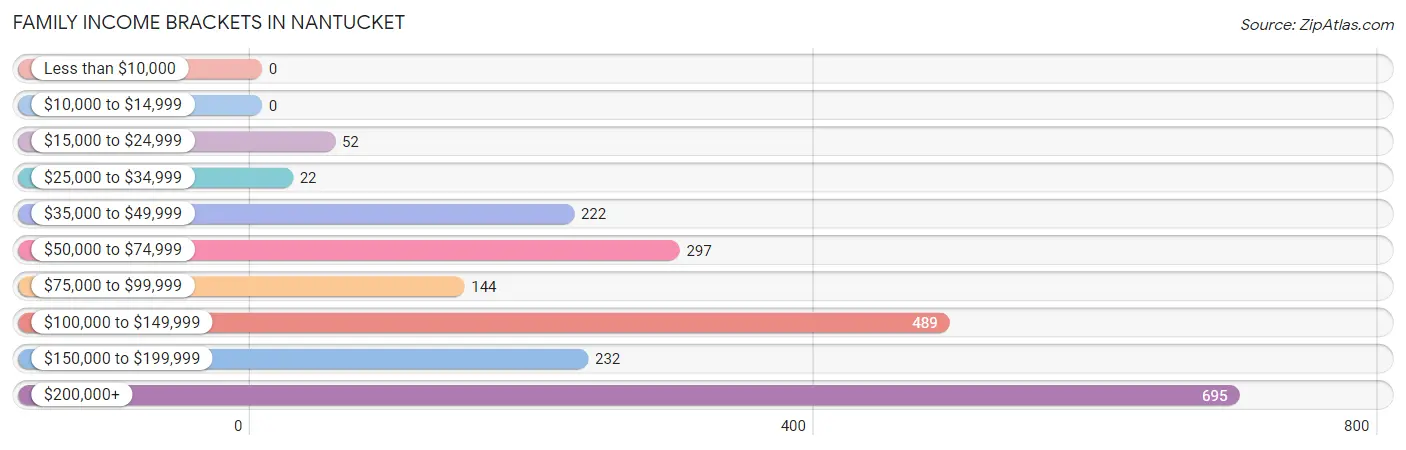
| Income Bracket | # Families | % Families |
| Less than $10,000 | 0 | 0.0% |
| $10,000 to $14,999 | 0 | 0.0% |
| $15,000 to $24,999 | 52 | 2.4% |
| $25,000 to $34,999 | 22 | 1.0% |
| $35,000 to $49,999 | 222 | 10.3% |
| $50,000 to $74,999 | 297 | 13.8% |
| $75,000 to $99,999 | 144 | 6.7% |
| $100,000 to $149,999 | 489 | 22.7% |
| $150,000 to $199,999 | 232 | 10.8% |
| $200,000+ | 695 | 32.3% |
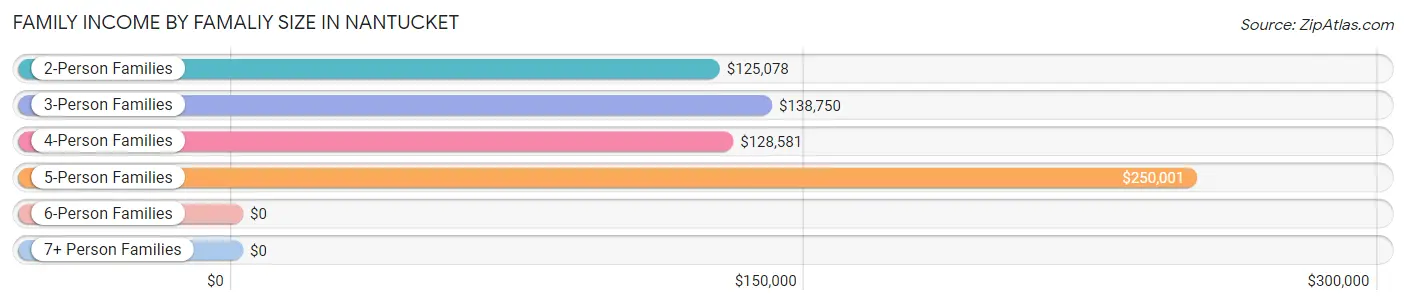
Family Income by Famaliy Size in Nantucket
5-person families (85 | 4.0%) account for the highest median family income in Nantucket with $250,001 per family, while 2-person families (1,073 | 49.9%) have the highest median income of $62,539 per family member.
| Income Bracket | # Families | Median Income |
| 2-Person Families | 1,073 (49.9%) | $125,078 |
| 3-Person Families | 177 (8.2%) | $138,750 |
| 4-Person Families | 782 (36.3%) | $128,581 |
| 5-Person Families | 85 (4.0%) | $250,001 |
| 6-Person Families | 9 (0.4%) | $0 |
| 7+ Person Families | 26 (1.2%) | $0 |
| Total | 2,152 (100.0%) | $134,138 |
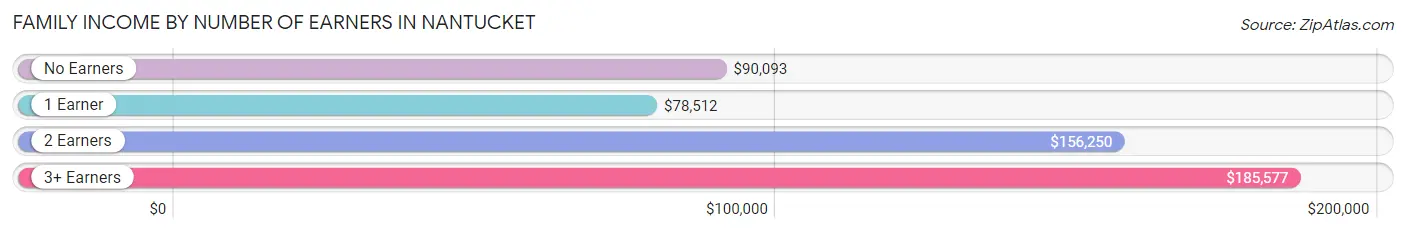
Family Income by Number of Earners in Nantucket
The median family income in Nantucket is $134,138, with families comprising 3+ earners (310) having the highest median family income of $185,577, while families with 1 earner (588) have the lowest median family income of $78,512, accounting for 14.4% and 27.3% of families, respectively.
| Number of Earners | # Families | Median Income |
| No Earners | 288 (13.4%) | $90,093 |
| 1 Earner | 588 (27.3%) | $78,512 |
| 2 Earners | 966 (44.9%) | $156,250 |
| 3+ Earners | 310 (14.4%) | $185,577 |
| Total | 2,152 (100.0%) | $134,138 |
Household Income in Nantucket
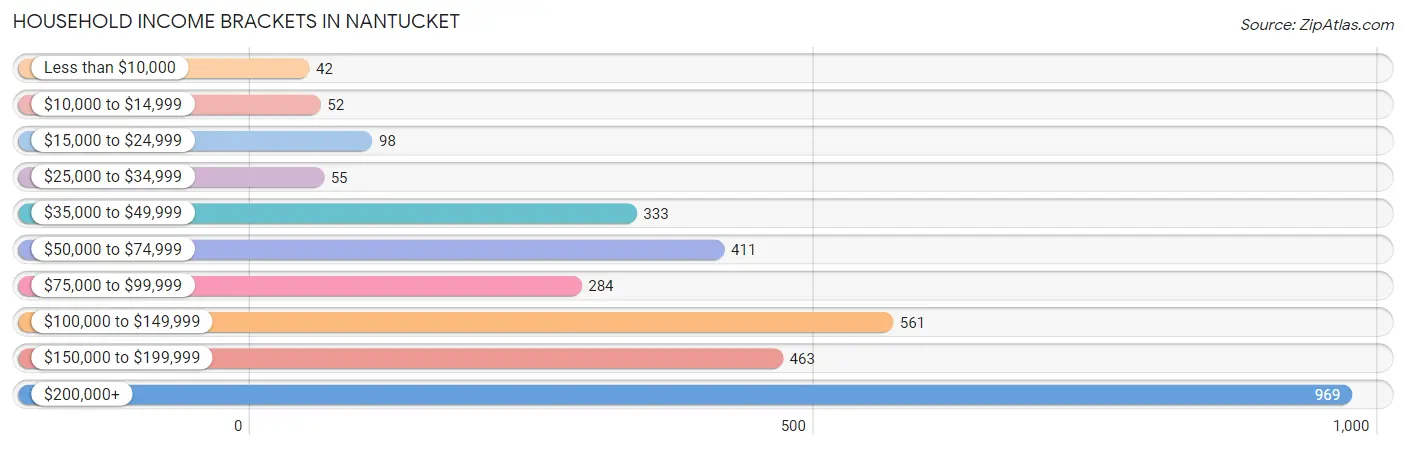
Household Income Brackets in Nantucket
With 969 households falling in the category, the $200,000+ income range is the most frequent in Nantucket, accounting for 29.7% of all households. In contrast, only 42 households (1.3%) fall into the less than $10,000 income bracket, making it the least populous group.
| Income Bracket | # Households | % Households |
| Less than $10,000 | 42 | 1.3% |
| $10,000 to $14,999 | 52 | 1.6% |
| $15,000 to $24,999 | 98 | 3.0% |
| $25,000 to $34,999 | 55 | 1.7% |
| $35,000 to $49,999 | 333 | 10.2% |
| $50,000 to $74,999 | 411 | 12.6% |
| $75,000 to $99,999 | 284 | 8.7% |
| $100,000 to $149,999 | 561 | 17.2% |
| $150,000 to $199,999 | 463 | 14.2% |
| $200,000+ | 969 | 29.7% |
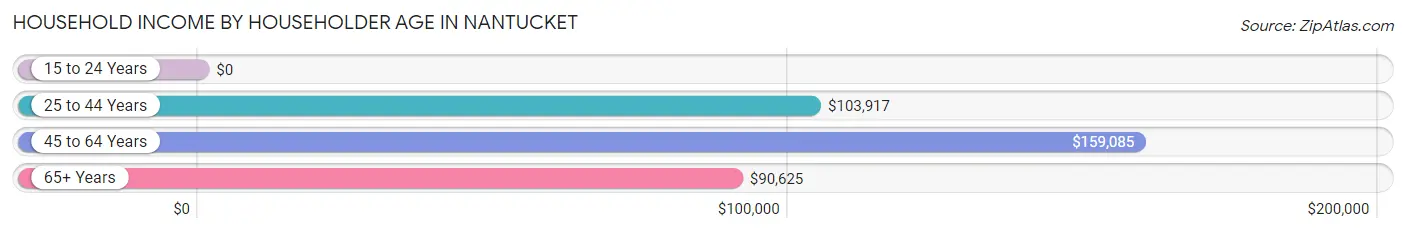
Household Income by Householder Age in Nantucket
The median household income in Nantucket is $131,736, with the highest median household income of $159,085 found in the 45 to 64 years age bracket for the primary householder. A total of 1,364 households (41.8%) fall into this category. Meanwhile, the 15 to 24 years age bracket for the primary householder has the lowest median household income of $0, with 23 households (0.7%) in this group.
| Income Bracket | # Households | Median Income |
| 15 to 24 Years | 23 (0.7%) | $0 |
| 25 to 44 Years | 885 (27.1%) | $103,917 |
| 45 to 64 Years | 1,364 (41.8%) | $159,085 |
| 65+ Years | 989 (30.3%) | $90,625 |
| Total | 3,261 (100.0%) | $131,736 |
Poverty in Nantucket
Income Below Poverty by Sex and Age in Nantucket
With 4.3% poverty level for males and 6.4% for females among the residents of Nantucket, 18 to 24 year old males and 18 to 24 year old females are the most vulnerable to poverty, with 73 males (18.5%) and 52 females (18.6%) in their respective age groups living below the poverty level.
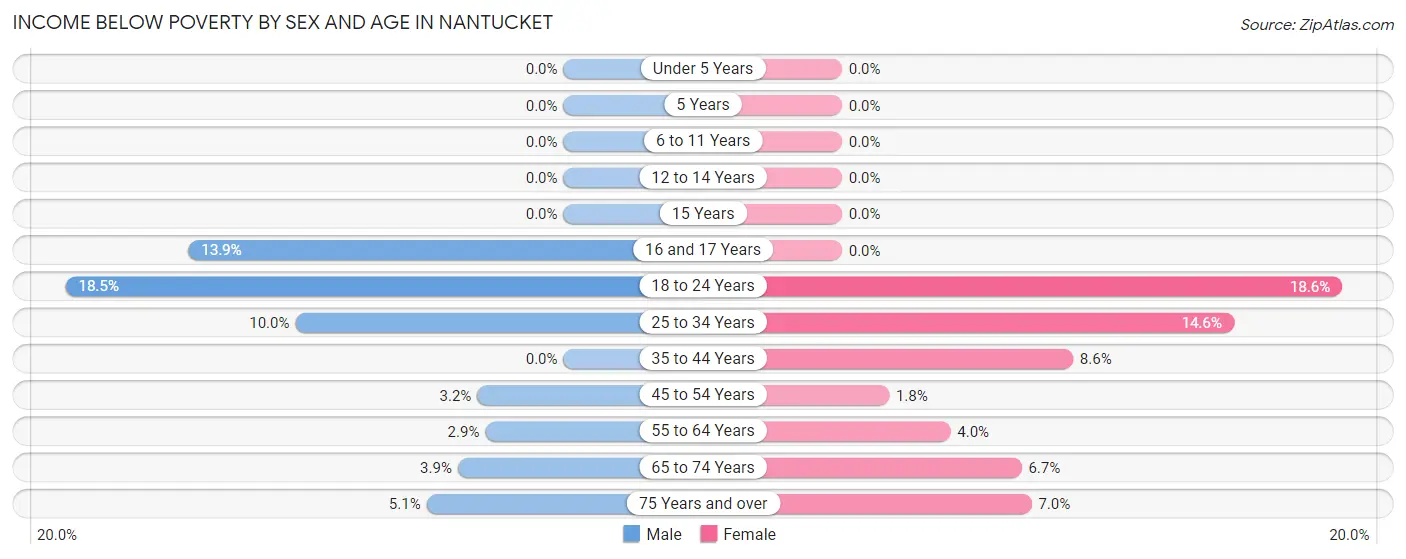
| Age Bracket | Male | Female |
| Under 5 Years | 0 (0.0%) | 0 (0.0%) |
| 5 Years | 0 (0.0%) | 0 (0.0%) |
| 6 to 11 Years | 0 (0.0%) | 0 (0.0%) |
| 12 to 14 Years | 0 (0.0%) | 0 (0.0%) |
| 15 Years | 0 (0.0%) | 0 (0.0%) |
| 16 and 17 Years | 11 (13.9%) | 0 (0.0%) |
| 18 to 24 Years | 73 (18.5%) | 52 (18.6%) |
| 25 to 34 Years | 75 (10.0%) | 87 (14.5%) |
| 35 to 44 Years | 0 (0.0%) | 74 (8.6%) |
| 45 to 54 Years | 35 (3.2%) | 12 (1.8%) |
| 55 to 64 Years | 14 (2.9%) | 25 (4.0%) |
| 65 to 74 Years | 22 (3.9%) | 36 (6.7%) |
| 75 Years and over | 12 (5.1%) | 19 (7.0%) |
| Total | 242 (4.3%) | 305 (6.4%) |
Income Above Poverty by Sex and Age in Nantucket
According to the poverty statistics in Nantucket, males aged under 5 years and females aged under 5 years are the age groups that are most secure financially, with 100.0% of males and 100.0% of females in these age groups living above the poverty line.
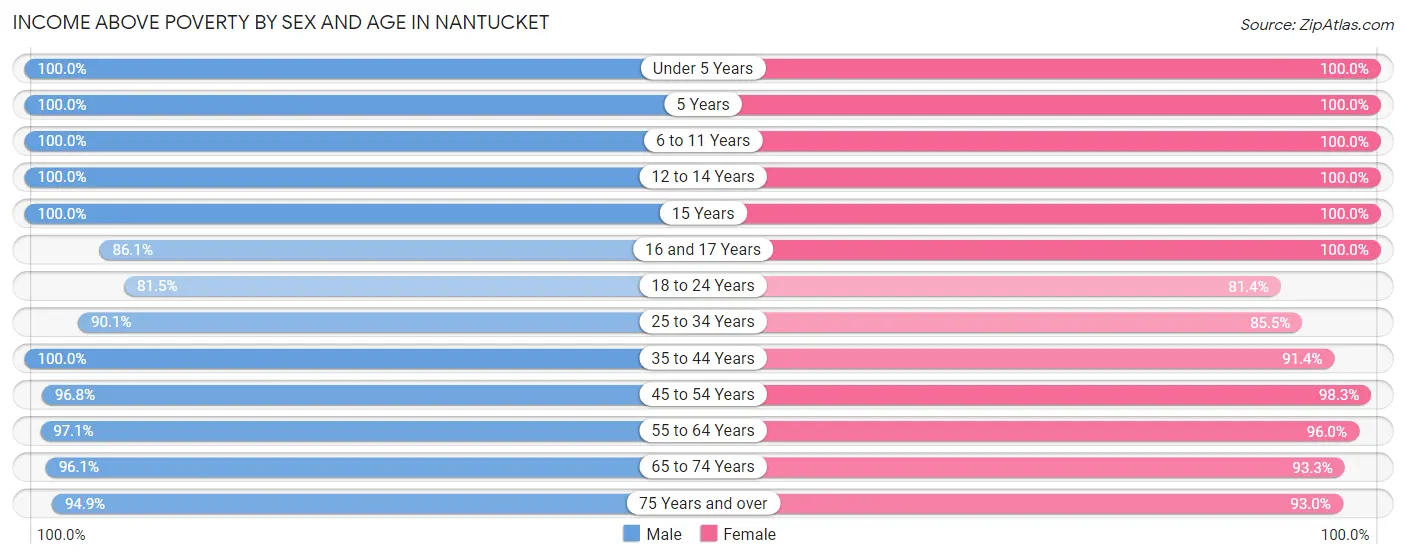
| Age Bracket | Male | Female |
| Under 5 Years | 144 (100.0%) | 273 (100.0%) |
| 5 Years | 23 (100.0%) | 43 (100.0%) |
| 6 to 11 Years | 405 (100.0%) | 220 (100.0%) |
| 12 to 14 Years | 504 (100.0%) | 189 (100.0%) |
| 15 Years | 202 (100.0%) | 32 (100.0%) |
| 16 and 17 Years | 68 (86.1%) | 175 (100.0%) |
| 18 to 24 Years | 322 (81.5%) | 228 (81.4%) |
| 25 to 34 Years | 679 (90.0%) | 511 (85.5%) |
| 35 to 44 Years | 684 (100.0%) | 788 (91.4%) |
| 45 to 54 Years | 1,059 (96.8%) | 675 (98.3%) |
| 55 to 64 Years | 469 (97.1%) | 595 (96.0%) |
| 65 to 74 Years | 539 (96.1%) | 504 (93.3%) |
| 75 Years and over | 224 (94.9%) | 251 (93.0%) |
| Total | 5,322 (95.7%) | 4,484 (93.6%) |
Income Below Poverty Among Married-Couple Families in Nantucket
| Children | Above Poverty | Below Poverty |
| No Children | 954 (100.0%) | 0 (0.0%) |
| 1 or 2 Children | 701 (100.0%) | 0 (0.0%) |
| 3 or 4 Children | 72 (100.0%) | 0 (0.0%) |
| 5 or more Children | 9 (100.0%) | 0 (0.0%) |
| Total | 1,736 (100.0%) | 0 (0.0%) |
Income Below Poverty Among Single-Parent Households in Nantucket
| Children | Single Father | Single Mother |
| No Children | 0 (0.0%) | 0 (0.0%) |
| 1 or 2 Children | 0 (0.0%) | 0 (0.0%) |
| 3 or 4 Children | 0 (0.0%) | 0 (0.0%) |
| 5 or more Children | 0 (0.0%) | 0 (0.0%) |
| Total | 0 (0.0%) | 0 (0.0%) |
Income Below Poverty Among Married-Couple vs Single-Parent Households in Nantucket
| Children | Married-Couple Families | Single-Parent Households |
| No Children | 0 (0.0%) | 0 (0.0%) |
| 1 or 2 Children | 0 (0.0%) | 0 (0.0%) |
| 3 or 4 Children | 0 (0.0%) | 0 (0.0%) |
| 5 or more Children | 0 (0.0%) | 0 (0.0%) |
| Total | 0 (0.0%) | 0 (0.0%) |
Employment Characteristics in Nantucket
Employment by Class of Employer in Nantucket
Among the 5,571 employed individuals in Nantucket, private company employees (2,903 | 52.1%), self-employed (not incorporated) (1,026 | 18.4%), and local government employees (631 | 11.3%) make up the most common classes of employment.
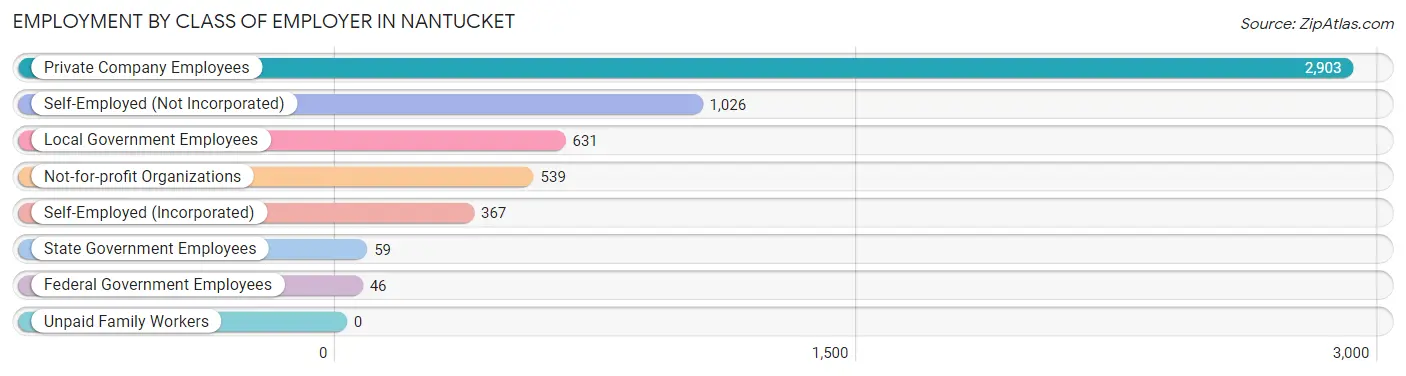
| Employer Class | # Employees | % Employees |
| Private Company Employees | 2,903 | 52.1% |
| Self-Employed (Incorporated) | 367 | 6.6% |
| Self-Employed (Not Incorporated) | 1,026 | 18.4% |
| Not-for-profit Organizations | 539 | 9.7% |
| Local Government Employees | 631 | 11.3% |
| State Government Employees | 59 | 1.1% |
| Federal Government Employees | 46 | 0.8% |
| Unpaid Family Workers | 0 | 0.0% |
| Total | 5,571 | 100.0% |
Employment Status by Age in Nantucket
According to the labor force statistics for Nantucket, out of the total population over 16 years of age (8,409), 71.5% or 6,012 individuals are in the labor force, with 6.3% or 379 of them unemployed. The age group with the highest labor force participation rate is 45 to 54 years, with 95.5% or 1,701 individuals in the labor force. Within the labor force, the 20 to 24 years age range has the highest percentage of unemployed individuals, with 34.9% or 145 of them being unemployed.
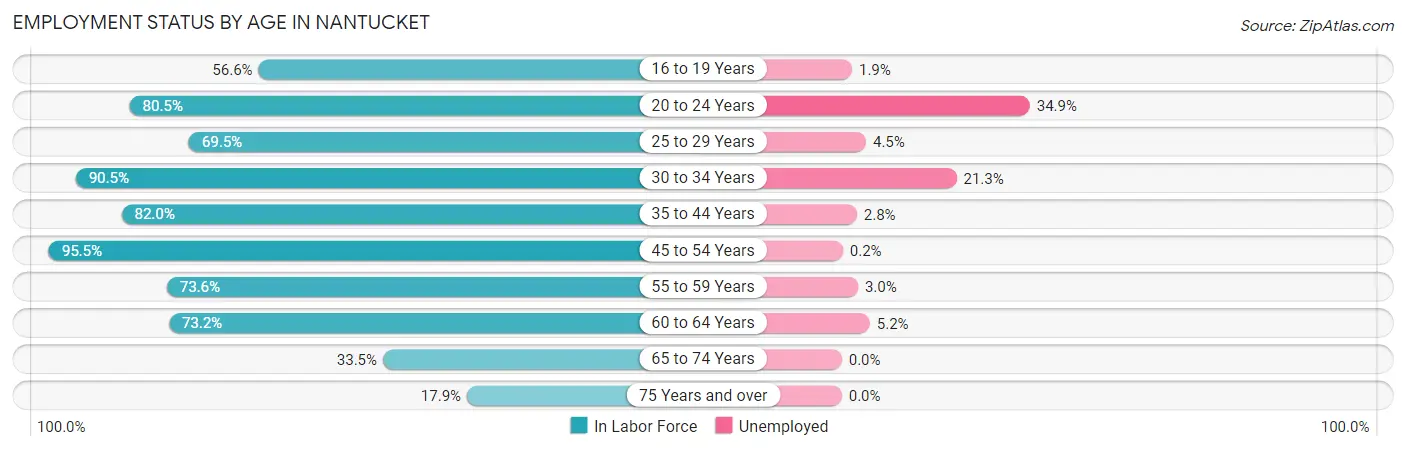
| Age Bracket | In Labor Force | Unemployed |
| 16 to 19 Years | 263 (56.6%) | 5 (1.9%) |
| 20 to 24 Years | 416 (80.5%) | 145 (34.9%) |
| 25 to 29 Years | 467 (69.5%) | 21 (4.5%) |
| 30 to 34 Years | 620 (90.5%) | 132 (21.3%) |
| 35 to 44 Years | 1,268 (82.0%) | 36 (2.8%) |
| 45 to 54 Years | 1,701 (95.5%) | 3 (0.2%) |
| 55 to 59 Years | 433 (73.6%) | 13 (3.0%) |
| 60 to 64 Years | 382 (73.2%) | 20 (5.2%) |
| 65 to 74 Years | 369 (33.5%) | 0 (0.0%) |
| 75 Years and over | 95 (17.9%) | 0 (0.0%) |
| Total | 6,012 (71.5%) | 379 (6.3%) |
Employment Status by Educational Attainment in Nantucket
According to labor force statistics for Nantucket, 84.1% of individuals (4,873) out of the total population between 25 and 64 years of age (5,794) are in the labor force, with 4.6% or 224 of them being unemployed. The group with the highest labor force participation rate are those with the educational attainment of college / associate degree, with 96.5% or 1,274 individuals in the labor force. Within the labor force, individuals with bachelor's degree or higher education have the highest percentage of unemployment, with 5.7% or 156 of them being unemployed.
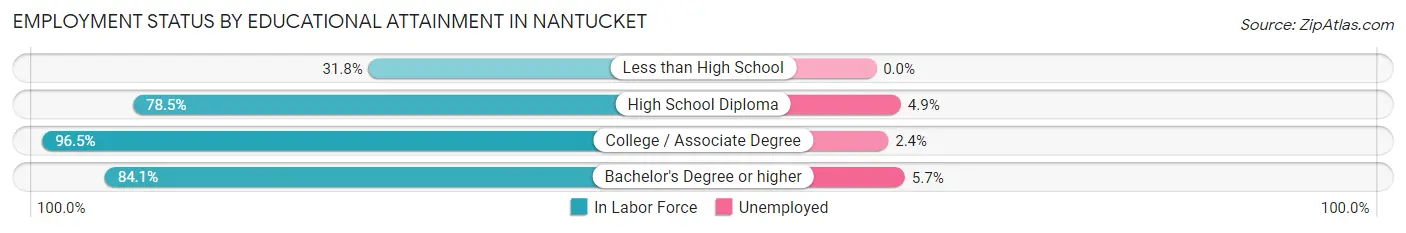
| Educational Attainment | In Labor Force | Unemployed |
| Less than High School | 67 (31.8%) | 0 (0.0%) |
| High School Diploma | 798 (78.5%) | 50 (4.9%) |
| College / Associate Degree | 1,274 (96.5%) | 32 (2.4%) |
| Bachelor's Degree or higher | 2,731 (84.1%) | 185 (5.7%) |
| Total | 4,873 (84.1%) | 267 (4.6%) |
Employment Occupations by Sex in Nantucket
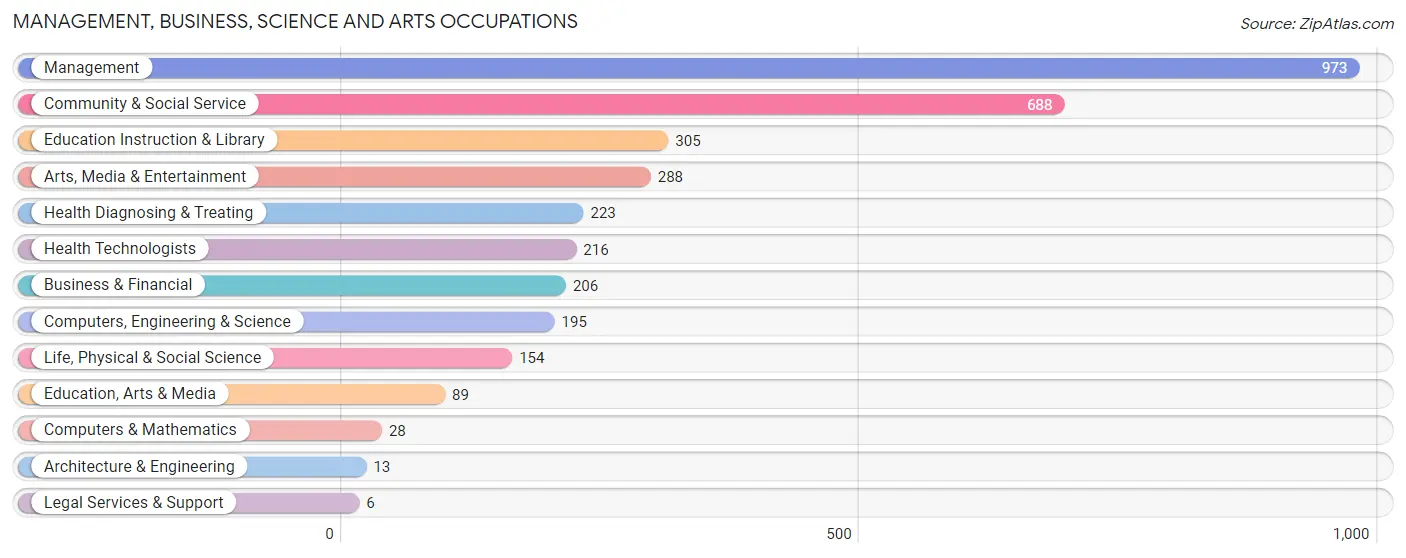
Management, Business, Science and Arts Occupations
The most common Management, Business, Science and Arts occupations in Nantucket are Management (973 | 17.3%), Community & Social Service (688 | 12.2%), Education Instruction & Library (305 | 5.4%), Arts, Media & Entertainment (288 | 5.1%), and Health Diagnosing & Treating (223 | 4.0%).
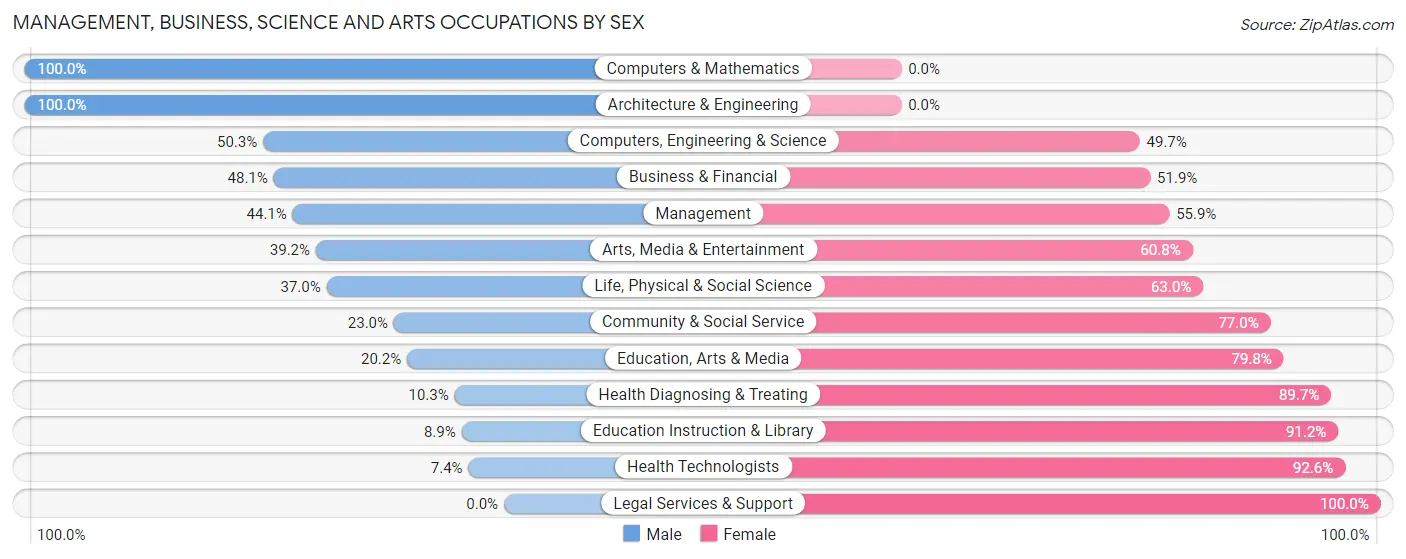
Management, Business, Science and Arts Occupations by Sex
Within the Management, Business, Science and Arts occupations in Nantucket, the most male-oriented occupations are Computers & Mathematics (100.0%), Architecture & Engineering (100.0%), and Computers, Engineering & Science (50.3%), while the most female-oriented occupations are Legal Services & Support (100.0%), Health Technologists (92.6%), and Education Instruction & Library (91.1%).
| Occupation | Male | Female |
| Management | 429 (44.1%) | 544 (55.9%) |
| Business & Financial | 99 (48.1%) | 107 (51.9%) |
| Computers, Engineering & Science | 98 (50.3%) | 97 (49.7%) |
| Computers & Mathematics | 28 (100.0%) | 0 (0.0%) |
| Architecture & Engineering | 13 (100.0%) | 0 (0.0%) |
| Life, Physical & Social Science | 57 (37.0%) | 97 (63.0%) |
| Community & Social Service | 158 (23.0%) | 530 (77.0%) |
| Education, Arts & Media | 18 (20.2%) | 71 (79.8%) |
| Legal Services & Support | 0 (0.0%) | 6 (100.0%) |
| Education Instruction & Library | 27 (8.8%) | 278 (91.1%) |
| Arts, Media & Entertainment | 113 (39.2%) | 175 (60.8%) |
| Health Diagnosing & Treating | 23 (10.3%) | 200 (89.7%) |
| Health Technologists | 16 (7.4%) | 200 (92.6%) |
| Total (Category) | 807 (35.3%) | 1,478 (64.7%) |
| Total (Overall) | 2,921 (51.8%) | 2,714 (48.2%) |
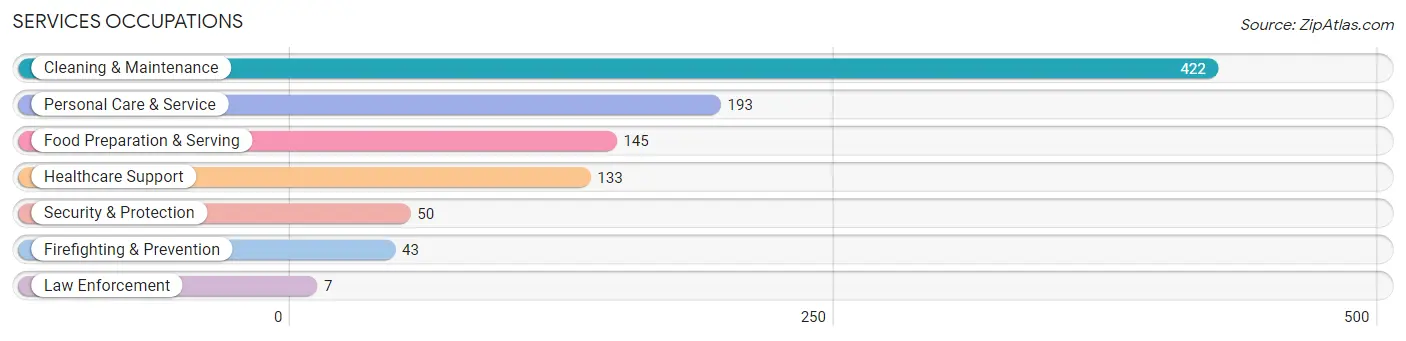
Services Occupations
The most common Services occupations in Nantucket are Cleaning & Maintenance (422 | 7.5%), Personal Care & Service (193 | 3.4%), Food Preparation & Serving (145 | 2.6%), Healthcare Support (133 | 2.4%), and Security & Protection (50 | 0.9%).
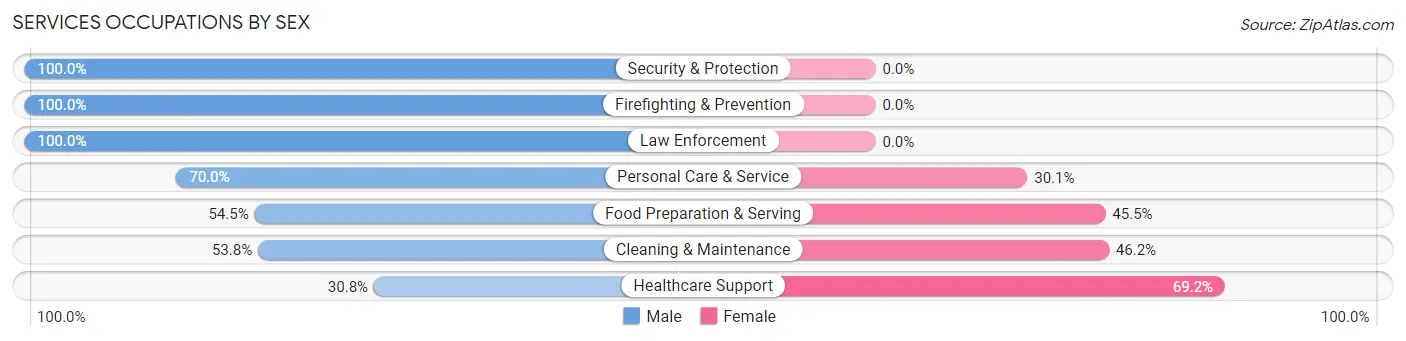
Services Occupations by Sex
Within the Services occupations in Nantucket, the most male-oriented occupations are Security & Protection (100.0%), Firefighting & Prevention (100.0%), and Law Enforcement (100.0%), while the most female-oriented occupations are Healthcare Support (69.2%), Cleaning & Maintenance (46.2%), and Food Preparation & Serving (45.5%).
| Occupation | Male | Female |
| Healthcare Support | 41 (30.8%) | 92 (69.2%) |
| Security & Protection | 50 (100.0%) | 0 (0.0%) |
| Firefighting & Prevention | 43 (100.0%) | 0 (0.0%) |
| Law Enforcement | 7 (100.0%) | 0 (0.0%) |
| Food Preparation & Serving | 79 (54.5%) | 66 (45.5%) |
| Cleaning & Maintenance | 227 (53.8%) | 195 (46.2%) |
| Personal Care & Service | 135 (70.0%) | 58 (30.0%) |
| Total (Category) | 532 (56.4%) | 411 (43.6%) |
| Total (Overall) | 2,921 (51.8%) | 2,714 (48.2%) |
Sales and Office Occupations
The most common Sales and Office occupations in Nantucket are Sales & Related (511 | 9.1%), and Office & Administration (364 | 6.5%).

Sales and Office Occupations by Sex

| Occupation | Male | Female |
| Sales & Related | 93 (18.2%) | 418 (81.8%) |
| Office & Administration | 56 (15.4%) | 308 (84.6%) |
| Total (Category) | 149 (17.0%) | 726 (83.0%) |
| Total (Overall) | 2,921 (51.8%) | 2,714 (48.2%) |
Natural Resources, Construction and Maintenance Occupations
The most common Natural Resources, Construction and Maintenance occupations in Nantucket are Construction & Extraction (891 | 15.8%), and Installation, Maintenance & Repair (146 | 2.6%).
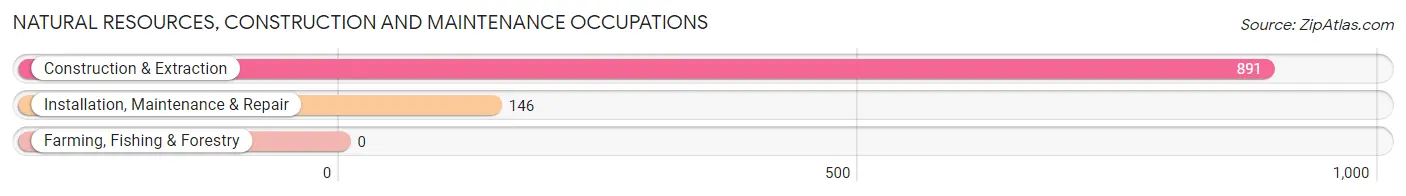
Natural Resources, Construction and Maintenance Occupations by Sex

| Occupation | Male | Female |
| Farming, Fishing & Forestry | 0 (0.0%) | 0 (0.0%) |
| Construction & Extraction | 891 (100.0%) | 0 (0.0%) |
| Installation, Maintenance & Repair | 146 (100.0%) | 0 (0.0%) |
| Total (Category) | 1,037 (100.0%) | 0 (0.0%) |
| Total (Overall) | 2,921 (51.8%) | 2,714 (48.2%) |
Production, Transportation and Moving Occupations
The most common Production, Transportation and Moving occupations in Nantucket are Production (205 | 3.6%), Transportation (195 | 3.5%), and Material Moving (95 | 1.7%).
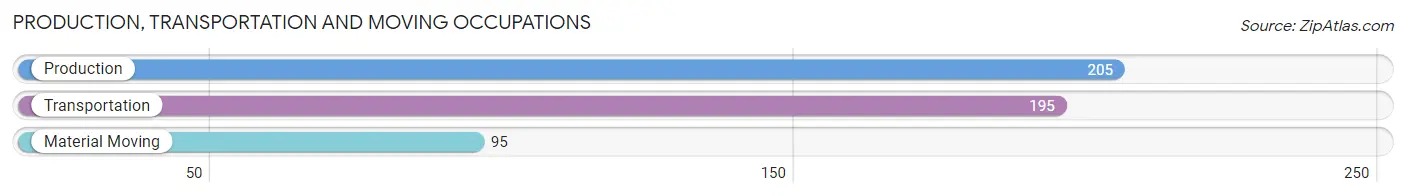
Production, Transportation and Moving Occupations by Sex
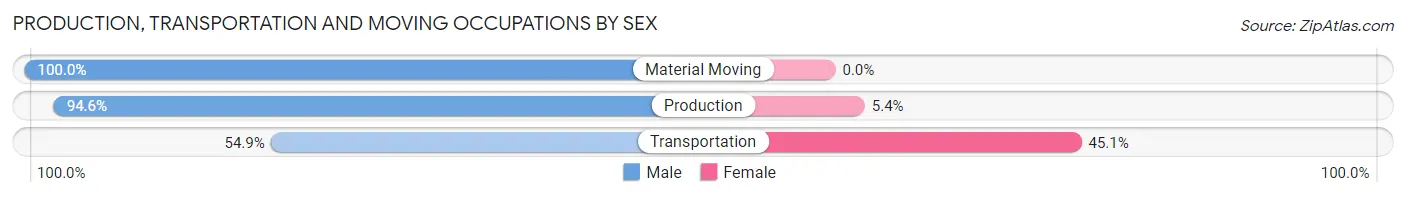
| Occupation | Male | Female |
| Production | 194 (94.6%) | 11 (5.4%) |
| Transportation | 107 (54.9%) | 88 (45.1%) |
| Material Moving | 95 (100.0%) | 0 (0.0%) |
| Total (Category) | 396 (80.0%) | 99 (20.0%) |
| Total (Overall) | 2,921 (51.8%) | 2,714 (48.2%) |
Employment Industries by Sex in Nantucket
Employment Industries in Nantucket
The major employment industries in Nantucket include Construction (1,114 | 19.8%), Health Care & Social Assistance (692 | 12.3%), Professional & Scientific (565 | 10.0%), Administrative & Support (491 | 8.7%), and Educational Services (490 | 8.7%).
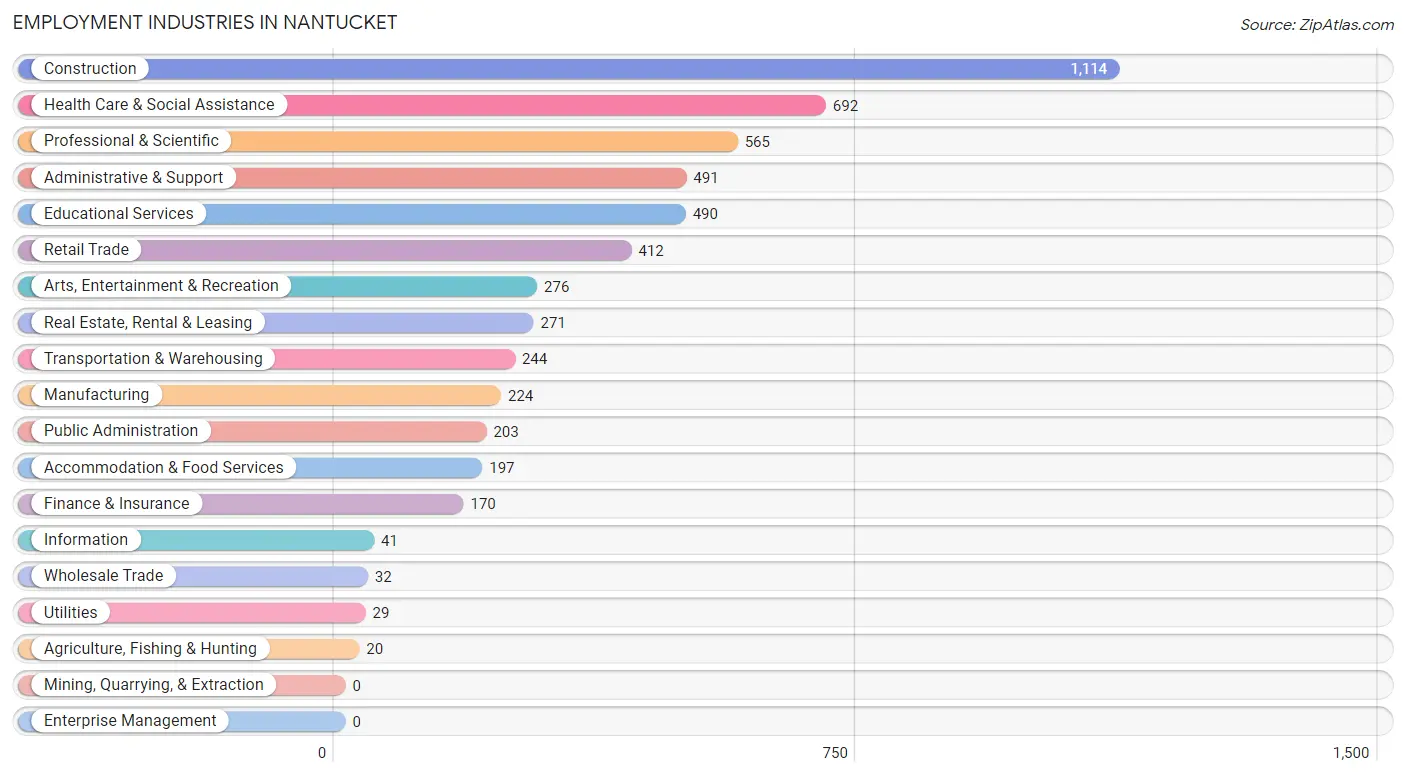
Employment Industries by Sex in Nantucket
The Nantucket industries that see more men than women are Utilities (100.0%), Manufacturing (93.8%), and Construction (91.3%), whereas the industries that tend to have a higher number of women are Accommodation & Food Services (88.8%), Educational Services (83.9%), and Real Estate, Rental & Leasing (75.3%).
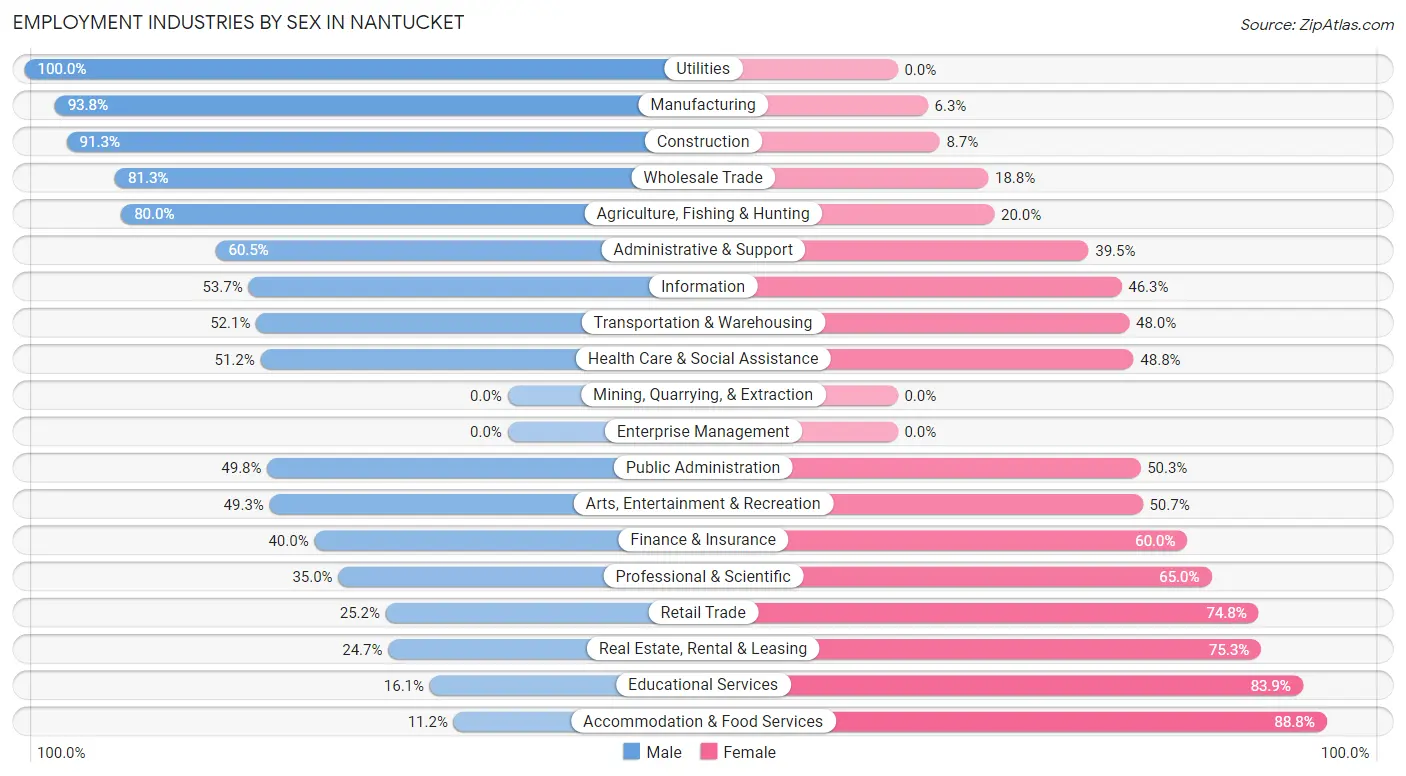
| Industry | Male | Female |
| Agriculture, Fishing & Hunting | 16 (80.0%) | 4 (20.0%) |
| Mining, Quarrying, & Extraction | 0 (0.0%) | 0 (0.0%) |
| Construction | 1,017 (91.3%) | 97 (8.7%) |
| Manufacturing | 210 (93.8%) | 14 (6.2%) |
| Wholesale Trade | 26 (81.2%) | 6 (18.8%) |
| Retail Trade | 104 (25.2%) | 308 (74.8%) |
| Transportation & Warehousing | 127 (52.0%) | 117 (47.9%) |
| Utilities | 29 (100.0%) | 0 (0.0%) |
| Information | 22 (53.7%) | 19 (46.3%) |
| Finance & Insurance | 68 (40.0%) | 102 (60.0%) |
| Real Estate, Rental & Leasing | 67 (24.7%) | 204 (75.3%) |
| Professional & Scientific | 198 (35.0%) | 367 (65.0%) |
| Enterprise Management | 0 (0.0%) | 0 (0.0%) |
| Administrative & Support | 297 (60.5%) | 194 (39.5%) |
| Educational Services | 79 (16.1%) | 411 (83.9%) |
| Health Care & Social Assistance | 354 (51.2%) | 338 (48.8%) |
| Arts, Entertainment & Recreation | 136 (49.3%) | 140 (50.7%) |
| Accommodation & Food Services | 22 (11.2%) | 175 (88.8%) |
| Public Administration | 101 (49.7%) | 102 (50.2%) |
| Total | 2,921 (51.8%) | 2,714 (48.2%) |
Education in Nantucket
School Enrollment in Nantucket
The most common levels of schooling among the 2,558 students in Nantucket are middle school (683 | 26.7%), high school (661 | 25.8%), and college / undergraduate (411 | 16.1%).
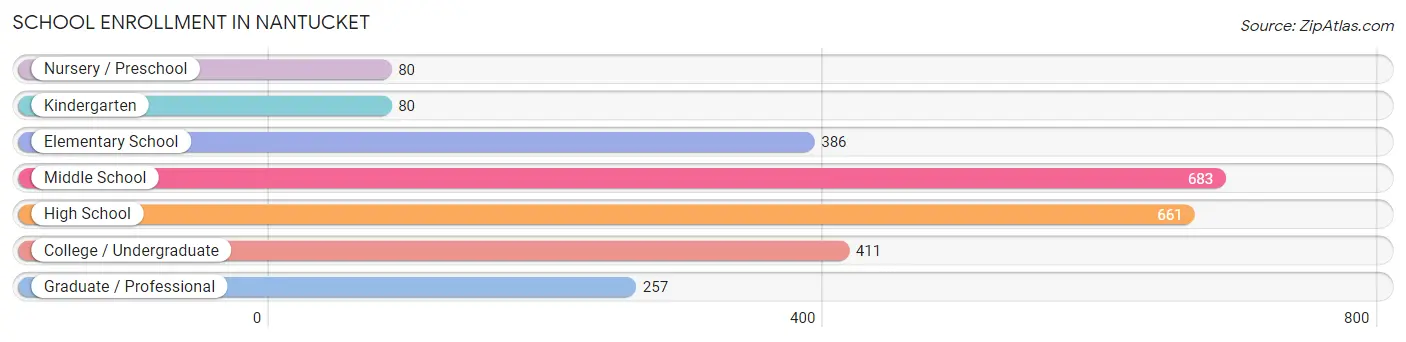
| School Level | # Students | % Students |
| Nursery / Preschool | 80 | 3.1% |
| Kindergarten | 80 | 3.1% |
| Elementary School | 386 | 15.1% |
| Middle School | 683 | 26.7% |
| High School | 661 | 25.8% |
| College / Undergraduate | 411 | 16.1% |
| Graduate / Professional | 257 | 10.1% |
| Total | 2,558 | 100.0% |
School Enrollment by Age by Funding Source in Nantucket
Out of a total of 2,558 students who are enrolled in schools in Nantucket, 512 (20.0%) attend a private institution, while the remaining 2,046 (80.0%) are enrolled in public schools. The age group of 25 to 34 year olds has the highest likelihood of being enrolled in private schools, with 77 (70.6% in the age bracket) enrolled. Conversely, the age group of 15 to 17 year olds has the lowest likelihood of being enrolled in a private school, with 481 (98.6% in the age bracket) attending a public institution.
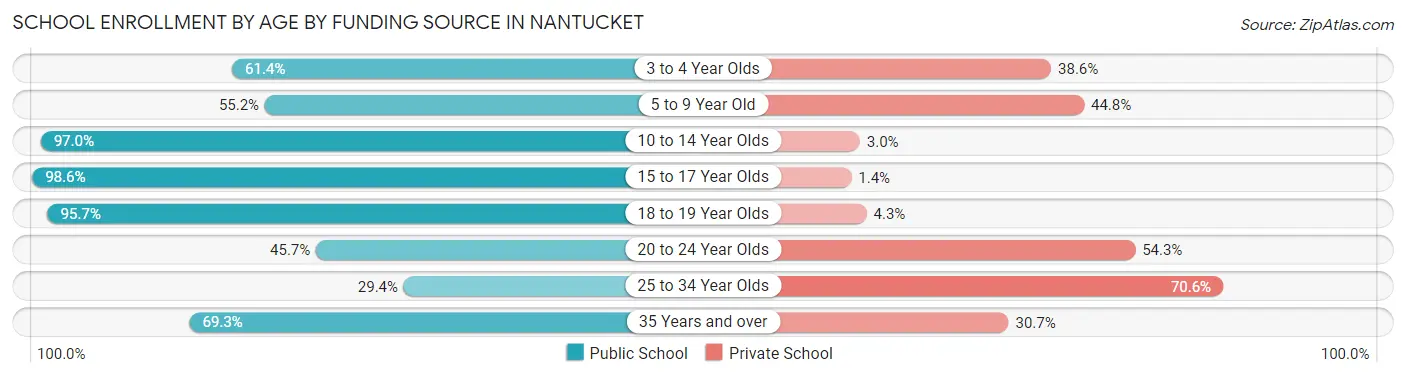
| Age Bracket | Public School | Private School |
| 3 to 4 Year Olds | 27 (61.4%) | 17 (38.6%) |
| 5 to 9 Year Old | 248 (55.2%) | 201 (44.8%) |
| 10 to 14 Year Olds | 805 (97.0%) | 25 (3.0%) |
| 15 to 17 Year Olds | 481 (98.6%) | 7 (1.4%) |
| 18 to 19 Year Olds | 202 (95.7%) | 9 (4.3%) |
| 20 to 24 Year Olds | 85 (45.7%) | 101 (54.3%) |
| 25 to 34 Year Olds | 32 (29.4%) | 77 (70.6%) |
| 35 Years and over | 167 (69.3%) | 74 (30.7%) |
| Total | 2,046 (80.0%) | 512 (20.0%) |
Educational Attainment by Field of Study in Nantucket
Business (788 | 17.1%), social sciences (667 | 14.4%), visual & performing arts (468 | 10.1%), literature & languages (368 | 8.0%), and psychology (313 | 6.8%) are the most common fields of study among 4,615 individuals in Nantucket who have obtained a bachelor's degree or higher.
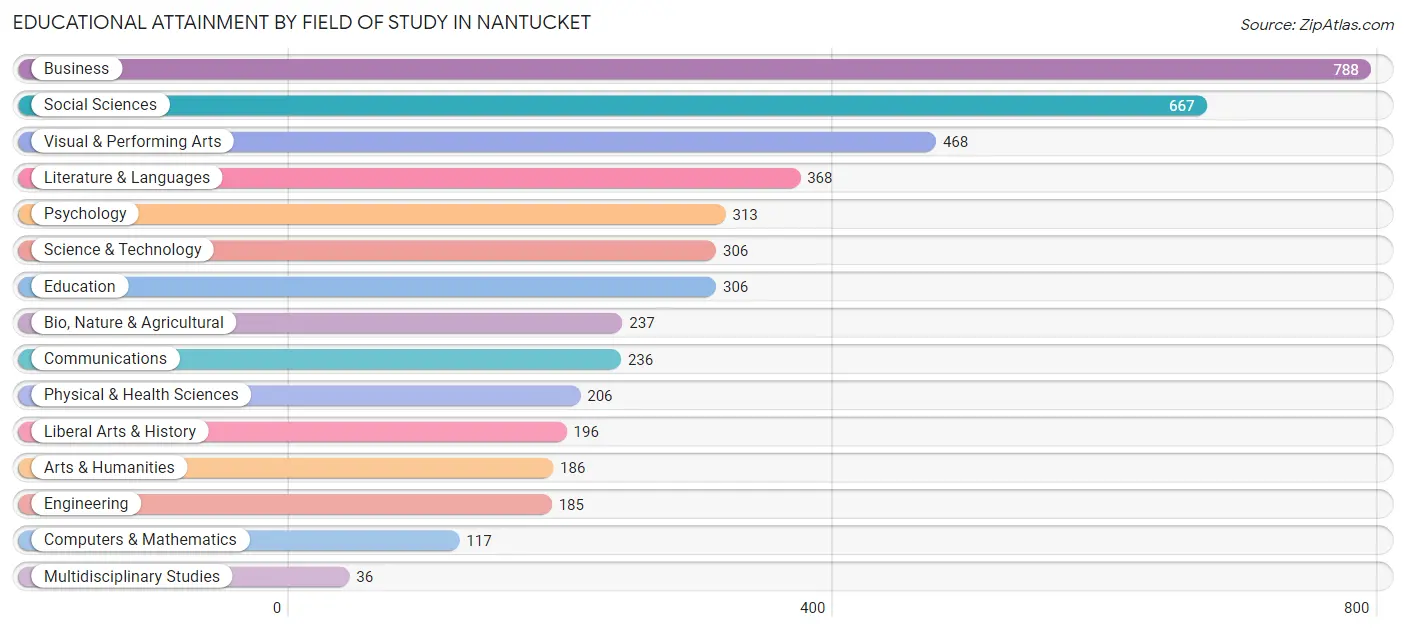
| Field of Study | # Graduates | % Graduates |
| Computers & Mathematics | 117 | 2.5% |
| Bio, Nature & Agricultural | 237 | 5.1% |
| Physical & Health Sciences | 206 | 4.5% |
| Psychology | 313 | 6.8% |
| Social Sciences | 667 | 14.4% |
| Engineering | 185 | 4.0% |
| Multidisciplinary Studies | 36 | 0.8% |
| Science & Technology | 306 | 6.6% |
| Business | 788 | 17.1% |
| Education | 306 | 6.6% |
| Literature & Languages | 368 | 8.0% |
| Liberal Arts & History | 196 | 4.3% |
| Visual & Performing Arts | 468 | 10.1% |
| Communications | 236 | 5.1% |
| Arts & Humanities | 186 | 4.0% |
| Total | 4,615 | 100.0% |
Transportation & Commute in Nantucket
Vehicle Availability by Sex in Nantucket
The most prevalent vehicle ownership categories in Nantucket are males with 2 vehicles (1,058, accounting for 37.1%) and females with 2 vehicles (1,196, making up 40.4%).
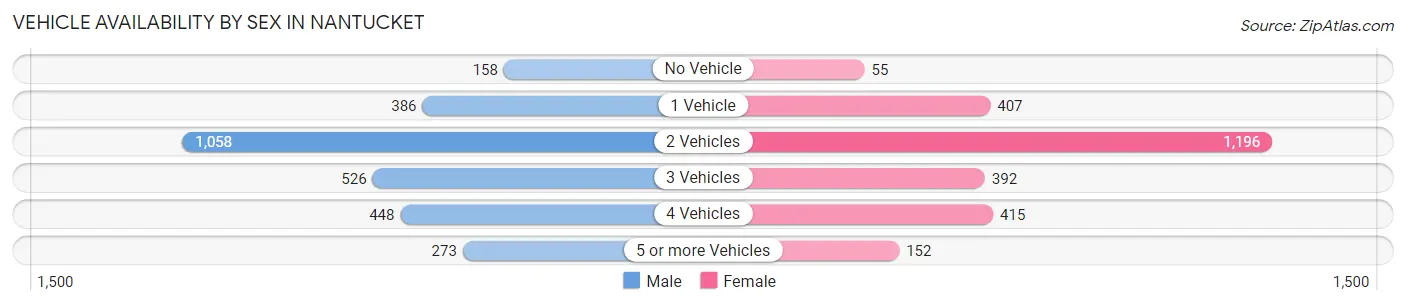
| Vehicles Available | Male | Female |
| No Vehicle | 158 (5.6%) | 55 (2.1%) |
| 1 Vehicle | 386 (13.6%) | 407 (15.5%) |
| 2 Vehicles | 1,058 (37.1%) | 1,196 (45.7%) |
| 3 Vehicles | 526 (18.5%) | 392 (15.0%) |
| 4 Vehicles | 448 (15.7%) | 415 (15.9%) |
| 5 or more Vehicles | 273 (9.6%) | 152 (5.8%) |
| Total | 2,849 (100.0%) | 2,617 (100.0%) |
Commute Time in Nantucket
The most frequently occuring commute durations in Nantucket are 5 to 9 minutes (1,331 commuters, 26.3%), 10 to 14 minutes (1,300 commuters, 25.7%), and 15 to 19 minutes (1,002 commuters, 19.8%).
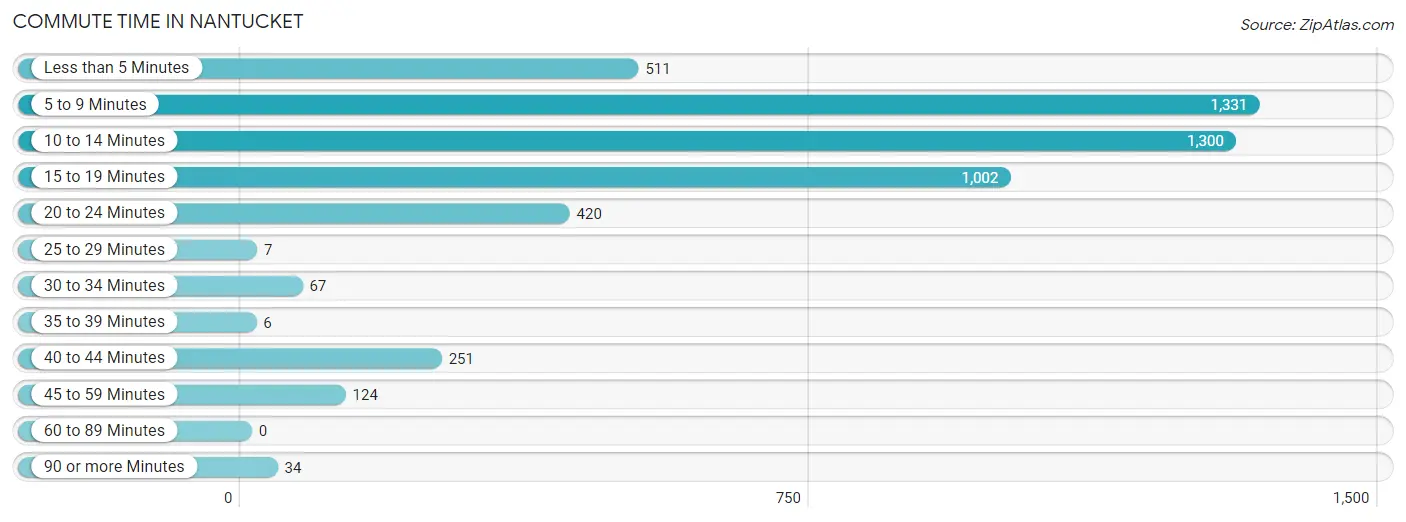
| Commute Time | # Commuters | % Commuters |
| Less than 5 Minutes | 511 | 10.1% |
| 5 to 9 Minutes | 1,331 | 26.3% |
| 10 to 14 Minutes | 1,300 | 25.7% |
| 15 to 19 Minutes | 1,002 | 19.8% |
| 20 to 24 Minutes | 420 | 8.3% |
| 25 to 29 Minutes | 7 | 0.1% |
| 30 to 34 Minutes | 67 | 1.3% |
| 35 to 39 Minutes | 6 | 0.1% |
| 40 to 44 Minutes | 251 | 5.0% |
| 45 to 59 Minutes | 124 | 2.5% |
| 60 to 89 Minutes | 0 | 0.0% |
| 90 or more Minutes | 34 | 0.7% |
Commute Time by Sex in Nantucket
The most common commute times in Nantucket are 5 to 9 minutes (697 commuters, 26.7%) for males and 5 to 9 minutes (634 commuters, 25.9%) for females.
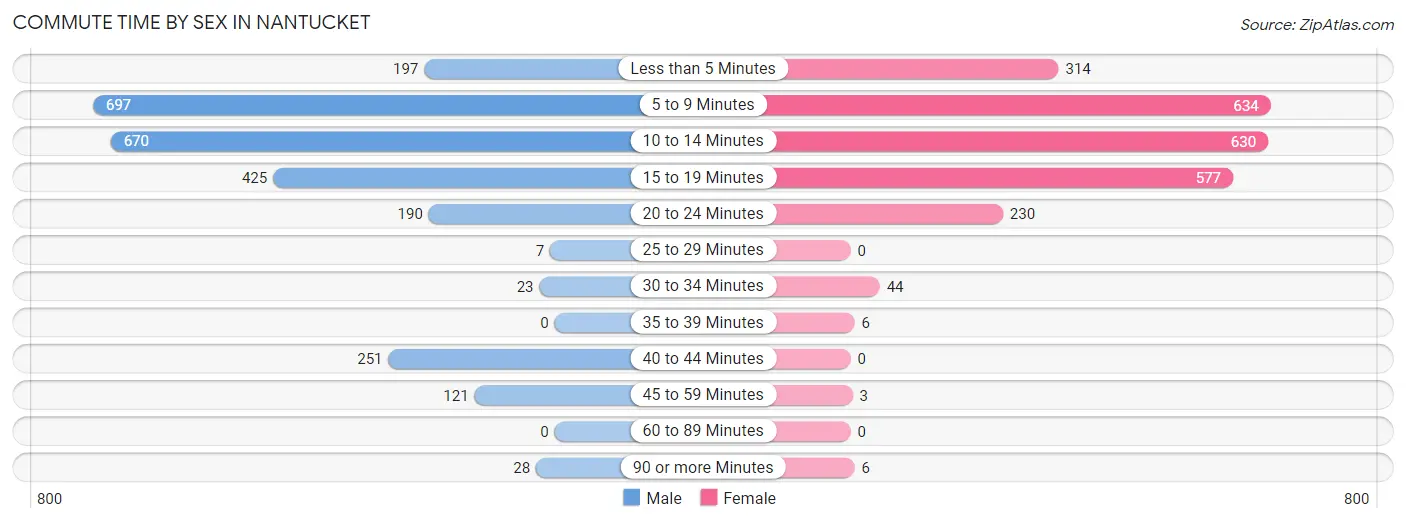
| Commute Time | Male | Female |
| Less than 5 Minutes | 197 (7.5%) | 314 (12.9%) |
| 5 to 9 Minutes | 697 (26.7%) | 634 (25.9%) |
| 10 to 14 Minutes | 670 (25.7%) | 630 (25.8%) |
| 15 to 19 Minutes | 425 (16.3%) | 577 (23.6%) |
| 20 to 24 Minutes | 190 (7.3%) | 230 (9.4%) |
| 25 to 29 Minutes | 7 (0.3%) | 0 (0.0%) |
| 30 to 34 Minutes | 23 (0.9%) | 44 (1.8%) |
| 35 to 39 Minutes | 0 (0.0%) | 6 (0.3%) |
| 40 to 44 Minutes | 251 (9.6%) | 0 (0.0%) |
| 45 to 59 Minutes | 121 (4.6%) | 3 (0.1%) |
| 60 to 89 Minutes | 0 (0.0%) | 0 (0.0%) |
| 90 or more Minutes | 28 (1.1%) | 6 (0.3%) |
Time of Departure to Work by Sex in Nantucket
The most frequent times of departure to work in Nantucket are 7:30 AM to 7:59 AM (718, 27.5%) for males and 8:30 AM to 8:59 AM (507, 20.7%) for females.
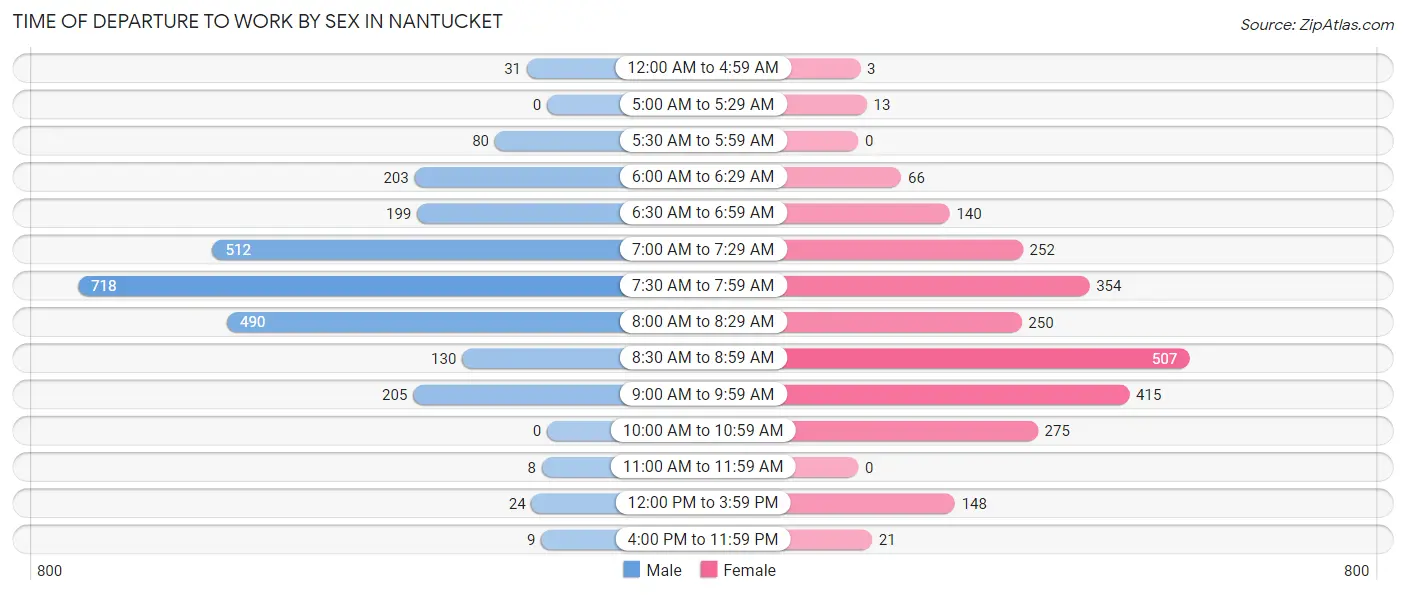
| Time of Departure | Male | Female |
| 12:00 AM to 4:59 AM | 31 (1.2%) | 3 (0.1%) |
| 5:00 AM to 5:29 AM | 0 (0.0%) | 13 (0.5%) |
| 5:30 AM to 5:59 AM | 80 (3.1%) | 0 (0.0%) |
| 6:00 AM to 6:29 AM | 203 (7.8%) | 66 (2.7%) |
| 6:30 AM to 6:59 AM | 199 (7.6%) | 140 (5.7%) |
| 7:00 AM to 7:29 AM | 512 (19.6%) | 252 (10.3%) |
| 7:30 AM to 7:59 AM | 718 (27.5%) | 354 (14.5%) |
| 8:00 AM to 8:29 AM | 490 (18.8%) | 250 (10.2%) |
| 8:30 AM to 8:59 AM | 130 (5.0%) | 507 (20.7%) |
| 9:00 AM to 9:59 AM | 205 (7.9%) | 415 (17.0%) |
| 10:00 AM to 10:59 AM | 0 (0.0%) | 275 (11.3%) |
| 11:00 AM to 11:59 AM | 8 (0.3%) | 0 (0.0%) |
| 12:00 PM to 3:59 PM | 24 (0.9%) | 148 (6.1%) |
| 4:00 PM to 11:59 PM | 9 (0.3%) | 21 (0.9%) |
| Total | 2,609 (100.0%) | 2,444 (100.0%) |
Housing Occupancy in Nantucket
Occupancy by Ownership in Nantucket
Of the total 3,261 dwellings in Nantucket, owner-occupied units account for 2,448 (75.1%), while renter-occupied units make up 813 (24.9%).
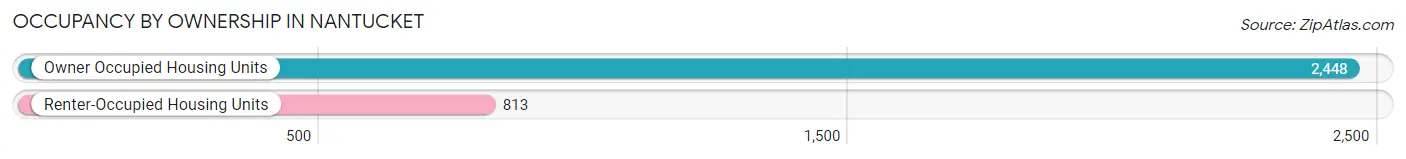
| Occupancy | # Housing Units | % Housing Units |
| Owner Occupied Housing Units | 2,448 | 75.1% |
| Renter-Occupied Housing Units | 813 | 24.9% |
| Total Occupied Housing Units | 3,261 | 100.0% |
Occupancy by Household Size in Nantucket
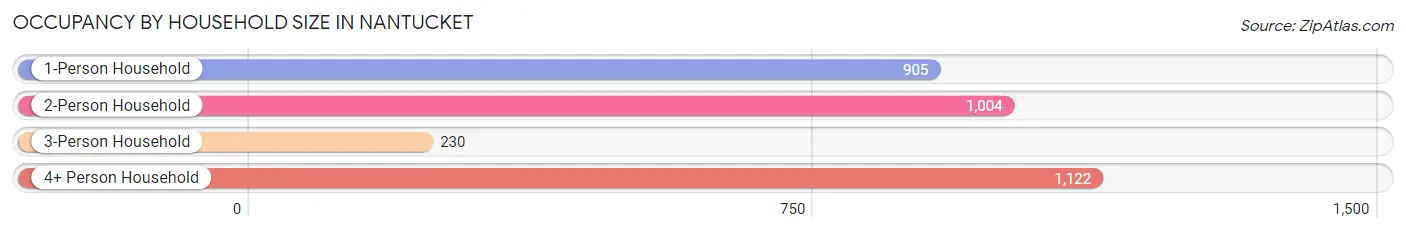
| Household Size | # Housing Units | % Housing Units |
| 1-Person Household | 905 | 27.8% |
| 2-Person Household | 1,004 | 30.8% |
| 3-Person Household | 230 | 7.0% |
| 4+ Person Household | 1,122 | 34.4% |
| Total Housing Units | 3,261 | 100.0% |
Occupancy by Ownership by Household Size in Nantucket
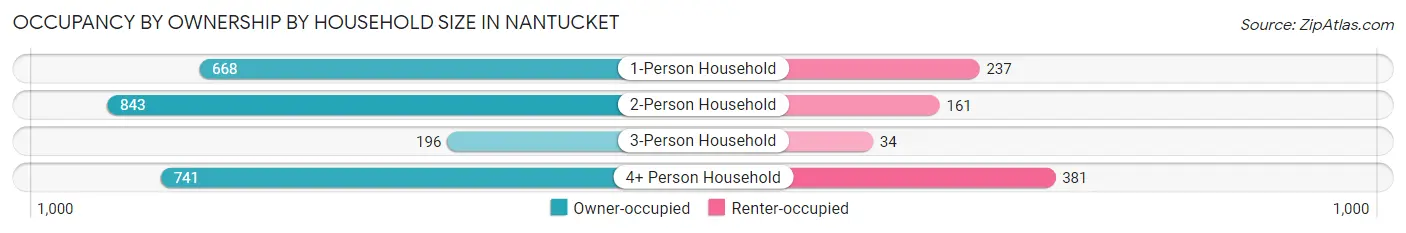
| Household Size | Owner-occupied | Renter-occupied |
| 1-Person Household | 668 (73.8%) | 237 (26.2%) |
| 2-Person Household | 843 (84.0%) | 161 (16.0%) |
| 3-Person Household | 196 (85.2%) | 34 (14.8%) |
| 4+ Person Household | 741 (66.0%) | 381 (34.0%) |
| Total Housing Units | 2,448 (75.1%) | 813 (24.9%) |
Occupancy by Educational Attainment in Nantucket
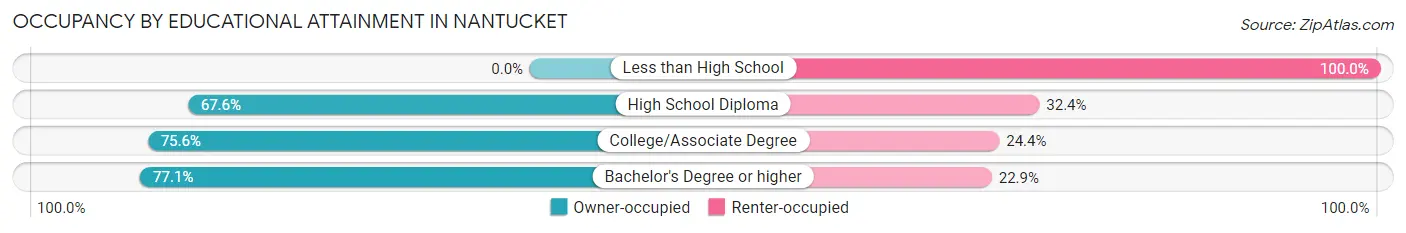
| Household Size | Owner-occupied | Renter-occupied |
| Less than High School | 0 (0.0%) | 7 (100.0%) |
| High School Diploma | 372 (67.6%) | 178 (32.4%) |
| College/Associate Degree | 418 (75.6%) | 135 (24.4%) |
| Bachelor's Degree or higher | 1,658 (77.1%) | 493 (22.9%) |
Occupancy by Age of Householder in Nantucket
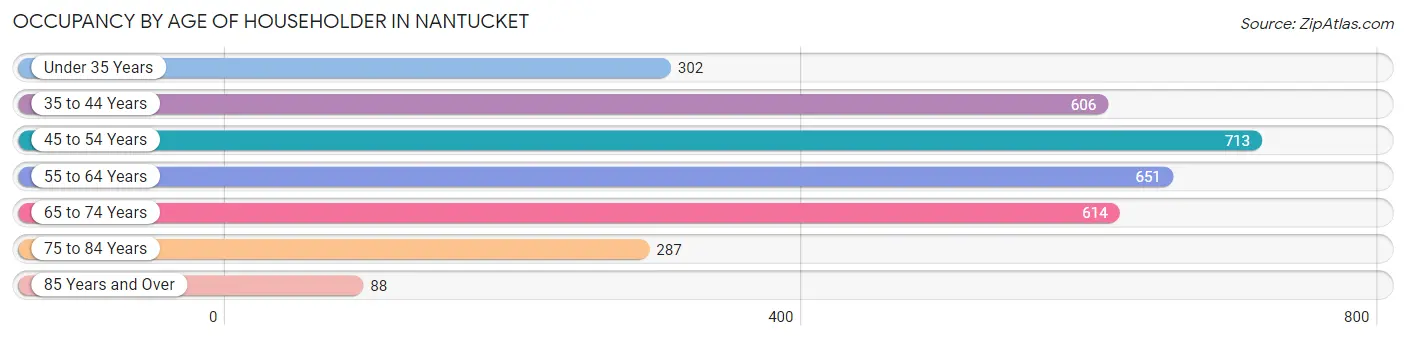
| Age Bracket | # Households | % Households |
| Under 35 Years | 302 | 9.3% |
| 35 to 44 Years | 606 | 18.6% |
| 45 to 54 Years | 713 | 21.9% |
| 55 to 64 Years | 651 | 20.0% |
| 65 to 74 Years | 614 | 18.8% |
| 75 to 84 Years | 287 | 8.8% |
| 85 Years and Over | 88 | 2.7% |
| Total | 3,261 | 100.0% |
Housing Finances in Nantucket
Median Income by Occupancy in Nantucket
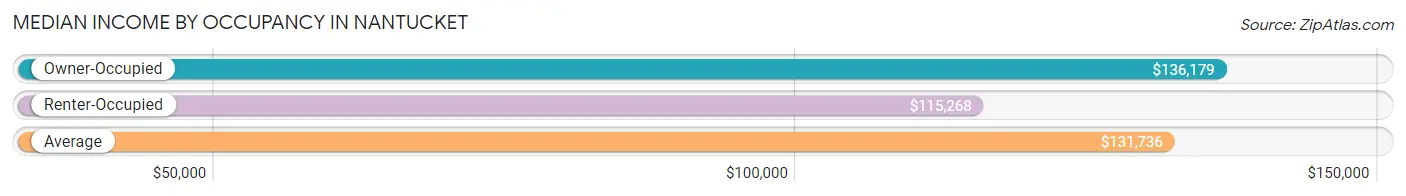
| Occupancy Type | # Households | Median Income |
| Owner-Occupied | 2,448 (75.1%) | $136,179 |
| Renter-Occupied | 813 (24.9%) | $115,268 |
| Average | 3,261 (100.0%) | $131,736 |
Occupancy by Householder Income Bracket in Nantucket
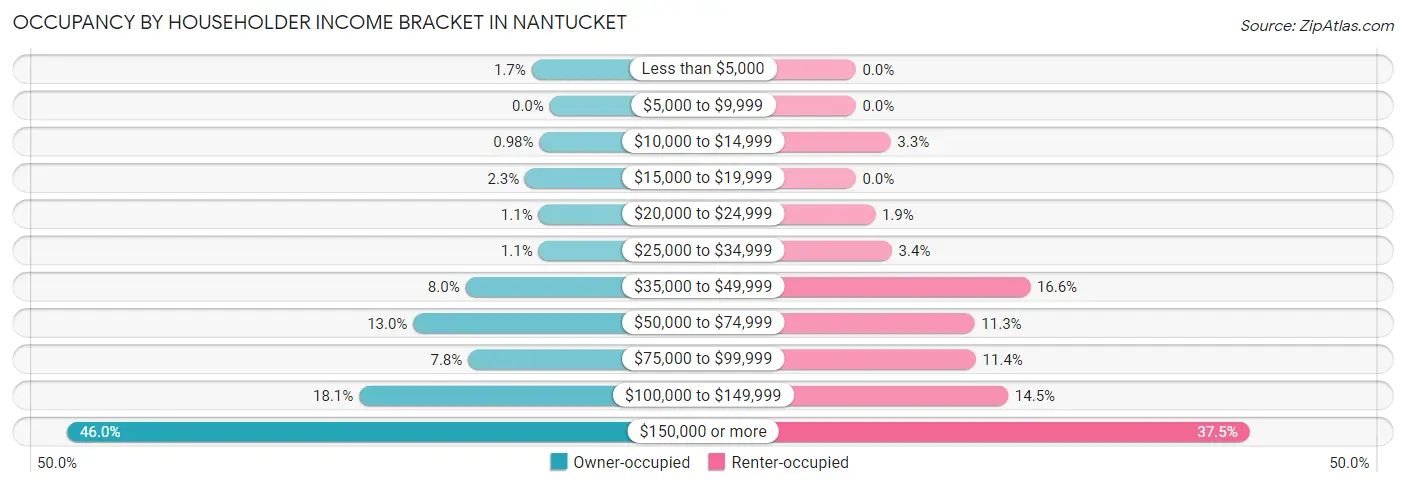
| Income Bracket | Owner-occupied | Renter-occupied |
| Less than $5,000 | 42 (1.7%) | 0 (0.0%) |
| $5,000 to $9,999 | 0 (0.0%) | 0 (0.0%) |
| $10,000 to $14,999 | 24 (1.0%) | 27 (3.3%) |
| $15,000 to $19,999 | 57 (2.3%) | 0 (0.0%) |
| $20,000 to $24,999 | 26 (1.1%) | 15 (1.8%) |
| $25,000 to $34,999 | 26 (1.1%) | 28 (3.4%) |
| $35,000 to $49,999 | 196 (8.0%) | 135 (16.6%) |
| $50,000 to $74,999 | 318 (13.0%) | 92 (11.3%) |
| $75,000 to $99,999 | 190 (7.8%) | 93 (11.4%) |
| $100,000 to $149,999 | 444 (18.1%) | 118 (14.5%) |
| $150,000 or more | 1,125 (46.0%) | 305 (37.5%) |
| Total | 2,448 (100.0%) | 813 (100.0%) |
Monthly Housing Cost Tiers in Nantucket
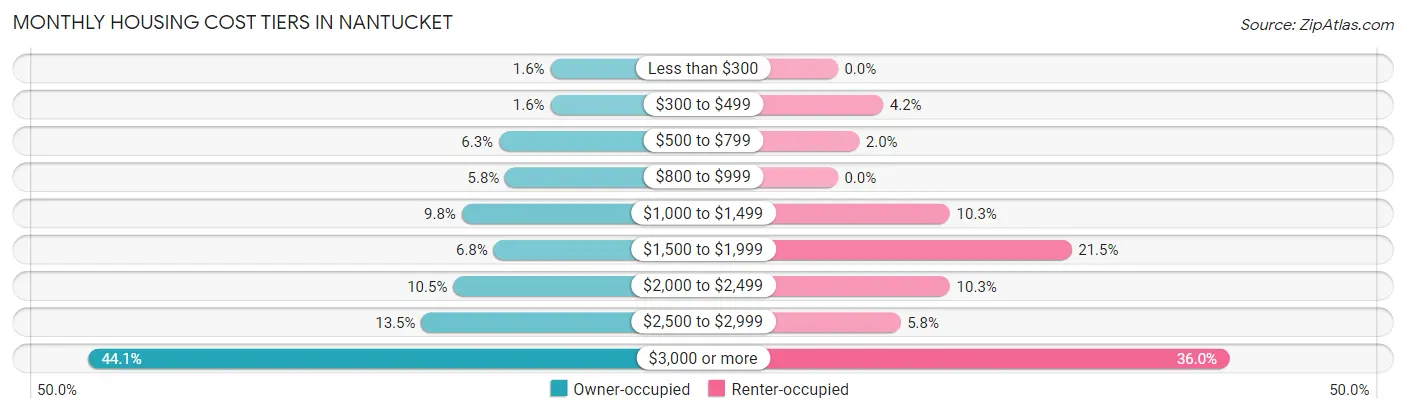
| Monthly Cost | Owner-occupied | Renter-occupied |
| Less than $300 | 39 (1.6%) | 0 (0.0%) |
| $300 to $499 | 39 (1.6%) | 34 (4.2%) |
| $500 to $799 | 155 (6.3%) | 16 (2.0%) |
| $800 to $999 | 141 (5.8%) | 0 (0.0%) |
| $1,000 to $1,499 | 239 (9.8%) | 84 (10.3%) |
| $1,500 to $1,999 | 167 (6.8%) | 175 (21.5%) |
| $2,000 to $2,499 | 258 (10.5%) | 84 (10.3%) |
| $2,500 to $2,999 | 330 (13.5%) | 47 (5.8%) |
| $3,000 or more | 1,080 (44.1%) | 293 (36.0%) |
| Total | 2,448 (100.0%) | 813 (100.0%) |
Physical Housing Characteristics in Nantucket
Housing Structures in Nantucket
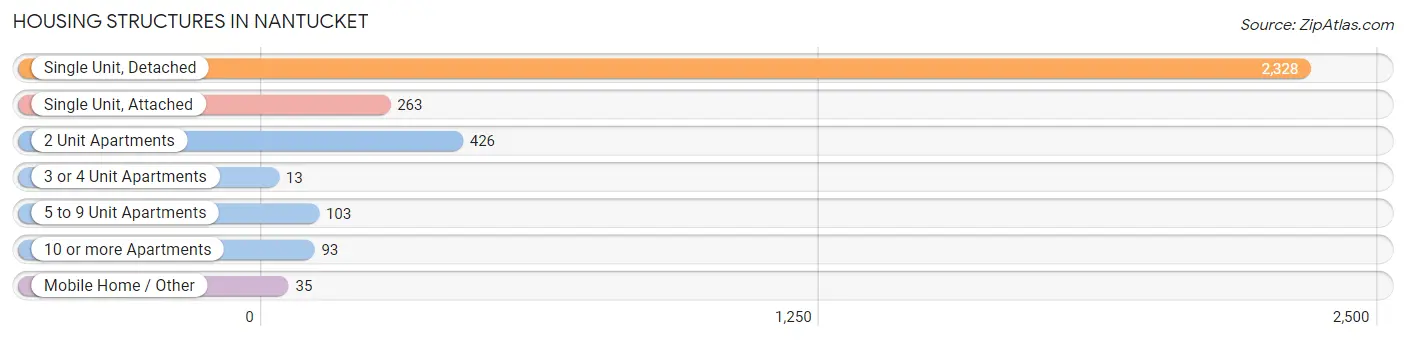
| Structure Type | # Housing Units | % Housing Units |
| Single Unit, Detached | 2,328 | 71.4% |
| Single Unit, Attached | 263 | 8.1% |
| 2 Unit Apartments | 426 | 13.1% |
| 3 or 4 Unit Apartments | 13 | 0.4% |
| 5 to 9 Unit Apartments | 103 | 3.2% |
| 10 or more Apartments | 93 | 2.9% |
| Mobile Home / Other | 35 | 1.1% |
| Total | 3,261 | 100.0% |
Housing Structures by Occupancy in Nantucket
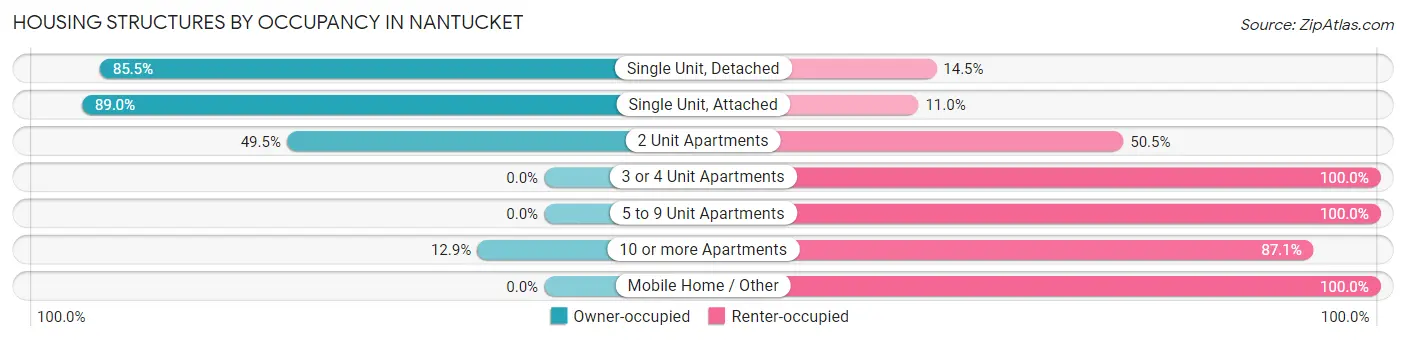
| Structure Type | Owner-occupied | Renter-occupied |
| Single Unit, Detached | 1,991 (85.5%) | 337 (14.5%) |
| Single Unit, Attached | 234 (89.0%) | 29 (11.0%) |
| 2 Unit Apartments | 211 (49.5%) | 215 (50.5%) |
| 3 or 4 Unit Apartments | 0 (0.0%) | 13 (100.0%) |
| 5 to 9 Unit Apartments | 0 (0.0%) | 103 (100.0%) |
| 10 or more Apartments | 12 (12.9%) | 81 (87.1%) |
| Mobile Home / Other | 0 (0.0%) | 35 (100.0%) |
| Total | 2,448 (75.1%) | 813 (24.9%) |
Housing Structures by Number of Rooms in Nantucket
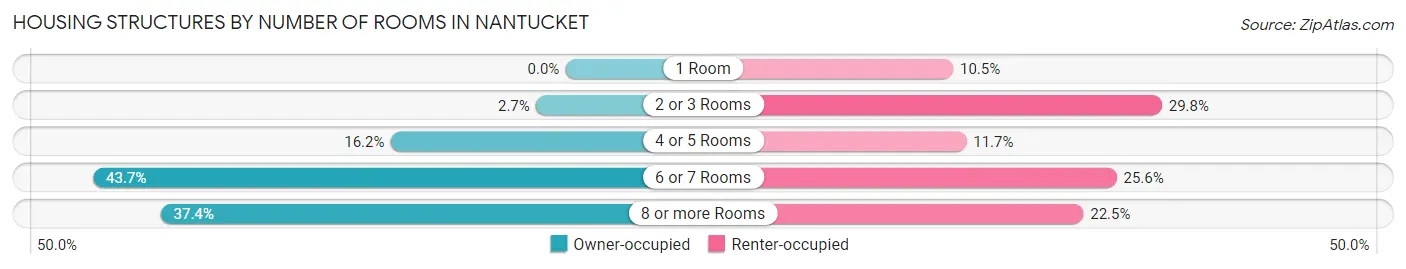
| Number of Rooms | Owner-occupied | Renter-occupied |
| 1 Room | 0 (0.0%) | 85 (10.5%) |
| 2 or 3 Rooms | 67 (2.7%) | 242 (29.8%) |
| 4 or 5 Rooms | 396 (16.2%) | 95 (11.7%) |
| 6 or 7 Rooms | 1,069 (43.7%) | 208 (25.6%) |
| 8 or more Rooms | 916 (37.4%) | 183 (22.5%) |
| Total | 2,448 (100.0%) | 813 (100.0%) |
Housing Structure by Heating Type in Nantucket
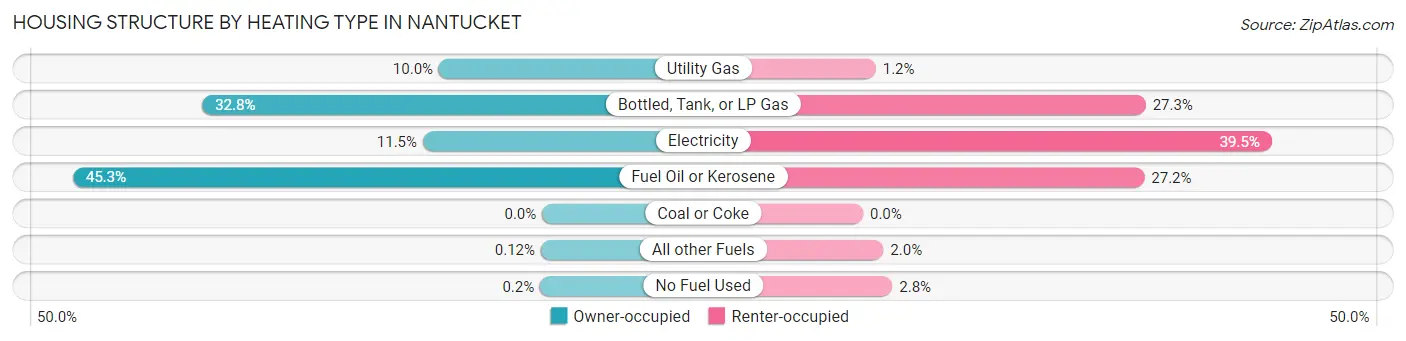
| Heating Type | Owner-occupied | Renter-occupied |
| Utility Gas | 244 (10.0%) | 10 (1.2%) |
| Bottled, Tank, or LP Gas | 804 (32.8%) | 222 (27.3%) |
| Electricity | 282 (11.5%) | 321 (39.5%) |
| Fuel Oil or Kerosene | 1,110 (45.3%) | 221 (27.2%) |
| Coal or Coke | 0 (0.0%) | 0 (0.0%) |
| All other Fuels | 3 (0.1%) | 16 (2.0%) |
| No Fuel Used | 5 (0.2%) | 23 (2.8%) |
| Total | 2,448 (100.0%) | 813 (100.0%) |
Household Vehicle Usage in Nantucket
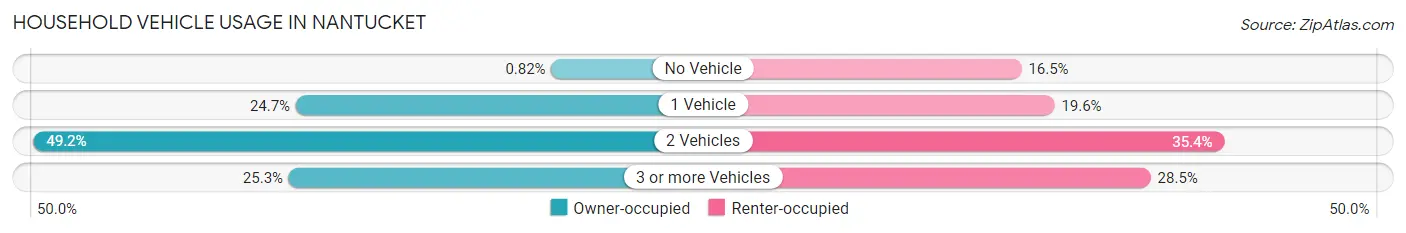
| Vehicles per Household | Owner-occupied | Renter-occupied |
| No Vehicle | 20 (0.8%) | 134 (16.5%) |
| 1 Vehicle | 604 (24.7%) | 159 (19.6%) |
| 2 Vehicles | 1,204 (49.2%) | 288 (35.4%) |
| 3 or more Vehicles | 620 (25.3%) | 232 (28.5%) |
| Total | 2,448 (100.0%) | 813 (100.0%) |
Real Estate & Mortgages in Nantucket
Real Estate and Mortgage Overview in Nantucket
| Characteristic | Without Mortgage | With Mortgage |
| Housing Units | 799 | 1,649 |
| Median Property Value | $1,239,400 | $1,148,300 |
| Median Household Income | $120,417 | $803 |
| Monthly Housing Costs | $1,103 | $1,076 |
| Real Estate Taxes | $3,395 | $0 |
Property Value by Mortgage Status in Nantucket
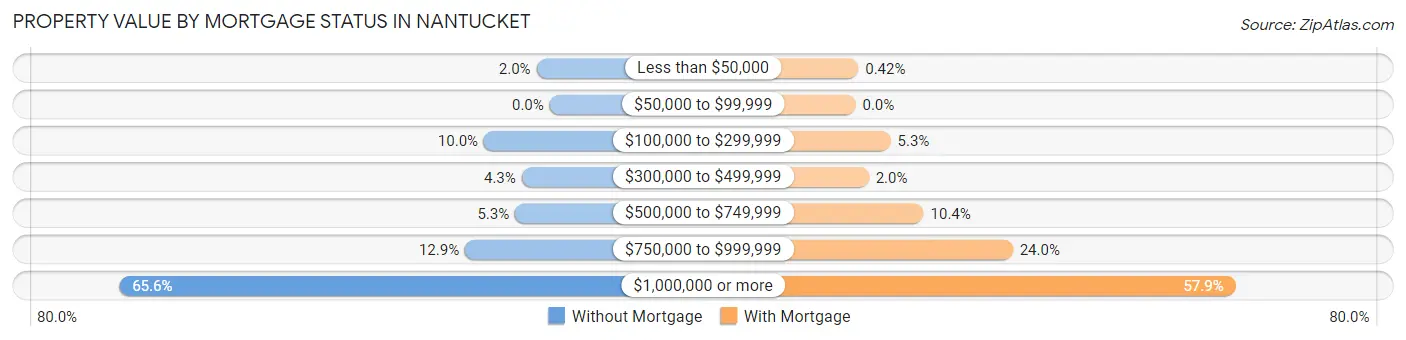
| Property Value | Without Mortgage | With Mortgage |
| Less than $50,000 | 16 (2.0%) | 7 (0.4%) |
| $50,000 to $99,999 | 0 (0.0%) | 0 (0.0%) |
| $100,000 to $299,999 | 80 (10.0%) | 88 (5.3%) |
| $300,000 to $499,999 | 34 (4.3%) | 33 (2.0%) |
| $500,000 to $749,999 | 42 (5.3%) | 171 (10.4%) |
| $750,000 to $999,999 | 103 (12.9%) | 395 (23.9%) |
| $1,000,000 or more | 524 (65.6%) | 955 (57.9%) |
| Total | 799 (100.0%) | 1,649 (100.0%) |
Household Income by Mortgage Status in Nantucket
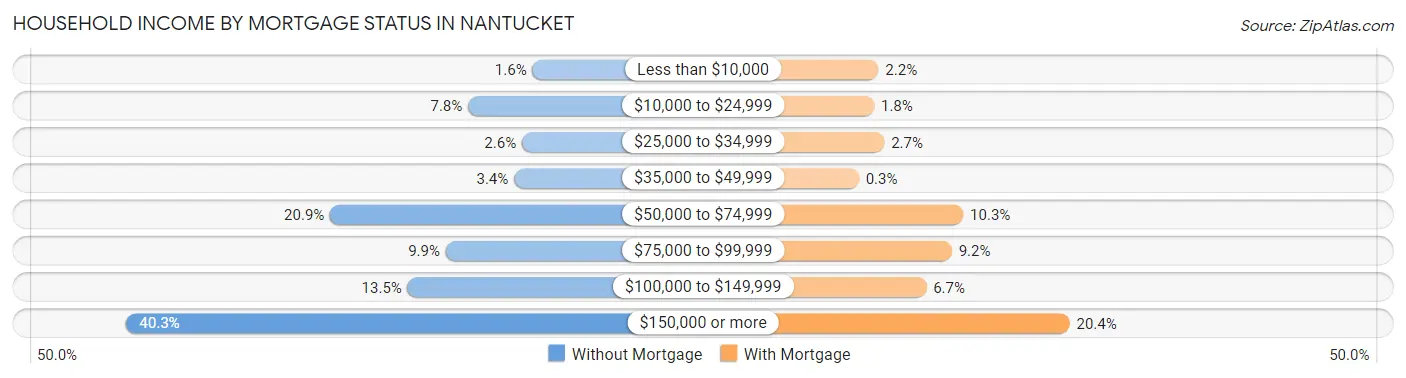
| Household Income | Without Mortgage | With Mortgage |
| Less than $10,000 | 13 (1.6%) | 36 (2.2%) |
| $10,000 to $24,999 | 62 (7.8%) | 29 (1.8%) |
| $25,000 to $34,999 | 21 (2.6%) | 45 (2.7%) |
| $35,000 to $49,999 | 27 (3.4%) | 5 (0.3%) |
| $50,000 to $74,999 | 167 (20.9%) | 169 (10.2%) |
| $75,000 to $99,999 | 79 (9.9%) | 151 (9.2%) |
| $100,000 to $149,999 | 108 (13.5%) | 111 (6.7%) |
| $150,000 or more | 322 (40.3%) | 336 (20.4%) |
| Total | 799 (100.0%) | 1,649 (100.0%) |
Property Value to Household Income Ratio in Nantucket
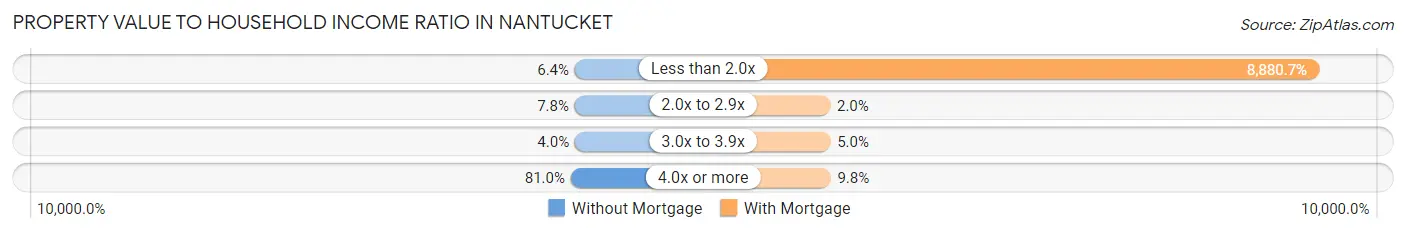
| Value-to-Income Ratio | Without Mortgage | With Mortgage |
| Less than 2.0x | 51 (6.4%) | 146,442 (8,880.6%) |
| 2.0x to 2.9x | 62 (7.8%) | 33 (2.0%) |
| 3.0x to 3.9x | 32 (4.0%) | 82 (5.0%) |
| 4.0x or more | 647 (81.0%) | 162 (9.8%) |
| Total | 799 (100.0%) | 1,649 (100.0%) |
Real Estate Taxes by Mortgage Status in Nantucket
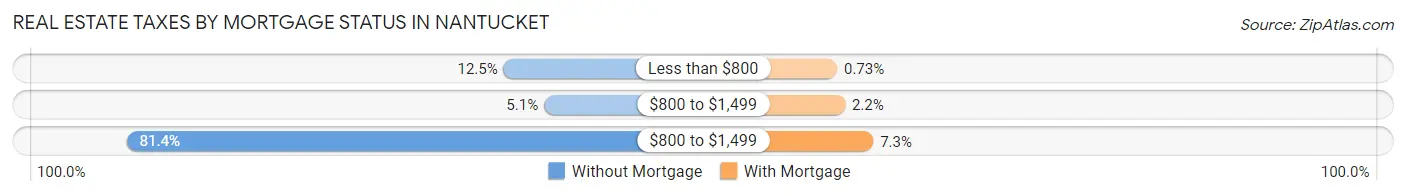
| Property Taxes | Without Mortgage | With Mortgage |
| Less than $800 | 100 (12.5%) | 12 (0.7%) |
| $800 to $1,499 | 41 (5.1%) | 36 (2.2%) |
| $800 to $1,499 | 650 (81.4%) | 121 (7.3%) |
| Total | 799 (100.0%) | 1,649 (100.0%) |
Health & Disability in Nantucket
Health Insurance Coverage by Age in Nantucket
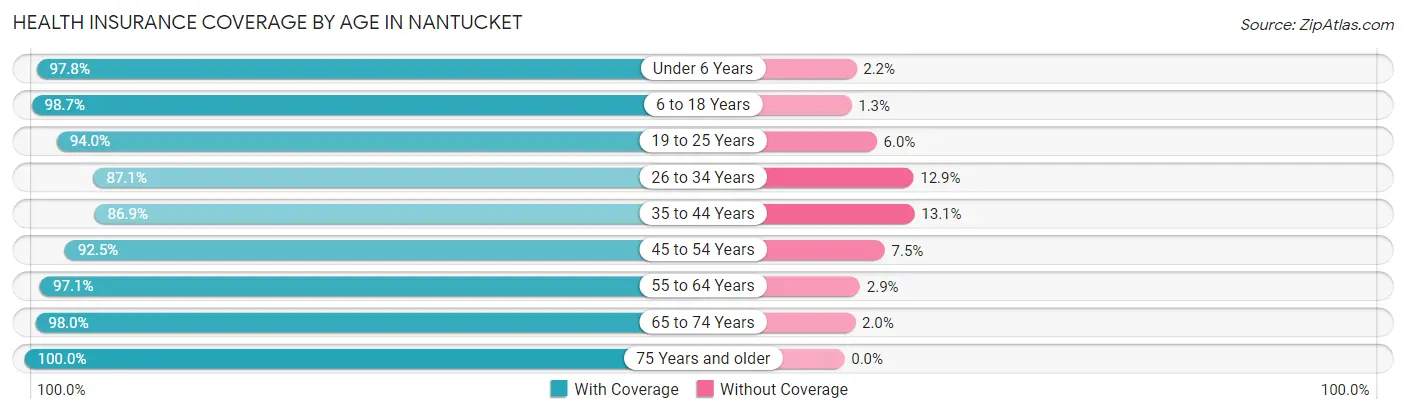
| Age Bracket | With Coverage | Without Coverage |
| Under 6 Years | 483 (97.8%) | 11 (2.2%) |
| 6 to 18 Years | 1,981 (98.7%) | 26 (1.3%) |
| 19 to 25 Years | 703 (94.0%) | 45 (6.0%) |
| 26 to 34 Years | 1,009 (87.1%) | 149 (12.9%) |
| 35 to 44 Years | 1,344 (86.9%) | 202 (13.1%) |
| 45 to 54 Years | 1,647 (92.5%) | 134 (7.5%) |
| 55 to 64 Years | 1,071 (97.1%) | 32 (2.9%) |
| 65 to 74 Years | 1,079 (98.0%) | 22 (2.0%) |
| 75 Years and older | 506 (100.0%) | 0 (0.0%) |
| Total | 9,823 (94.1%) | 621 (5.9%) |
Health Insurance Coverage by Citizenship Status in Nantucket

| Citizenship Status | With Coverage | Without Coverage |
| Native Born | 483 (97.8%) | 11 (2.2%) |
| Foreign Born, Citizen | 1,981 (98.7%) | 26 (1.3%) |
| Foreign Born, not a Citizen | 703 (94.0%) | 45 (6.0%) |
Health Insurance Coverage by Household Income in Nantucket
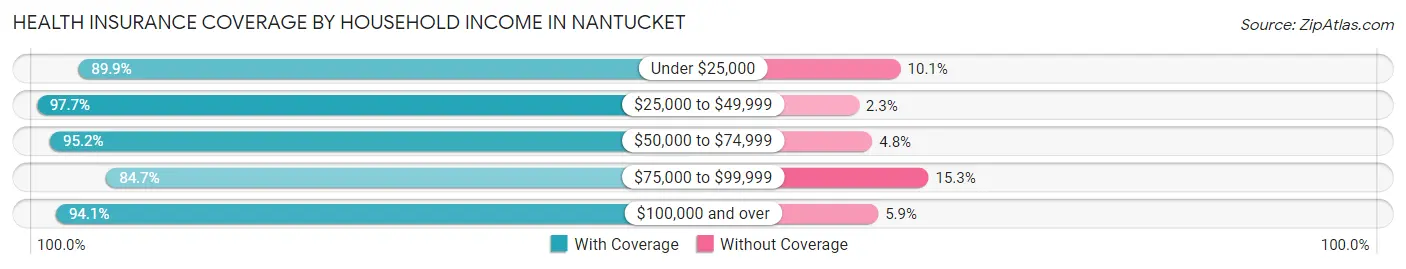
| Household Income | With Coverage | Without Coverage |
| Under $25,000 | 232 (89.9%) | 26 (10.1%) |
| $25,000 to $49,999 | 860 (97.7%) | 20 (2.3%) |
| $50,000 to $74,999 | 875 (95.2%) | 44 (4.8%) |
| $75,000 to $99,999 | 431 (84.7%) | 78 (15.3%) |
| $100,000 and over | 7,244 (94.1%) | 453 (5.9%) |
Public vs Private Health Insurance Coverage by Age in Nantucket
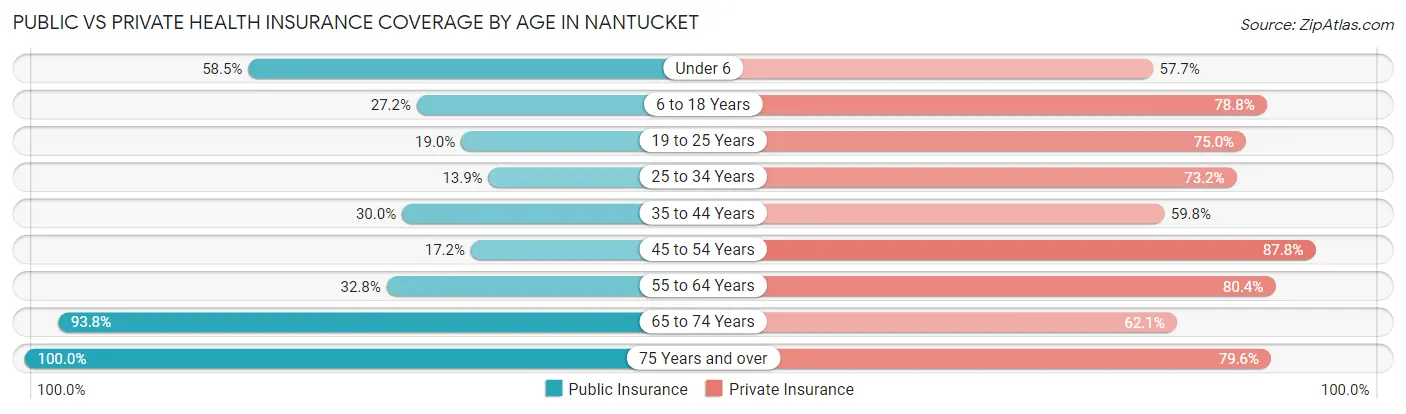
| Age Bracket | Public Insurance | Private Insurance |
| Under 6 | 289 (58.5%) | 285 (57.7%) |
| 6 to 18 Years | 546 (27.2%) | 1,582 (78.8%) |
| 19 to 25 Years | 142 (19.0%) | 561 (75.0%) |
| 25 to 34 Years | 161 (13.9%) | 848 (73.2%) |
| 35 to 44 Years | 463 (29.9%) | 924 (59.8%) |
| 45 to 54 Years | 306 (17.2%) | 1,564 (87.8%) |
| 55 to 64 Years | 362 (32.8%) | 887 (80.4%) |
| 65 to 74 Years | 1,033 (93.8%) | 684 (62.1%) |
| 75 Years and over | 506 (100.0%) | 403 (79.6%) |
| Total | 3,808 (36.5%) | 7,738 (74.1%) |
Disability Status by Sex by Age in Nantucket
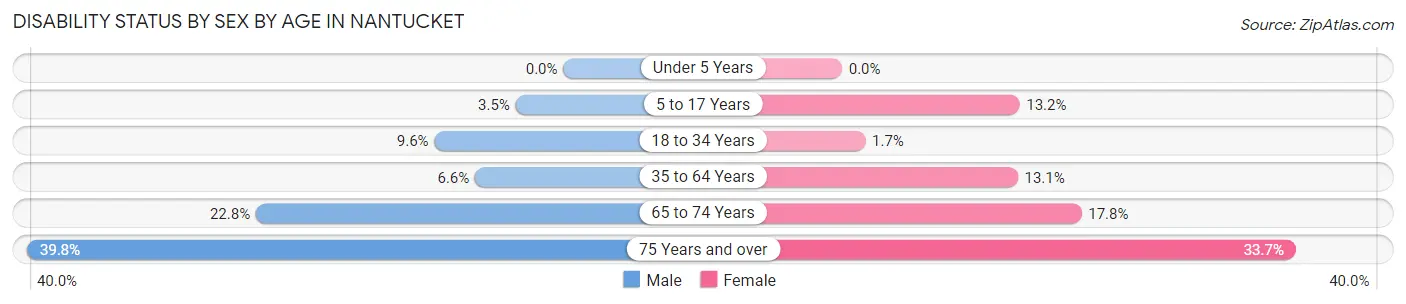
| Age Bracket | Male | Female |
| Under 5 Years | 0 (0.0%) | 0 (0.0%) |
| 5 to 17 Years | 43 (3.5%) | 90 (13.2%) |
| 18 to 34 Years | 111 (9.6%) | 16 (1.7%) |
| 35 to 64 Years | 148 (6.6%) | 283 (13.1%) |
| 65 to 74 Years | 128 (22.8%) | 96 (17.8%) |
| 75 Years and over | 94 (39.8%) | 91 (33.7%) |
Disability Class by Sex by Age in Nantucket
Disability Class: Hearing Difficulty
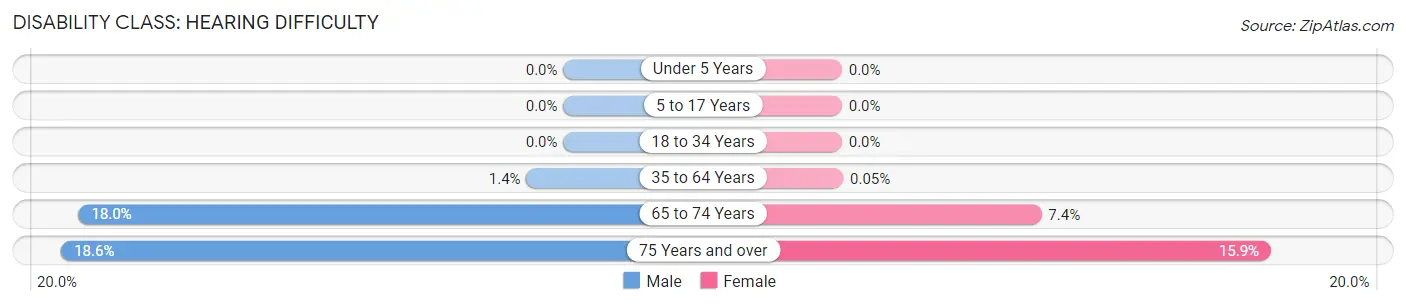
| Age Bracket | Male | Female |
| Under 5 Years | 0 (0.0%) | 0 (0.0%) |
| 5 to 17 Years | 0 (0.0%) | 0 (0.0%) |
| 18 to 34 Years | 0 (0.0%) | 0 (0.0%) |
| 35 to 64 Years | 31 (1.4%) | 1 (0.1%) |
| 65 to 74 Years | 101 (18.0%) | 40 (7.4%) |
| 75 Years and over | 44 (18.6%) | 43 (15.9%) |
Disability Class: Vision Difficulty
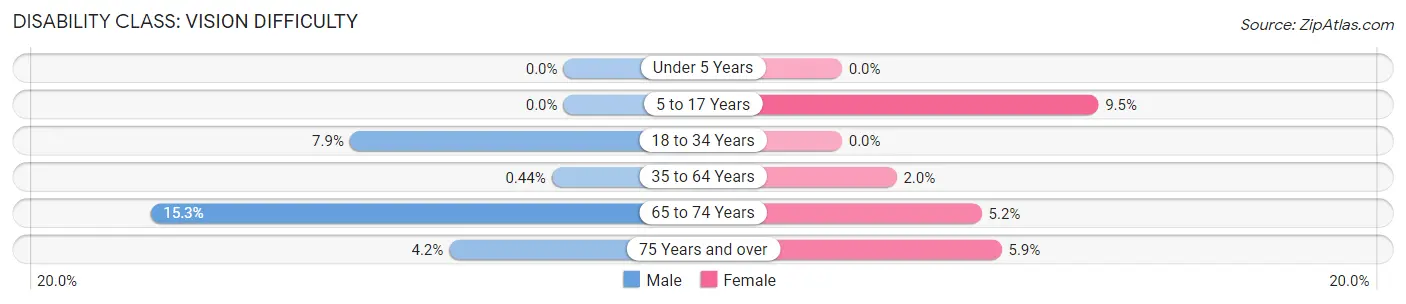
| Age Bracket | Male | Female |
| Under 5 Years | 0 (0.0%) | 0 (0.0%) |
| 5 to 17 Years | 0 (0.0%) | 65 (9.5%) |
| 18 to 34 Years | 92 (7.9%) | 0 (0.0%) |
| 35 to 64 Years | 10 (0.4%) | 44 (2.0%) |
| 65 to 74 Years | 86 (15.3%) | 28 (5.2%) |
| 75 Years and over | 10 (4.2%) | 16 (5.9%) |
Disability Class: Cognitive Difficulty
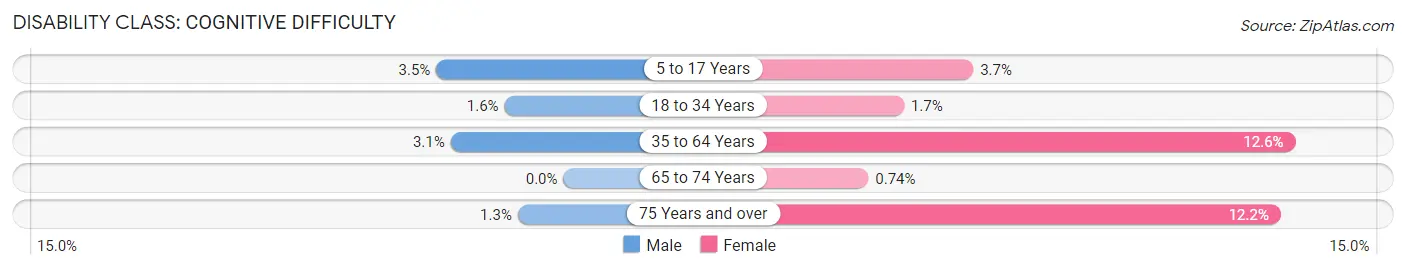
| Age Bracket | Male | Female |
| 5 to 17 Years | 43 (3.5%) | 25 (3.7%) |
| 18 to 34 Years | 19 (1.6%) | 16 (1.7%) |
| 35 to 64 Years | 71 (3.1%) | 274 (12.6%) |
| 65 to 74 Years | 0 (0.0%) | 4 (0.7%) |
| 75 Years and over | 3 (1.3%) | 33 (12.2%) |
Disability Class: Ambulatory Difficulty
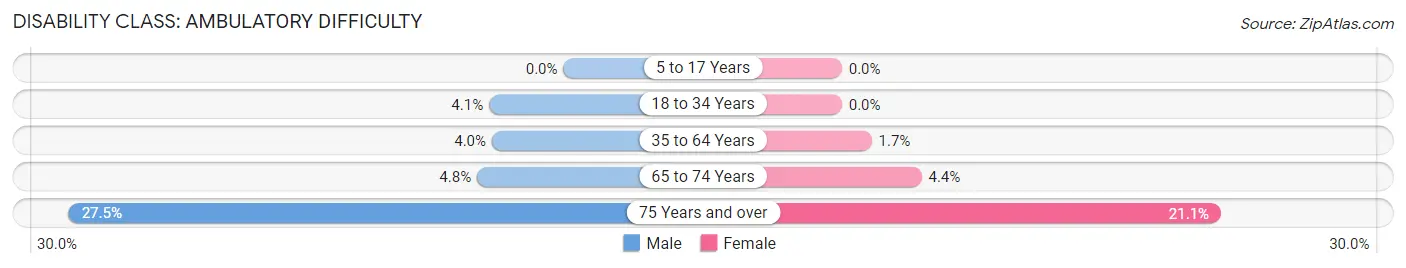
| Age Bracket | Male | Female |
| 5 to 17 Years | 0 (0.0%) | 0 (0.0%) |
| 18 to 34 Years | 48 (4.1%) | 0 (0.0%) |
| 35 to 64 Years | 90 (4.0%) | 36 (1.7%) |
| 65 to 74 Years | 27 (4.8%) | 24 (4.4%) |
| 75 Years and over | 65 (27.5%) | 57 (21.1%) |
Disability Class: Self-Care Difficulty
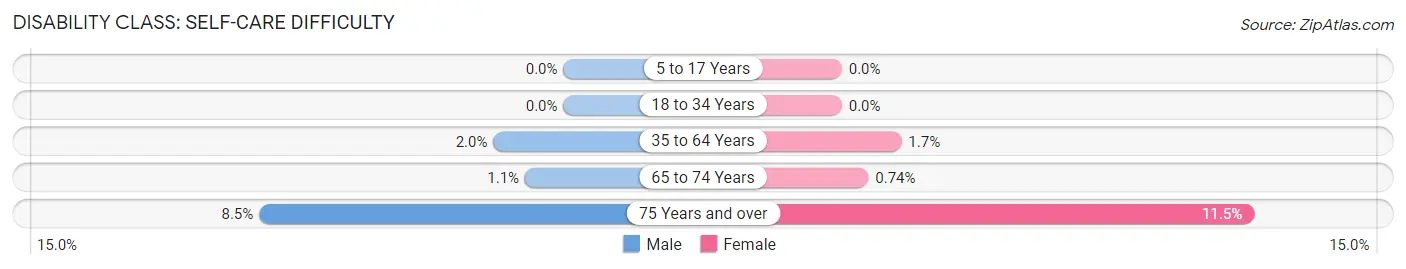
| Age Bracket | Male | Female |
| 5 to 17 Years | 0 (0.0%) | 0 (0.0%) |
| 18 to 34 Years | 0 (0.0%) | 0 (0.0%) |
| 35 to 64 Years | 44 (1.9%) | 36 (1.7%) |
| 65 to 74 Years | 6 (1.1%) | 4 (0.7%) |
| 75 Years and over | 20 (8.5%) | 31 (11.5%) |
Technology Access in Nantucket
Computing Device Access in Nantucket
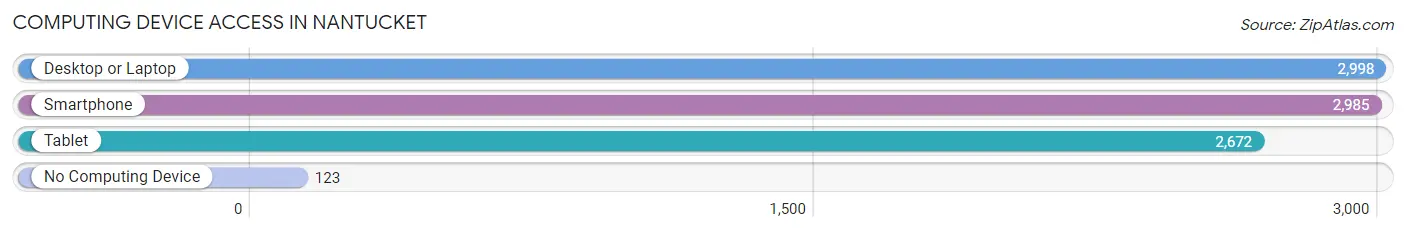
| Device Type | # Households | % Households |
| Desktop or Laptop | 2,998 | 91.9% |
| Smartphone | 2,985 | 91.5% |
| Tablet | 2,672 | 81.9% |
| No Computing Device | 123 | 3.8% |
| Total | 3,261 | 100.0% |
Internet Access in Nantucket
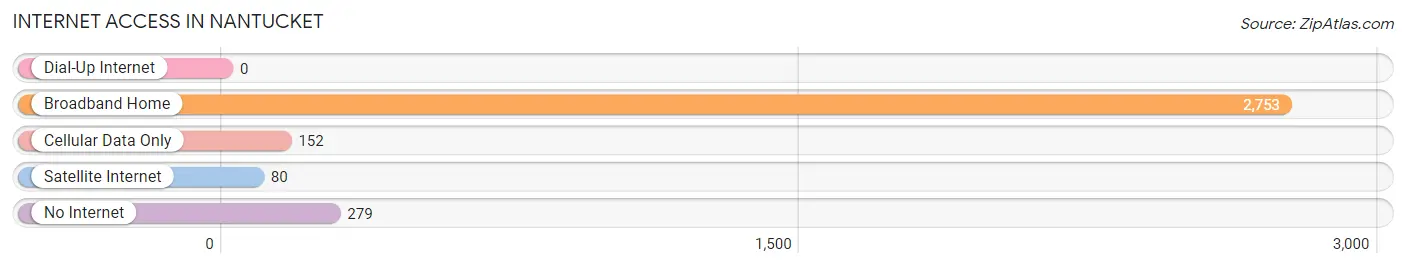
| Internet Type | # Households | % Households |
| Dial-Up Internet | 0 | 0.0% |
| Broadband Home | 2,753 | 84.4% |
| Cellular Data Only | 152 | 4.7% |
| Satellite Internet | 80 | 2.5% |
| No Internet | 279 | 8.6% |
| Total | 3,261 | 100.0% |
Nantucket Summary
Nantucket is an island located 30 miles south of Cape Cod, Massachusetts. It is the largest island in Massachusetts and is part of the town of Nantucket. The island is known for its rich history, stunning geography, vibrant economy, and diverse demographics.
History
Nantucket has a long and storied history. The island was first inhabited by the Wampanoag people, who called it “Natocket” or “Natockete”, meaning “far away land”. The island was first explored by English settlers in 1659, and was incorporated as a town in 1671.
In the 18th century, Nantucket became a major whaling port, and the island’s population grew rapidly. By the mid-19th century, Nantucket was the world’s leading whaling port, and the island’s population peaked at around 10,000. However, the whaling industry declined in the late 19th century, and the island’s population began to decline.
In the 20th century, Nantucket began to reinvent itself as a tourist destination. The island’s population began to grow again, and today it stands at around 10,000.
Geography
Nantucket is located 30 miles south of Cape Cod, Massachusetts. The island is 14 miles long and 3.5 miles wide, and has a total area of 48 square miles. The island is surrounded by the Atlantic Ocean, Nantucket Sound, and Muskeget Channel.
The island is composed of rolling hills, sandy beaches, and salt marshes. The highest point on the island is Wauwinet Hill, which stands at 108 feet above sea level.
Economy
Nantucket’s economy is largely driven by tourism. The island is a popular destination for vacationers, and the tourism industry is the largest employer on the island. Other major industries include fishing, boat building, and retail.
The island also has a vibrant arts and culture scene. There are several museums, galleries, and theaters on the island, as well as a number of festivals and events throughout the year.
Demographics
As of the 2010 census, the population of Nantucket was 10,172. The population is largely white (90.2%), with small percentages of African American (2.2%), Asian (1.2%), and Native American (0.3%) residents.
The median household income on the island is $77,837, and the median home value is $1,072,400. The island has a high cost of living, and the unemployment rate is 4.2%.
Conclusion
Nantucket is an island with a rich history, stunning geography, vibrant economy, and diverse demographics. The island is a popular tourist destination, and its economy is largely driven by tourism. The island’s population is largely white, with small percentages of African American, Asian, and Native American residents. The median household income on the island is $77,837, and the median home value is $1,072,400.
Common Questions
What is the Total Population of Nantucket?
Total Population of Nantucket is 10,479.
What is the Total Male Population of Nantucket?
Total Male Population of Nantucket is 5,584.
What is the Total Female Population of Nantucket?
Total Female Population of Nantucket is 4,895.
What is the Ratio of Males per 100 Females in Nantucket?
There are 114.08 Males per 100 Females in Nantucket.
What is the Ratio of Females per 100 Males in Nantucket?
There are 87.66 Females per 100 Males in Nantucket.
What is the Median Population Age in Nantucket?
Median Population Age in Nantucket is 39.7 Years.
What is the Average Family Size in Nantucket
Average Family Size in Nantucket is 3.6 People.
What is the Average Household Size in Nantucket
Average Household Size in Nantucket is 3.1 People.
What is Per Capita Income in Nantucket?
Per Capita income in Nantucket is $56,829.
What is the Median Family Income in Nantucket?
Median Family Income in Nantucket is $134,138.
What is the Median Household income in Nantucket?
Median Household Income in Nantucket is $131,736.
What is Income or Wage Gap in Nantucket?
Income or Wage Gap in Nantucket is 2.6%.
Women in Nantucket earn 97.4 cents for every dollar earned by a man.
What is Inequality or Gini Index in Nantucket?
Inequality or Gini Index in Nantucket is 0.44.
How Large is the Labor Force in Nantucket?
There are 6,012 People in the Labor Forcein in Nantucket.
What is the Percentage of People in the Labor Force in Nantucket?
71.5% of People are in the Labor Force in Nantucket.
What is the Unemployment Rate in Nantucket?
Unemployment Rate in Nantucket is 6.3%.