Cities with the Highest Percentage of Immigrants from Canada in Massachusetts
RELATED REPORTS & OPTIONS
Canada
Massachusetts
Compare Cities
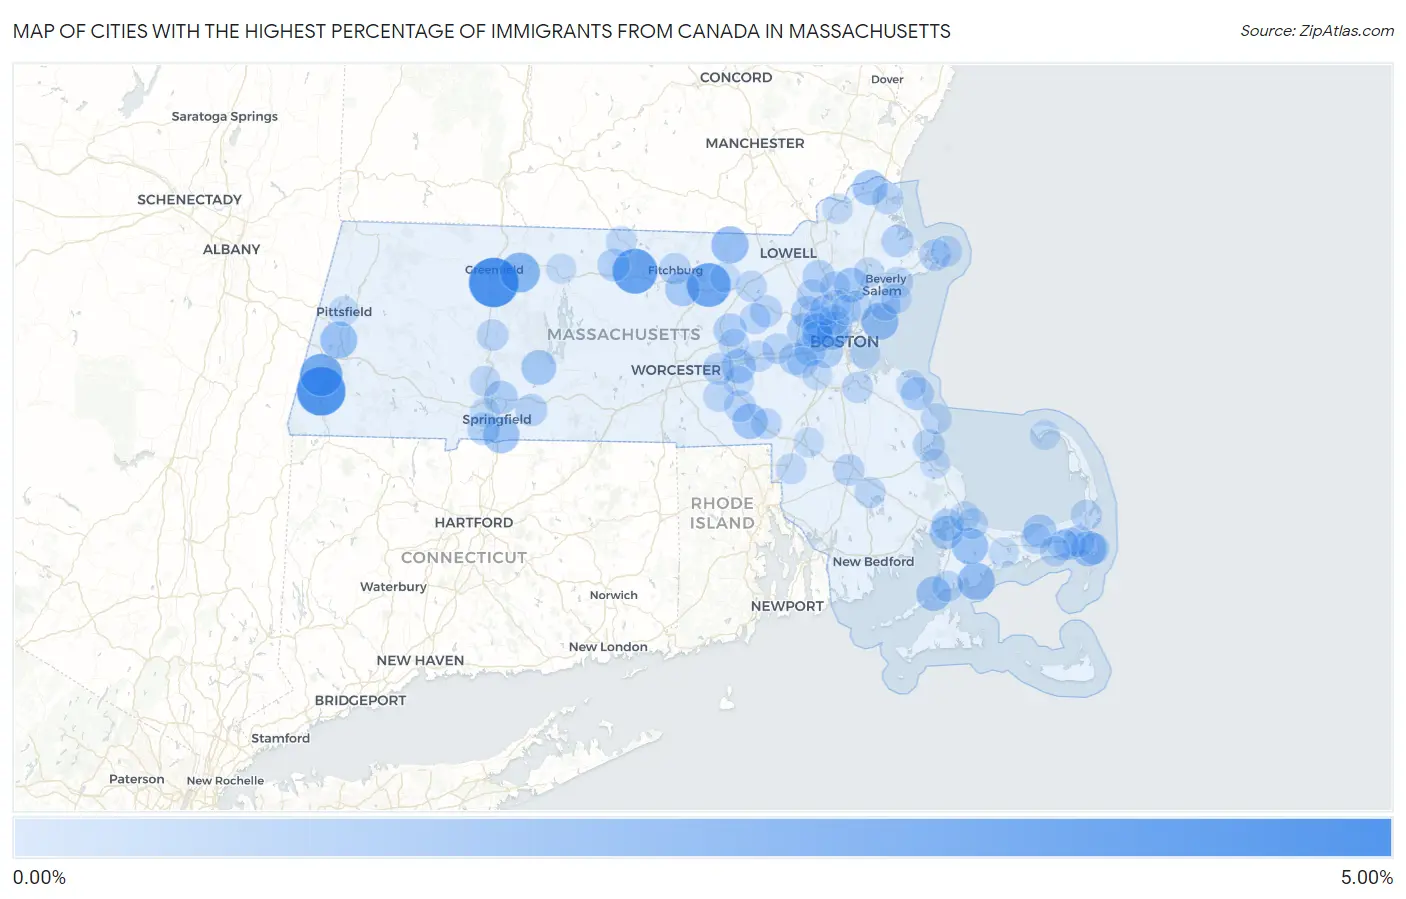
Map of Cities with the Highest Percentage of Immigrants from Canada in Massachusetts
0.00%
5.00%
Cities with the Highest Percentage of Immigrants from Canada in Massachusetts
| City | Canada | vs State | vs National | |
| 1. | Deerfield | 4.73% | 0.40%(+4.33)#-1 | 0.25%(+4.48)#0 |
| 2. | Great Barrington | 4.50% | 0.40%(+4.09)#0 | 0.25%(+4.25)#1 |
| 3. | Gardner | 3.62% | 0.40%(+3.22)#134 | 0.25%(+3.37)#3,358 |
| 4. | Shirley | 3.38% | 0.40%(+2.98)#135 | 0.25%(+3.14)#3,359 |
| 5. | Housatonic | 3.05% | 0.40%(+2.64)#136 | 0.25%(+2.80)#3,360 |
| 6. | Millers Falls | 2.45% | 0.40%(+2.05)#137 | 0.25%(+2.20)#3,361 |
| 7. | East Pepperell | 1.90% | 0.40%(+1.50)#138 | 0.25%(+1.65)#3,362 |
| 8. | New Seabury | 1.90% | 0.40%(+1.49)#139 | 0.25%(+1.65)#3,363 |
| 9. | Nahant | 1.83% | 0.40%(+1.43)#140 | 0.25%(+1.58)#3,364 |
| 10. | Lenox | 1.80% | 0.40%(+1.40)#141 | 0.25%(+1.55)#3,365 |
| 11. | Longmeadow | 1.68% | 0.40%(+1.28)#142 | 0.25%(+1.44)#3,366 |
| 12. | Forestdale | 1.66% | 0.40%(+1.26)#143 | 0.25%(+1.41)#3,367 |
| 13. | West Chatham | 1.47% | 0.40%(+1.07)#144 | 0.25%(+1.22)#3,368 |
| 14. | Bellingham | 1.45% | 0.40%(+1.04)#145 | 0.25%(+1.20)#3,369 |
| 15. | Amesbury Town | 1.41% | 0.40%(+1.00)#146 | 0.25%(+1.16)#3,370 |
| 16. | Belchertown | 1.36% | 0.40%(+0.956)#147 | 0.25%(+1.11)#3,371 |
| 17. | Leominster | 1.33% | 0.40%(+0.931)#148 | 0.25%(+1.09)#3,372 |
| 18. | Woods Hole | 1.31% | 0.40%(+0.907)#149 | 0.25%(+1.06)#3,373 |
| 19. | Lynnfield | 1.31% | 0.40%(+0.904)#150 | 0.25%(+1.06)#3,374 |
| 20. | Somerville | 1.19% | 0.40%(+0.787)#151 | 0.25%(+0.942)#3,375 |
| 21. | Cordaville | 1.18% | 0.40%(+0.776)#152 | 0.25%(+0.931)#3,376 |
| 22. | Bourne | 1.07% | 0.40%(+0.663)#153 | 0.25%(+0.818)#3,377 |
| 23. | Waltham | 1.06% | 0.40%(+0.654)#154 | 0.25%(+0.809)#3,378 |
| 24. | Dennis | 1.05% | 0.40%(+0.651)#155 | 0.25%(+0.806)#3,379 |
| 25. | Brookline | 1.02% | 0.40%(+0.616)#156 | 0.25%(+0.771)#3,380 |
| 26. | Chicopee | 0.99% | 0.40%(+0.583)#157 | 0.25%(+0.738)#3,381 |
| 27. | Scituate | 0.96% | 0.40%(+0.552)#158 | 0.25%(+0.707)#3,382 |
| 28. | Hudson | 0.94% | 0.40%(+0.533)#159 | 0.25%(+0.688)#3,383 |
| 29. | Lexington | 0.94% | 0.40%(+0.532)#160 | 0.25%(+0.687)#3,384 |
| 30. | Arlington | 0.89% | 0.40%(+0.483)#161 | 0.25%(+0.638)#3,385 |
| 31. | Baldwinville | 0.87% | 0.40%(+0.472)#162 | 0.25%(+0.627)#3,386 |
| 32. | Wilmington | 0.81% | 0.40%(+0.407)#163 | 0.25%(+0.562)#3,387 |
| 33. | Agawam Town | 0.81% | 0.40%(+0.404)#164 | 0.25%(+0.559)#3,388 |
| 34. | Wellesley | 0.80% | 0.40%(+0.401)#165 | 0.25%(+0.555)#3,389 |
| 35. | Newton | 0.78% | 0.40%(+0.381)#166 | 0.25%(+0.536)#3,390 |
| 36. | Cambridge | 0.78% | 0.40%(+0.377)#167 | 0.25%(+0.532)#3,391 |
| 37. | Buzzards Bay | 0.77% | 0.40%(+0.365)#168 | 0.25%(+0.520)#3,392 |
| 38. | Ipswich | 0.76% | 0.40%(+0.356)#169 | 0.25%(+0.511)#3,393 |
| 39. | Wilbraham | 0.76% | 0.40%(+0.352)#170 | 0.25%(+0.507)#3,394 |
| 40. | West Concord | 0.73% | 0.40%(+0.326)#171 | 0.25%(+0.480)#3,395 |
| 41. | Westborough | 0.71% | 0.40%(+0.304)#172 | 0.25%(+0.459)#3,396 |
| 42. | Harwich Center | 0.70% | 0.40%(+0.302)#173 | 0.25%(+0.457)#3,397 |
| 43. | South Duxbury | 0.70% | 0.40%(+0.301)#174 | 0.25%(+0.456)#3,398 |
| 44. | Gloucester | 0.68% | 0.40%(+0.274)#175 | 0.25%(+0.429)#3,399 |
| 45. | Belmont | 0.67% | 0.40%(+0.267)#176 | 0.25%(+0.422)#3,400 |
| 46. | Burlington | 0.66% | 0.40%(+0.262)#177 | 0.25%(+0.417)#3,401 |
| 47. | Milford | 0.66% | 0.40%(+0.261)#178 | 0.25%(+0.416)#3,402 |
| 48. | Fitchburg | 0.66% | 0.40%(+0.253)#179 | 0.25%(+0.408)#3,403 |
| 49. | East Harwich | 0.65% | 0.40%(+0.247)#180 | 0.25%(+0.402)#3,404 |
| 50. | Swampscott | 0.61% | 0.40%(+0.212)#181 | 0.25%(+0.367)#3,405 |
| 51. | Raynham Center | 0.61% | 0.40%(+0.208)#182 | 0.25%(+0.363)#3,406 |
| 52. | Chatham | 0.61% | 0.40%(+0.208)#183 | 0.25%(+0.363)#3,407 |
| 53. | Hatfield | 0.60% | 0.40%(+0.198)#184 | 0.25%(+0.353)#3,408 |
| 54. | Rockport | 0.57% | 0.40%(+0.163)#185 | 0.25%(+0.318)#3,409 |
| 55. | Beverly | 0.56% | 0.40%(+0.158)#186 | 0.25%(+0.313)#3,410 |
| 56. | Watertown Town | 0.56% | 0.40%(+0.154)#187 | 0.25%(+0.309)#3,411 |
| 57. | Saugus | 0.55% | 0.40%(+0.150)#188 | 0.25%(+0.305)#3,412 |
| 58. | Newburyport | 0.55% | 0.40%(+0.147)#189 | 0.25%(+0.302)#3,413 |
| 59. | Northwest Harwich | 0.54% | 0.40%(+0.137)#190 | 0.25%(+0.292)#3,414 |
| 60. | Upton | 0.54% | 0.40%(+0.136)#191 | 0.25%(+0.291)#3,415 |
| 61. | Littleton Common | 0.52% | 0.40%(+0.119)#192 | 0.25%(+0.274)#3,416 |
| 62. | Maynard | 0.52% | 0.40%(+0.112)#193 | 0.25%(+0.267)#3,417 |
| 63. | Falmouth | 0.52% | 0.40%(+0.112)#194 | 0.25%(+0.267)#3,418 |
| 64. | Franklin Town | 0.51% | 0.40%(+0.109)#195 | 0.25%(+0.264)#3,419 |
| 65. | Sandwich | 0.51% | 0.40%(+0.106)#196 | 0.25%(+0.261)#3,420 |
| 66. | Braintree Town | 0.51% | 0.40%(+0.105)#197 | 0.25%(+0.260)#3,421 |
| 67. | Framingham | 0.50% | 0.40%(+0.100)#198 | 0.25%(+0.255)#3,422 |
| 68. | North Lakeville | 0.50% | 0.40%(+0.092)#199 | 0.25%(+0.247)#3,423 |
| 69. | Needham | 0.49% | 0.40%(+0.091)#200 | 0.25%(+0.246)#3,424 |
| 70. | Orleans | 0.48% | 0.40%(+0.077)#201 | 0.25%(+0.232)#3,425 |
| 71. | Cochituate | 0.48% | 0.40%(+0.073)#202 | 0.25%(+0.228)#3,426 |
| 72. | Holyoke | 0.47% | 0.40%(+0.068)#203 | 0.25%(+0.223)#3,427 |
| 73. | Ocean Bluff Brant Rock | 0.45% | 0.40%(+0.050)#204 | 0.25%(+0.205)#3,428 |
| 74. | Yarmouth Port | 0.44% | 0.40%(+0.032)#205 | 0.25%(+0.187)#3,429 |
| 75. | Medford | 0.43% | 0.40%(+0.029)#206 | 0.25%(+0.184)#3,430 |
| 76. | Attleboro | 0.43% | 0.40%(+0.026)#207 | 0.25%(+0.181)#3,431 |
| 77. | Haverhill | 0.43% | 0.40%(+0.022)#208 | 0.25%(+0.177)#3,432 |
| 78. | Winchester | 0.40% | 0.40%(+0.000)#209 | 0.25%(+0.155)#3,433 |
| 79. | Reading | 0.39% | 0.40%(-0.010)#210 | 0.25%(+0.145)#3,434 |
| 80. | Marblehead | 0.39% | 0.40%(-0.010)#211 | 0.25%(+0.145)#3,435 |
| 81. | Boston | 0.39% | 0.40%(-0.015)#212 | 0.25%(+0.140)#3,436 |
| 82. | Danvers | 0.38% | 0.40%(-0.023)#213 | 0.25%(+0.132)#3,437 |
| 83. | Hopkinton | 0.36% | 0.40%(-0.039)#214 | 0.25%(+0.116)#3,438 |
| 84. | Dennis Port | 0.36% | 0.40%(-0.040)#215 | 0.25%(+0.115)#3,439 |
| 85. | Marlborough | 0.36% | 0.40%(-0.041)#216 | 0.25%(+0.114)#3,440 |
| 86. | Winchendon | 0.36% | 0.40%(-0.045)#217 | 0.25%(+0.110)#3,441 |
| 87. | North Scituate | 0.35% | 0.40%(-0.051)#218 | 0.25%(+0.104)#3,442 |
| 88. | Orange | 0.35% | 0.40%(-0.055)#219 | 0.25%(+0.100)#3,443 |
| 89. | West Springfield Town | 0.34% | 0.40%(-0.059)#220 | 0.25%(+0.096)#3,444 |
| 90. | Barnstable Town | 0.33% | 0.40%(-0.070)#221 | 0.25%(+0.085)#3,445 |
| 91. | Mansfield Center | 0.33% | 0.40%(-0.078)#222 | 0.25%(+0.077)#3,446 |
| 92. | Stoneham | 0.32% | 0.40%(-0.081)#223 | 0.25%(+0.074)#3,447 |
| 93. | Amherst | 0.32% | 0.40%(-0.083)#224 | 0.25%(+0.072)#3,448 |
| 94. | Provincetown | 0.32% | 0.40%(-0.083)#225 | 0.25%(+0.072)#3,449 |
| 95. | Melrose | 0.31% | 0.40%(-0.091)#226 | 0.25%(+0.064)#3,450 |
| 96. | Ayer | 0.30% | 0.40%(-0.100)#227 | 0.25%(+0.055)#3,451 |
| 97. | Sagamore | 0.30% | 0.40%(-0.101)#228 | 0.25%(+0.054)#3,452 |
| 98. | Pittsfield | 0.30% | 0.40%(-0.101)#229 | 0.25%(+0.054)#3,453 |
| 99. | Plymouth | 0.30% | 0.40%(-0.102)#230 | 0.25%(+0.052)#3,454 |
| 100. | Dedham | 0.29% | 0.40%(-0.109)#231 | 0.25%(+0.046)#3,455 |
Common Questions
What are the Top 10 Cities with the Highest Percentage of Immigrants from Canada in Massachusetts?
Top 10 Cities with the Highest Percentage of Immigrants from Canada in Massachusetts are:
#1
4.73%
#2
4.50%
#3
3.62%
#4
3.38%
#5
3.05%
#6
2.45%
#7
1.90%
#8
1.90%
#9
1.83%
#10
1.80%
What city has the Highest Percentage of Immigrants from Canada in Massachusetts?
Deerfield has the Highest Percentage of Immigrants from Canada in Massachusetts with 4.73%.
What is the Percentage of Immigrants from Canada in the State of Massachusetts?
Percentage of Immigrants from Canada in Massachusetts is 0.40%.
What is the Percentage of Immigrants from Canada in the United States?
Percentage of Immigrants from Canada in the United States is 0.25%.