Cities with the Highest Percentage of Population Employed in Construction & Extraction in Massachusetts
RELATED REPORTS & OPTIONS
Construction & Extraction
Massachusetts
Compare Cities
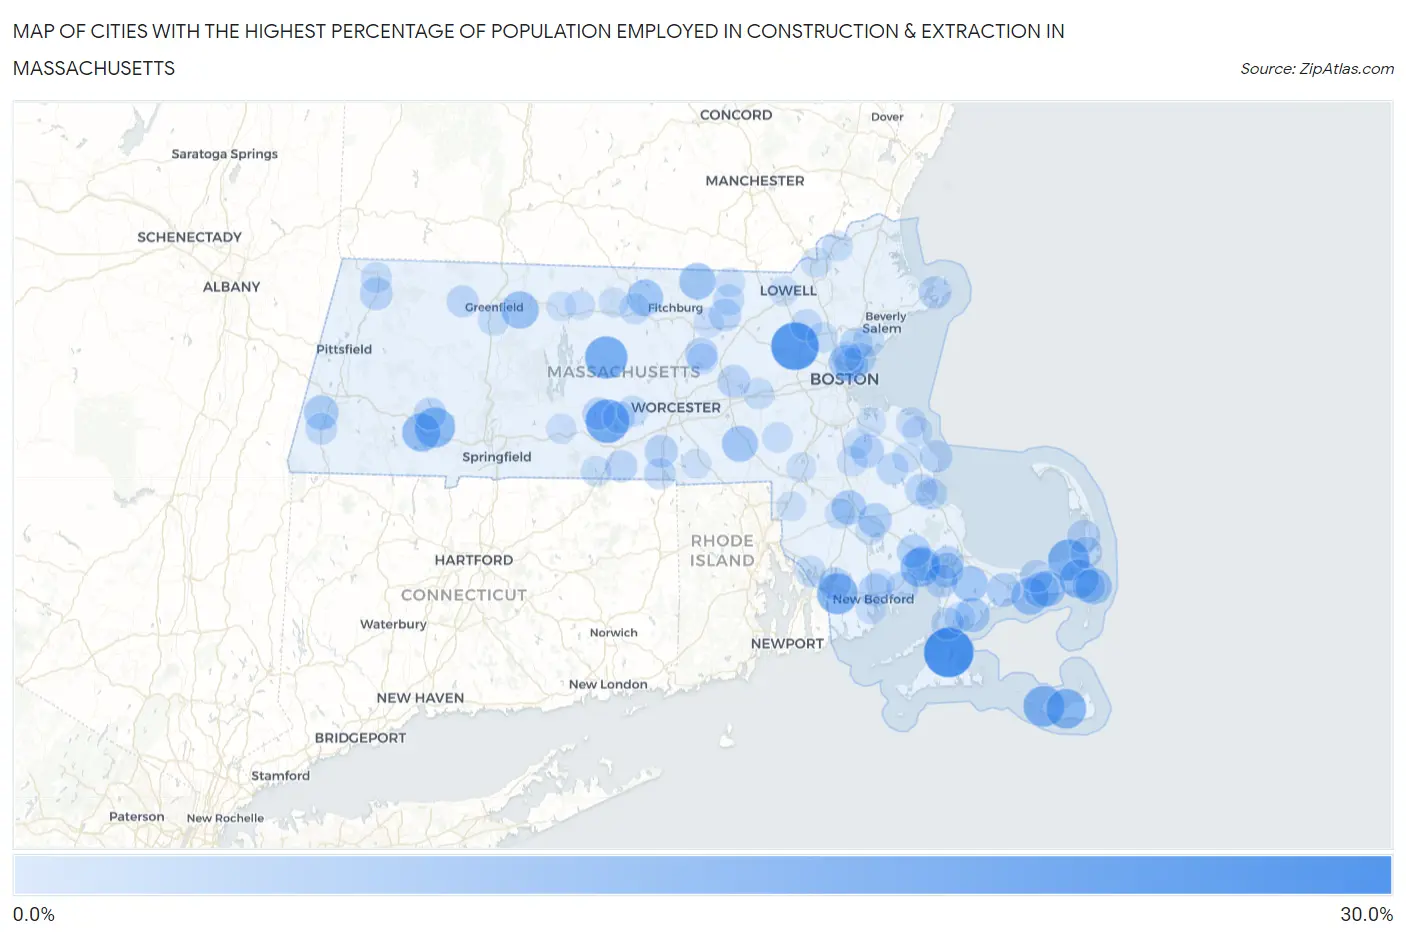
Map of Cities with the Highest Percentage of Population Employed in Construction & Extraction in Massachusetts
0.0%
30.0%
Cities with the Highest Percentage of Population Employed in Construction & Extraction in Massachusetts
| City | % Employed | vs State | vs National | |
| 1. | Vineyard Haven | 26.4% | 4.4%(+22.1)#1 | 5.0%(+21.4)#754 |
| 2. | Hanscom Afb | 24.2% | 4.4%(+19.9)#2 | 5.0%(+19.2)#898 |
| 3. | Brookfield | 19.8% | 4.4%(+15.4)#3 | 5.0%(+14.8)#1,405 |
| 4. | Barre | 18.5% | 4.4%(+14.1)#4 | 5.0%(+13.5)#1,626 |
| 5. | Brewster | 17.3% | 4.4%(+13.0)#5 | 5.0%(+12.3)#1,883 |
| 6. | North Westport | 16.8% | 4.4%(+12.4)#6 | 5.0%(+11.8)#2,008 |
| 7. | Madaket | 16.7% | 4.4%(+12.3)#7 | 5.0%(+11.7)#2,042 |
| 8. | Russell | 15.9% | 4.4%(+11.5)#8 | 5.0%(+10.9)#2,271 |
| 9. | Nantucket | 15.8% | 4.4%(+11.5)#9 | 5.0%(+10.8)#2,296 |
| 10. | East Harwich | 14.7% | 4.4%(+10.4)#10 | 5.0%(+9.76)#2,652 |
| 11. | Weweantic | 14.6% | 4.4%(+10.2)#11 | 5.0%(+9.57)#2,721 |
| 12. | Blandford | 14.0% | 4.4%(+9.69)#12 | 5.0%(+9.05)#2,904 |
| 13. | Millers Falls | 13.1% | 4.4%(+8.70)#13 | 5.0%(+8.07)#3,355 |
| 14. | West Yarmouth | 12.8% | 4.4%(+8.46)#14 | 5.0%(+7.83)#3,475 |
| 15. | Oak Bluffs | 12.5% | 4.4%(+8.16)#15 | 5.0%(+7.53)#3,610 |
| 16. | Townsend | 12.0% | 4.4%(+7.60)#16 | 5.0%(+6.97)#3,949 |
| 17. | Chatham | 11.7% | 4.4%(+7.37)#17 | 5.0%(+6.73)#4,121 |
| 18. | South Ashburnham | 11.7% | 4.4%(+7.31)#18 | 5.0%(+6.67)#4,163 |
| 19. | Milford | 11.4% | 4.4%(+7.09)#19 | 5.0%(+6.45)#4,302 |
| 20. | South Yarmouth | 11.3% | 4.4%(+6.98)#20 | 5.0%(+6.34)#4,387 |
| 21. | Forestdale | 11.2% | 4.4%(+6.85)#21 | 5.0%(+6.22)#4,482 |
| 22. | West Dennis | 11.1% | 4.4%(+6.77)#22 | 5.0%(+6.13)#4,553 |
| 23. | Wareham Center | 10.3% | 4.4%(+5.98)#23 | 5.0%(+5.35)#5,229 |
| 24. | Everett | 10.3% | 4.4%(+5.94)#24 | 5.0%(+5.30)#5,273 |
| 25. | Seabrook | 10.1% | 4.4%(+5.75)#25 | 5.0%(+5.12)#5,435 |
| 26. | Raynham Center | 10.1% | 4.4%(+5.72)#26 | 5.0%(+5.08)#5,468 |
| 27. | Housatonic | 10.0% | 4.4%(+5.67)#27 | 5.0%(+5.03)#5,516 |
| 28. | Bourne | 9.9% | 4.4%(+5.52)#28 | 5.0%(+4.88)#5,688 |
| 29. | Chelsea | 9.4% | 4.4%(+5.07)#29 | 5.0%(+4.44)#6,138 |
| 30. | Barnstable Town | 9.3% | 4.4%(+4.92)#30 | 5.0%(+4.29)#6,315 |
| 31. | West Wareham | 9.1% | 4.4%(+4.75)#31 | 5.0%(+4.11)#6,500 |
| 32. | Middleborough Center | 9.1% | 4.4%(+4.71)#32 | 5.0%(+4.07)#6,575 |
| 33. | Abington | 8.5% | 4.4%(+4.12)#33 | 5.0%(+3.49)#7,345 |
| 34. | Cedar Crest | 8.5% | 4.4%(+4.11)#34 | 5.0%(+3.47)#7,367 |
| 35. | North Eastham | 8.5% | 4.4%(+4.09)#35 | 5.0%(+3.46)#7,379 |
| 36. | Oxford | 8.3% | 4.4%(+3.96)#36 | 5.0%(+3.32)#7,584 |
| 37. | Pocasset | 8.3% | 4.4%(+3.93)#37 | 5.0%(+3.29)#7,616 |
| 38. | New Bedford | 8.2% | 4.4%(+3.89)#38 | 5.0%(+3.25)#7,683 |
| 39. | West Chatham | 8.2% | 4.4%(+3.84)#39 | 5.0%(+3.21)#7,753 |
| 40. | Buzzards Bay | 8.2% | 4.4%(+3.84)#40 | 5.0%(+3.20)#7,769 |
| 41. | Fall River | 8.2% | 4.4%(+3.81)#41 | 5.0%(+3.18)#7,801 |
| 42. | Yarmouth Port | 8.2% | 4.4%(+3.80)#42 | 5.0%(+3.17)#7,823 |
| 43. | Adams | 8.1% | 4.4%(+3.72)#43 | 5.0%(+3.08)#7,939 |
| 44. | Marlborough | 8.0% | 4.4%(+3.66)#44 | 5.0%(+3.02)#8,022 |
| 45. | South Lancaster | 8.0% | 4.4%(+3.60)#45 | 5.0%(+2.96)#8,121 |
| 46. | West Brookfield | 7.9% | 4.4%(+3.58)#46 | 5.0%(+2.95)#8,148 |
| 47. | Gloucester | 7.9% | 4.4%(+3.54)#47 | 5.0%(+2.91)#8,213 |
| 48. | Ocean Bluff Brant Rock | 7.8% | 4.4%(+3.49)#48 | 5.0%(+2.86)#8,298 |
| 49. | Falmouth | 7.8% | 4.4%(+3.48)#49 | 5.0%(+2.84)#8,326 |
| 50. | Ayer | 7.8% | 4.4%(+3.44)#50 | 5.0%(+2.80)#8,399 |
| 51. | Kingston | 7.7% | 4.4%(+3.39)#51 | 5.0%(+2.75)#8,481 |
| 52. | Saugus | 7.7% | 4.4%(+3.39)#52 | 5.0%(+2.75)#8,482 |
| 53. | Huntington | 7.7% | 4.4%(+3.33)#53 | 5.0%(+2.70)#8,542 |
| 54. | Mattapoisett Center | 7.5% | 4.4%(+3.12)#54 | 5.0%(+2.48)#8,916 |
| 55. | Southbridge Town | 7.5% | 4.4%(+3.10)#55 | 5.0%(+2.46)#8,962 |
| 56. | East Brookfield | 7.4% | 4.4%(+3.07)#56 | 5.0%(+2.44)#9,001 |
| 57. | Orleans | 7.3% | 4.4%(+2.94)#57 | 5.0%(+2.31)#9,235 |
| 58. | Shelburne Falls | 7.2% | 4.4%(+2.83)#58 | 5.0%(+2.19)#9,410 |
| 59. | Revere | 7.2% | 4.4%(+2.80)#59 | 5.0%(+2.17)#9,448 |
| 60. | North Plymouth | 7.1% | 4.4%(+2.74)#60 | 5.0%(+2.10)#9,589 |
| 61. | Great Barrington | 7.1% | 4.4%(+2.73)#61 | 5.0%(+2.10)#9,599 |
| 62. | Hanson | 7.1% | 4.4%(+2.73)#62 | 5.0%(+2.09)#9,615 |
| 63. | Pinehurst | 6.8% | 4.4%(+2.46)#63 | 5.0%(+1.82)#10,115 |
| 64. | Webster | 6.8% | 4.4%(+2.45)#64 | 5.0%(+1.81)#10,125 |
| 65. | Groton | 6.7% | 4.4%(+2.35)#65 | 5.0%(+1.72)#10,308 |
| 66. | Ocean Grove | 6.7% | 4.4%(+2.30)#66 | 5.0%(+1.66)#10,433 |
| 67. | Deerfield | 6.6% | 4.4%(+2.26)#67 | 5.0%(+1.63)#10,492 |
| 68. | Spencer | 6.4% | 4.4%(+2.09)#68 | 5.0%(+1.45)#10,876 |
| 69. | Gardner | 6.4% | 4.4%(+2.06)#69 | 5.0%(+1.43)#10,929 |
| 70. | Clinton | 6.4% | 4.4%(+2.04)#70 | 5.0%(+1.40)#10,978 |
| 71. | North Adams | 6.3% | 4.4%(+1.99)#71 | 5.0%(+1.35)#11,087 |
| 72. | Framingham | 6.3% | 4.4%(+1.98)#72 | 5.0%(+1.34)#11,113 |
| 73. | Lynn | 6.3% | 4.4%(+1.95)#73 | 5.0%(+1.31)#11,166 |
| 74. | Woburn | 6.2% | 4.4%(+1.80)#74 | 5.0%(+1.17)#11,502 |
| 75. | East Falmouth | 6.1% | 4.4%(+1.69)#75 | 5.0%(+1.06)#11,745 |
| 76. | North Scituate | 6.0% | 4.4%(+1.67)#76 | 5.0%(+1.03)#11,808 |
| 77. | Brockton | 6.0% | 4.4%(+1.66)#77 | 5.0%(+1.02)#11,830 |
| 78. | Bliss Corner | 5.9% | 4.4%(+1.56)#78 | 5.0%(+0.927)#12,042 |
| 79. | Holland | 5.9% | 4.4%(+1.55)#79 | 5.0%(+0.919)#12,064 |
| 80. | Taunton | 5.9% | 4.4%(+1.54)#80 | 5.0%(+0.906)#12,091 |
| 81. | Haverhill | 5.8% | 4.4%(+1.48)#81 | 5.0%(+0.848)#12,248 |
| 82. | Malden | 5.8% | 4.4%(+1.47)#82 | 5.0%(+0.832)#12,278 |
| 83. | Methuen Town | 5.8% | 4.4%(+1.41)#83 | 5.0%(+0.769)#12,436 |
| 84. | Millis Clicquot | 5.7% | 4.4%(+1.32)#84 | 5.0%(+0.688)#12,617 |
| 85. | Shirley | 5.6% | 4.4%(+1.27)#85 | 5.0%(+0.636)#12,766 |
| 86. | North Pembroke | 5.6% | 4.4%(+1.26)#86 | 5.0%(+0.623)#12,799 |
| 87. | Palmer Town | 5.5% | 4.4%(+1.14)#87 | 5.0%(+0.504)#13,064 |
| 88. | Scituate | 5.5% | 4.4%(+1.12)#88 | 5.0%(+0.480)#13,126 |
| 89. | Holbrook | 5.4% | 4.4%(+1.05)#89 | 5.0%(+0.409)#13,316 |
| 90. | Baldwinville | 5.4% | 4.4%(+1.02)#90 | 5.0%(+0.381)#13,384 |
| 91. | Athol | 5.3% | 4.4%(+0.973)#91 | 5.0%(+0.337)#13,479 |
| 92. | Foxborough | 5.3% | 4.4%(+0.969)#92 | 5.0%(+0.333)#13,491 |
| 93. | Acushnet Center | 5.3% | 4.4%(+0.946)#93 | 5.0%(+0.309)#13,550 |
| 94. | Lowell | 5.3% | 4.4%(+0.943)#94 | 5.0%(+0.307)#13,561 |
| 95. | Attleboro | 5.3% | 4.4%(+0.919)#95 | 5.0%(+0.283)#13,616 |
| 96. | East Pepperell | 5.2% | 4.4%(+0.847)#96 | 5.0%(+0.210)#13,779 |
| 97. | Weymouth Town | 5.2% | 4.4%(+0.846)#97 | 5.0%(+0.209)#13,784 |
| 98. | North Lakeville | 5.2% | 4.4%(+0.838)#98 | 5.0%(+0.202)#13,807 |
| 99. | East Douglas | 5.2% | 4.4%(+0.803)#99 | 5.0%(+0.167)#13,893 |
| 100. | Orange | 5.2% | 4.4%(+0.793)#100 | 5.0%(+0.157)#13,914 |
Common Questions
What are the Top 10 Cities with the Highest Percentage of Population Employed in Construction & Extraction in Massachusetts?
Top 10 Cities with the Highest Percentage of Population Employed in Construction & Extraction in Massachusetts are:
#1
26.4%
#2
24.2%
#3
19.8%
#4
18.5%
#5
17.3%
#6
16.8%
#7
16.7%
#8
15.9%
#9
15.8%
#10
14.7%
What city has the Highest Percentage of Population Employed in Construction & Extraction in Massachusetts?
Vineyard Haven has the Highest Percentage of Population Employed in Construction & Extraction in Massachusetts with 26.4%.
What is the Percentage of Population Employed in Construction & Extraction in the State of Massachusetts?
Percentage of Population Employed in Construction & Extraction in Massachusetts is 4.4%.
What is the Percentage of Population Employed in Construction & Extraction in the United States?
Percentage of Population Employed in Construction & Extraction in the United States is 5.0%.