Cities with the Highest Child Poverty Level Among Boys Under the Age of 16 in Massachusetts
RELATED REPORTS & OPTIONS
Highest Poverty | Boys 0-16
Massachusetts
Compare Cities
Map of Cities with the Highest Child Poverty Level Among Boys Under the Age of 16 in Massachusetts
0.0%
100.0%
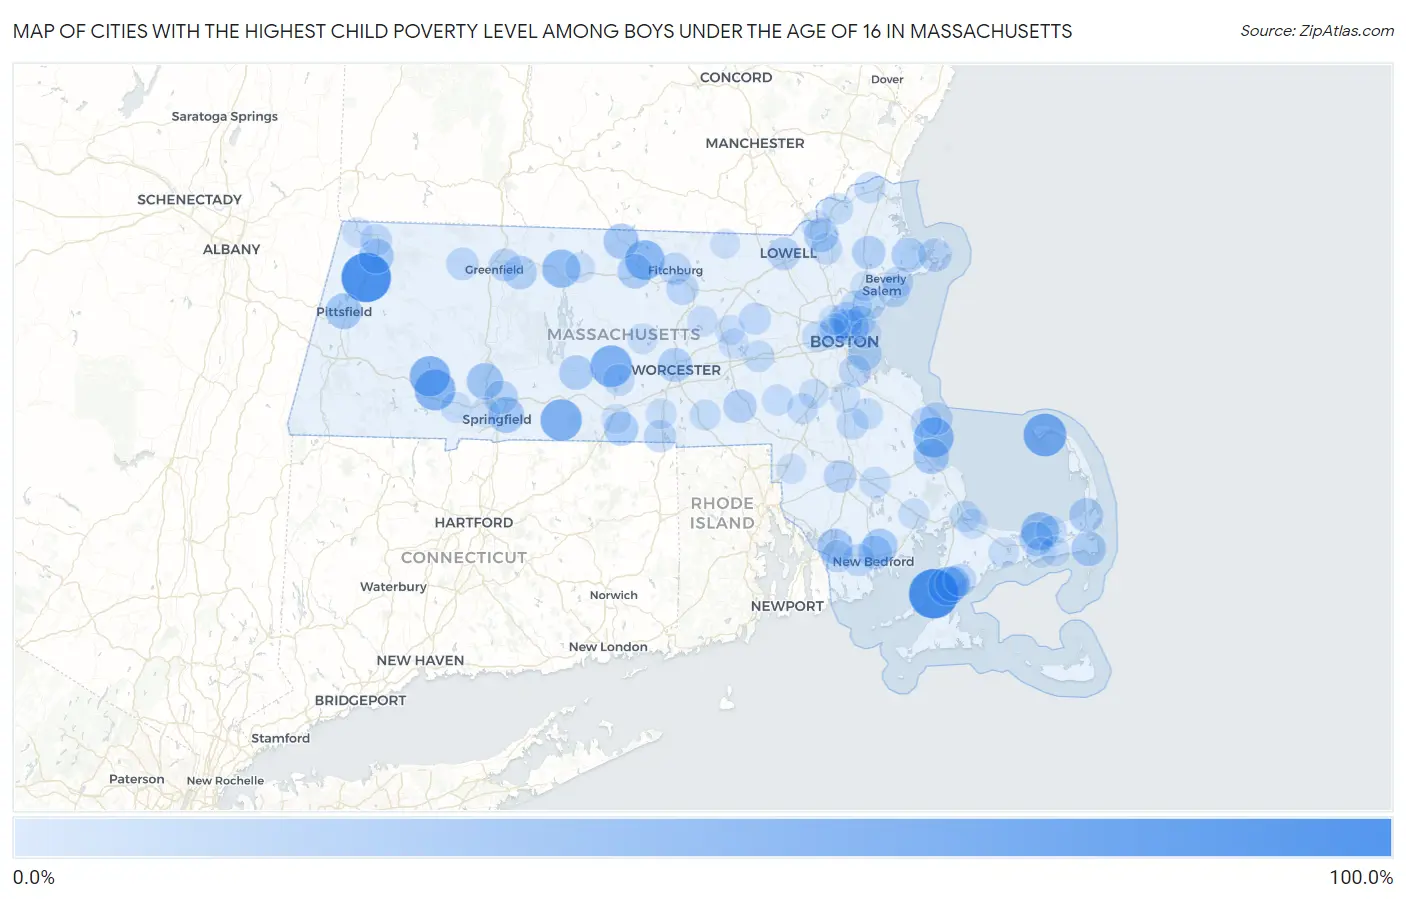
Cities with the Highest Child Poverty Level Among Boys Under the Age of 16 in Massachusetts
| City | Child Poverty (Boys) | vs State | vs National | |
| 1. | Woods Hole | 100.0% | 12.1%(+87.9)#1 | 16.9%(+83.1)#70 |
| 2. | Cheshire | 100.0% | 12.1%(+87.9)#2 | 16.9%(+83.1)#148 |
| 3. | Provincetown | 67.6% | 12.1%(+55.5)#3 | 16.9%(+50.7)#1,533 |
| 4. | North Brookfield | 61.8% | 12.1%(+49.7)#4 | 16.9%(+44.9)#1,878 |
| 5. | Monson Center | 60.7% | 12.1%(+48.5)#5 | 16.9%(+43.8)#1,953 |
| 6. | Russell | 57.1% | 12.1%(+45.0)#6 | 16.9%(+40.2)#2,223 |
| 7. | Huntington | 56.2% | 12.1%(+44.1)#7 | 16.9%(+39.3)#2,308 |
| 8. | Duxbury | 53.6% | 12.1%(+41.5)#8 | 16.9%(+36.7)#2,530 |
| 9. | South Ashburnham | 51.6% | 12.1%(+39.5)#9 | 16.9%(+34.7)#2,720 |
| 10. | Falmouth | 47.7% | 12.1%(+35.6)#10 | 16.9%(+30.8)#3,212 |
| 11. | Orange | 45.3% | 12.1%(+33.2)#11 | 16.9%(+28.4)#3,516 |
| 12. | Dennis | 43.3% | 12.1%(+31.2)#12 | 16.9%(+26.4)#3,800 |
| 13. | Holyoke | 36.6% | 12.1%(+24.5)#13 | 16.9%(+19.7)#4,927 |
| 14. | Springfield | 33.9% | 12.1%(+21.8)#14 | 16.9%(+17.0)#5,526 |
| 15. | Pittsfield | 33.3% | 12.1%(+21.1)#15 | 16.9%(+16.3)#5,764 |
| 16. | North Plymouth | 32.4% | 12.1%(+20.3)#16 | 16.9%(+15.5)#5,929 |
| 17. | Chelsea | 31.9% | 12.1%(+19.8)#17 | 16.9%(+15.0)#6,075 |
| 18. | Fall River | 31.4% | 12.1%(+19.3)#18 | 16.9%(+14.5)#6,192 |
| 19. | Winchendon | 31.3% | 12.1%(+19.2)#19 | 16.9%(+14.4)#6,218 |
| 20. | Acushnet Center | 30.5% | 12.1%(+18.4)#20 | 16.9%(+13.6)#6,444 |
| 21. | Adams | 30.2% | 12.1%(+18.1)#21 | 16.9%(+13.3)#6,519 |
| 22. | Teaticket | 28.9% | 12.1%(+16.8)#22 | 16.9%(+12.0)#6,841 |
| 23. | Gardner | 28.7% | 12.1%(+16.6)#23 | 16.9%(+11.8)#6,881 |
| 24. | West Chatham | 28.1% | 12.1%(+16.0)#24 | 16.9%(+11.2)#7,064 |
| 25. | Essex | 27.2% | 12.1%(+15.1)#25 | 16.9%(+10.3)#7,367 |
| 26. | Ware | 27.2% | 12.1%(+15.1)#26 | 16.9%(+10.3)#7,372 |
| 27. | Southbridge Town | 27.0% | 12.1%(+14.9)#27 | 16.9%(+10.1)#7,410 |
| 28. | Lawrence | 26.5% | 12.1%(+14.3)#28 | 16.9%(+9.56)#7,598 |
| 29. | Worcester | 26.3% | 12.1%(+14.1)#29 | 16.9%(+9.35)#7,670 |
| 30. | Yarmouth Port | 25.4% | 12.1%(+13.3)#30 | 16.9%(+8.51)#7,927 |
| 31. | Orleans | 25.0% | 12.1%(+12.9)#31 | 16.9%(+8.10)#8,037 |
| 32. | New Bedford | 24.5% | 12.1%(+12.4)#32 | 16.9%(+7.58)#8,277 |
| 33. | Millers Falls | 23.5% | 12.1%(+11.3)#33 | 16.9%(+6.57)#8,622 |
| 34. | Chicopee | 23.2% | 12.1%(+11.1)#34 | 16.9%(+6.33)#8,695 |
| 35. | Milford | 22.9% | 12.1%(+10.8)#35 | 16.9%(+6.00)#8,805 |
| 36. | Boston | 22.6% | 12.1%(+10.5)#36 | 16.9%(+5.71)#8,895 |
| 37. | Malden | 22.6% | 12.1%(+10.4)#37 | 16.9%(+5.66)#8,908 |
| 38. | Topsfield | 22.3% | 12.1%(+10.2)#38 | 16.9%(+5.42)#8,989 |
| 39. | Gloucester | 21.6% | 12.1%(+9.48)#39 | 16.9%(+4.70)#9,258 |
| 40. | Lowell | 20.3% | 12.1%(+8.13)#40 | 16.9%(+3.35)#9,731 |
| 41. | Ocean Bluff Brant Rock | 19.6% | 12.1%(+7.43)#41 | 16.9%(+2.65)#10,037 |
| 42. | Everett | 19.5% | 12.1%(+7.36)#42 | 16.9%(+2.58)#10,066 |
| 43. | Turners Falls | 19.5% | 12.1%(+7.35)#43 | 16.9%(+2.57)#10,069 |
| 44. | Greenfield | 19.0% | 12.1%(+6.92)#44 | 16.9%(+2.14)#10,259 |
| 45. | Taunton | 18.9% | 12.1%(+6.80)#45 | 16.9%(+2.01)#10,297 |
| 46. | Shelburne Falls | 18.5% | 12.1%(+6.40)#46 | 16.9%(+1.61)#10,465 |
| 47. | Smith Mills | 18.1% | 12.1%(+6.02)#47 | 16.9%(+1.23)#10,662 |
| 48. | Lynn | 18.0% | 12.1%(+5.88)#48 | 16.9%(+1.10)#10,707 |
| 49. | Fitchburg | 17.6% | 12.1%(+5.50)#49 | 16.9%(+0.722)#10,856 |
| 50. | Salem | 17.6% | 12.1%(+5.46)#50 | 16.9%(+0.680)#10,872 |
| 51. | East Falmouth | 17.4% | 12.1%(+5.28)#51 | 16.9%(+0.499)#10,956 |
| 52. | Leominster | 17.3% | 12.1%(+5.21)#52 | 16.9%(+0.432)#11,002 |
| 53. | Webster | 17.0% | 12.1%(+4.83)#53 | 16.9%(+0.052)#11,152 |
| 54. | Quincy | 16.3% | 12.1%(+4.16)#54 | 16.9%(-0.624)#11,462 |
| 55. | North Westport | 16.2% | 12.1%(+4.08)#55 | 16.9%(-0.704)#11,510 |
| 56. | Maynard | 15.6% | 12.1%(+3.48)#56 | 16.9%(-1.30)#11,800 |
| 57. | North Adams | 14.7% | 12.1%(+2.55)#57 | 16.9%(-2.23)#12,215 |
| 58. | Brockton | 14.6% | 12.1%(+2.49)#58 | 16.9%(-2.30)#12,246 |
| 59. | East Brookfield | 14.6% | 12.1%(+2.44)#59 | 16.9%(-2.34)#12,271 |
| 60. | Andover | 14.5% | 12.1%(+2.37)#60 | 16.9%(-2.41)#12,307 |
| 61. | Marshfield | 14.5% | 12.1%(+2.33)#61 | 16.9%(-2.45)#12,325 |
| 62. | Beverly | 14.2% | 12.1%(+2.04)#62 | 16.9%(-2.74)#12,480 |
| 63. | Framingham | 13.4% | 12.1%(+1.28)#63 | 16.9%(-3.50)#12,847 |
| 64. | Amesbury Town | 13.2% | 12.1%(+1.05)#64 | 16.9%(-3.73)#12,966 |
| 65. | Cambridge | 13.0% | 12.1%(+0.897)#65 | 16.9%(-3.89)#13,057 |
| 66. | Haverhill | 12.9% | 12.1%(+0.792)#66 | 16.9%(-3.99)#13,092 |
| 67. | Sagamore | 12.9% | 12.1%(+0.770)#67 | 16.9%(-4.01)#13,105 |
| 68. | Saugus | 12.6% | 12.1%(+0.452)#68 | 16.9%(-4.33)#13,246 |
| 69. | Middleborough Center | 12.4% | 12.1%(+0.271)#69 | 16.9%(-4.51)#13,372 |
| 70. | East Dennis | 12.3% | 12.1%(+0.217)#70 | 16.9%(-4.57)#13,397 |
| 71. | Revere | 12.3% | 12.1%(+0.172)#71 | 16.9%(-4.61)#13,417 |
| 72. | Millis Clicquot | 12.2% | 12.1%(+0.036)#72 | 16.9%(-4.75)#13,478 |
| 73. | Westfield | 11.8% | 12.1%(-0.358)#73 | 16.9%(-5.14)#13,698 |
| 74. | Abington | 11.5% | 12.1%(-0.586)#74 | 16.9%(-5.37)#13,814 |
| 75. | Whitinsville | 11.5% | 12.1%(-0.615)#75 | 16.9%(-5.40)#13,823 |
| 76. | Watertown Town | 11.1% | 12.1%(-1.05)#76 | 16.9%(-5.83)#14,046 |
| 77. | Walpole | 11.0% | 12.1%(-1.12)#77 | 16.9%(-5.91)#14,069 |
| 78. | Somerville | 10.7% | 12.1%(-1.38)#78 | 16.9%(-6.16)#14,184 |
| 79. | West Wareham | 10.6% | 12.1%(-1.48)#79 | 16.9%(-6.27)#14,237 |
| 80. | Barnstable Town | 10.3% | 12.1%(-1.83)#80 | 16.9%(-6.62)#14,436 |
| 81. | Oxford | 10.0% | 12.1%(-2.12)#81 | 16.9%(-6.90)#14,563 |
| 82. | Clinton | 9.9% | 12.1%(-2.19)#82 | 16.9%(-6.97)#14,644 |
| 83. | Rutland | 9.6% | 12.1%(-2.50)#83 | 16.9%(-7.28)#14,796 |
| 84. | Sandwich | 9.1% | 12.1%(-3.03)#84 | 16.9%(-7.81)#15,084 |
| 85. | Marlborough | 8.8% | 12.1%(-3.28)#85 | 16.9%(-8.07)#15,235 |
| 86. | Athol | 8.8% | 12.1%(-3.37)#86 | 16.9%(-8.15)#15,287 |
| 87. | Williamstown | 8.5% | 12.1%(-3.62)#87 | 16.9%(-8.41)#15,441 |
| 88. | Winthrop Town | 8.4% | 12.1%(-3.68)#88 | 16.9%(-8.46)#15,472 |
| 89. | Methuen Town | 8.2% | 12.1%(-3.92)#89 | 16.9%(-8.70)#15,637 |
| 90. | South Yarmouth | 8.1% | 12.1%(-4.01)#90 | 16.9%(-8.79)#15,683 |
| 91. | Norwood | 8.1% | 12.1%(-4.04)#91 | 16.9%(-8.82)#15,701 |
| 92. | Hudson | 8.0% | 12.1%(-4.09)#92 | 16.9%(-8.88)#15,726 |
| 93. | Randolph Town | 7.7% | 12.1%(-4.43)#93 | 16.9%(-9.21)#15,896 |
| 94. | Sturbridge | 7.7% | 12.1%(-4.47)#94 | 16.9%(-9.25)#15,958 |
| 95. | Dennis Port | 7.5% | 12.1%(-4.62)#95 | 16.9%(-9.40)#16,030 |
| 96. | West Springfield Town | 7.5% | 12.1%(-4.66)#96 | 16.9%(-9.44)#16,050 |
| 97. | Medford | 7.3% | 12.1%(-4.80)#97 | 16.9%(-9.58)#16,126 |
| 98. | Attleboro | 7.1% | 12.1%(-4.97)#98 | 16.9%(-9.75)#16,214 |
| 99. | Pepperell | 7.1% | 12.1%(-5.02)#99 | 16.9%(-9.81)#16,263 |
| 100. | Peabody | 7.1% | 12.1%(-5.03)#100 | 16.9%(-9.81)#16,265 |
Common Questions
What are the Top 10 Cities with the Highest Child Poverty Level Among Boys Under the Age of 16 in Massachusetts?
Top 10 Cities with the Highest Child Poverty Level Among Boys Under the Age of 16 in Massachusetts are:
#1
100.0%
#2
100.0%
#3
67.6%
#4
61.8%
#5
60.7%
#6
57.1%
#7
56.2%
#8
53.6%
#9
51.6%
#10
47.7%
What city has the Highest Child Poverty Level Among Boys Under the Age of 16 in Massachusetts?
Woods Hole has the Highest Child Poverty Level Among Boys Under the Age of 16 in Massachusetts with 100.0%.
What is the Poverty Level Among Boys Under the Age of 16 in the State of Massachusetts?
Poverty Level Among Boys Under the Age of 16 in Massachusetts is 12.1%.
What is the Poverty Level Among Boys Under the Age of 16 in the United States?
Poverty Level Among Boys Under the Age of 16 in the United States is 16.9%.