Cities with the Highest Percentage of Italian Population in Massachusetts
RELATED REPORTS & OPTIONS
Italian
Massachusetts
Compare Cities
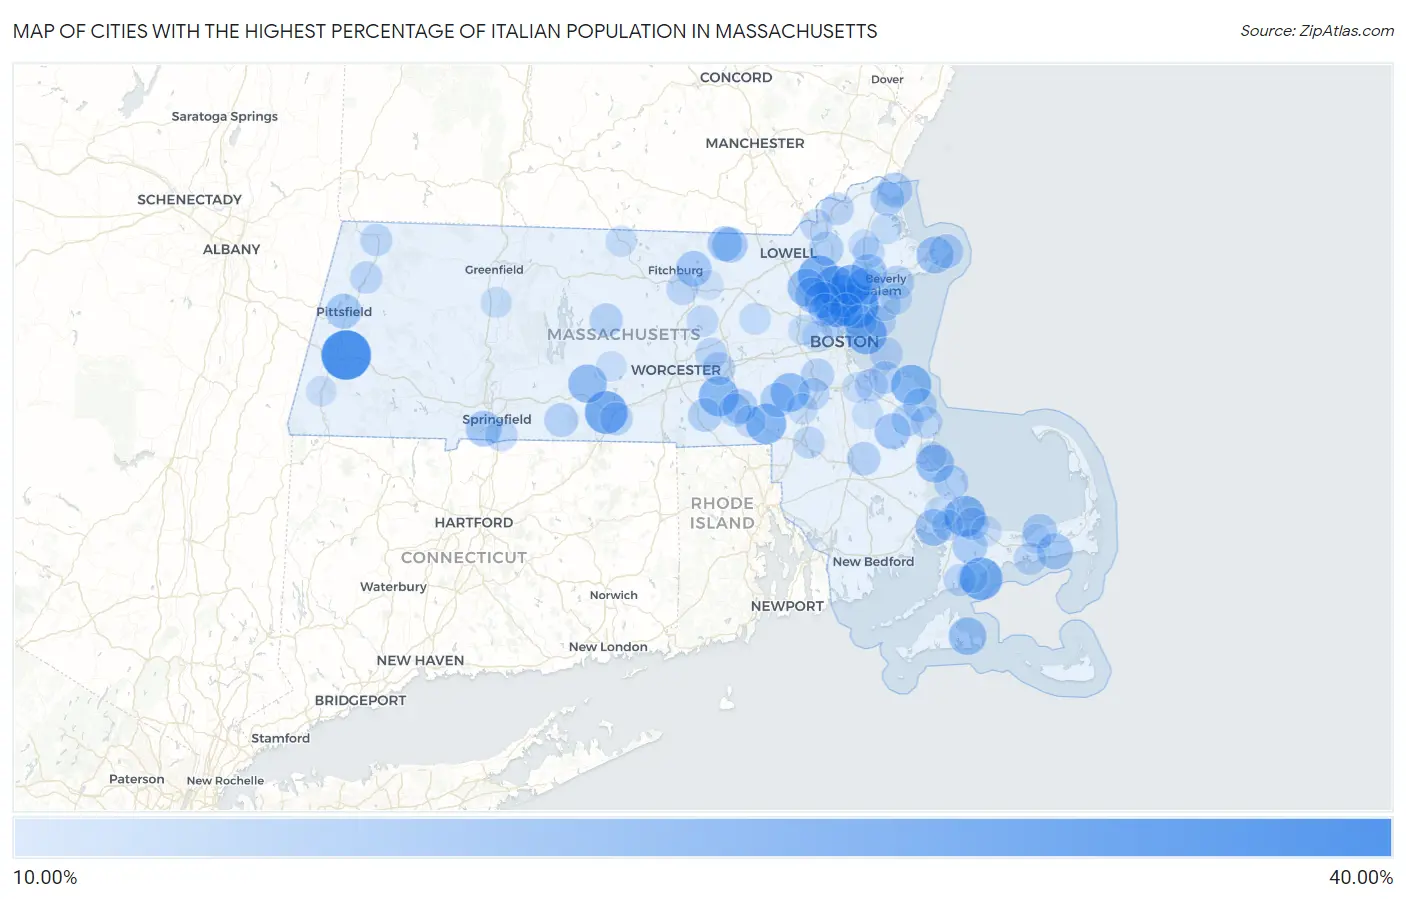
Map of Cities with the Highest Percentage of Italian Population in Massachusetts
0.00%
40.00%
Cities with the Highest Percentage of Italian Population in Massachusetts
| City | Italian | vs State | vs National | |
| 1. | Lee | 33.91% | 11.49%(+22.4)#1 | 4.93%(+29.0)#186 |
| 2. | Saugus | 27.99% | 11.49%(+16.5)#2 | 4.93%(+23.1)#400 |
| 3. | Stoneham | 27.54% | 11.49%(+16.0)#3 | 4.93%(+22.6)#431 |
| 4. | Fiskdale | 26.18% | 11.49%(+14.7)#4 | 4.93%(+21.2)#513 |
| 5. | Popponesset | 25.68% | 11.49%(+14.2)#5 | 4.93%(+20.8)#546 |
| 6. | Wakefield | 25.62% | 11.49%(+14.1)#6 | 4.93%(+20.7)#551 |
| 7. | Wilmington | 24.79% | 11.49%(+13.3)#7 | 4.93%(+19.9)#630 |
| 8. | Winthrop Town | 24.16% | 11.49%(+12.7)#8 | 4.93%(+19.2)#683 |
| 9. | Sagamore | 24.03% | 11.49%(+12.5)#9 | 4.93%(+19.1)#701 |
| 10. | Reading | 23.92% | 11.49%(+12.4)#10 | 4.93%(+19.0)#713 |
| 11. | Lynnfield | 23.68% | 11.49%(+12.2)#11 | 4.93%(+18.7)#731 |
| 12. | North Scituate | 23.35% | 11.49%(+11.9)#12 | 4.93%(+18.4)#759 |
| 13. | Franklin Town | 23.30% | 11.49%(+11.8)#13 | 4.93%(+18.4)#765 |
| 14. | Upton | 23.04% | 11.49%(+11.5)#14 | 4.93%(+18.1)#794 |
| 15. | Medfield | 21.54% | 11.49%(+10.0)#15 | 4.93%(+16.6)#937 |
| 16. | Warren | 21.34% | 11.49%(+9.85)#16 | 4.93%(+16.4)#958 |
| 17. | Plymouth | 20.75% | 11.49%(+9.26)#17 | 4.93%(+15.8)#1,043 |
| 18. | Pinehurst | 20.54% | 11.49%(+9.05)#18 | 4.93%(+15.6)#1,076 |
| 19. | Edgartown | 20.33% | 11.49%(+8.84)#19 | 4.93%(+15.4)#1,109 |
| 20. | Peabody | 20.04% | 11.49%(+8.55)#20 | 4.93%(+15.1)#1,143 |
| 21. | Cedar Crest | 19.92% | 11.49%(+8.43)#21 | 4.93%(+15.0)#1,157 |
| 22. | Gloucester | 19.60% | 11.49%(+8.11)#22 | 4.93%(+14.7)#1,199 |
| 23. | Onset | 19.31% | 11.49%(+7.81)#23 | 4.93%(+14.4)#1,247 |
| 24. | Woburn | 19.29% | 11.49%(+7.80)#24 | 4.93%(+14.4)#1,248 |
| 25. | Danvers | 19.01% | 11.49%(+7.52)#25 | 4.93%(+14.1)#1,299 |
| 26. | Hanson | 18.54% | 11.49%(+7.05)#26 | 4.93%(+13.6)#1,369 |
| 27. | Dennis Port | 18.52% | 11.49%(+7.02)#27 | 4.93%(+13.6)#1,375 |
| 28. | Agawam Town | 18.31% | 11.49%(+6.82)#28 | 4.93%(+13.4)#1,410 |
| 29. | Lunenburg | 18.10% | 11.49%(+6.61)#29 | 4.93%(+13.2)#1,436 |
| 30. | East Pepperell | 18.01% | 11.49%(+6.52)#30 | 4.93%(+13.1)#1,453 |
| 31. | Oak Bluffs | 17.88% | 11.49%(+6.39)#31 | 4.93%(+13.0)#1,475 |
| 32. | Burlington | 17.85% | 11.49%(+6.35)#32 | 4.93%(+12.9)#1,484 |
| 33. | Pittsfield | 17.68% | 11.49%(+6.18)#33 | 4.93%(+12.7)#1,515 |
| 34. | Pepperell | 17.51% | 11.49%(+6.01)#34 | 4.93%(+12.6)#1,545 |
| 35. | Medford | 17.44% | 11.49%(+5.95)#35 | 4.93%(+12.5)#1,556 |
| 36. | Forestdale | 17.28% | 11.49%(+5.79)#36 | 4.93%(+12.4)#1,587 |
| 37. | Salisbury | 17.12% | 11.49%(+5.63)#37 | 4.93%(+12.2)#1,623 |
| 38. | Milford | 17.03% | 11.49%(+5.54)#38 | 4.93%(+12.1)#1,643 |
| 39. | Millis Clicquot | 17.00% | 11.49%(+5.51)#39 | 4.93%(+12.1)#1,650 |
| 40. | Dennis | 16.97% | 11.49%(+5.47)#40 | 4.93%(+12.0)#1,656 |
| 41. | The Pinehills | 16.89% | 11.49%(+5.40)#41 | 4.93%(+12.0)#1,678 |
| 42. | Andover | 16.72% | 11.49%(+5.23)#42 | 4.93%(+11.8)#1,703 |
| 43. | Rockport | 16.53% | 11.49%(+5.04)#43 | 4.93%(+11.6)#1,750 |
| 44. | Newburyport | 16.40% | 11.49%(+4.91)#44 | 4.93%(+11.5)#1,777 |
| 45. | Monson Center | 16.32% | 11.49%(+4.83)#45 | 4.93%(+11.4)#1,793 |
| 46. | Whitinsville | 16.17% | 11.49%(+4.68)#46 | 4.93%(+11.2)#1,820 |
| 47. | Marshfield Hills | 16.15% | 11.49%(+4.66)#47 | 4.93%(+11.2)#1,826 |
| 48. | North Attleborough | 16.14% | 11.49%(+4.64)#48 | 4.93%(+11.2)#1,830 |
| 49. | Revere | 15.98% | 11.49%(+4.49)#49 | 4.93%(+11.1)#1,863 |
| 50. | Bridgewater Town | 15.94% | 11.49%(+4.45)#50 | 4.93%(+11.0)#1,872 |
| 51. | Beverly | 15.93% | 11.49%(+4.44)#51 | 4.93%(+11.0)#1,873 |
| 52. | Barre | 15.82% | 11.49%(+4.33)#52 | 4.93%(+10.9)#1,906 |
| 53. | Melrose | 15.69% | 11.49%(+4.20)#53 | 4.93%(+10.8)#1,938 |
| 54. | Dedham | 15.55% | 11.49%(+4.06)#54 | 4.93%(+10.6)#1,971 |
| 55. | Westborough | 15.52% | 11.49%(+4.03)#55 | 4.93%(+10.6)#1,976 |
| 56. | Hopedale | 15.49% | 11.49%(+4.00)#56 | 4.93%(+10.6)#1,986 |
| 57. | Sturbridge | 15.48% | 11.49%(+3.99)#57 | 4.93%(+10.6)#1,989 |
| 58. | Winchester | 15.26% | 11.49%(+3.77)#58 | 4.93%(+10.3)#2,052 |
| 59. | Hull | 15.24% | 11.49%(+3.75)#59 | 4.93%(+10.3)#2,057 |
| 60. | Sandwich | 15.13% | 11.49%(+3.64)#60 | 4.93%(+10.2)#2,073 |
| 61. | Weymouth Town | 15.12% | 11.49%(+3.63)#61 | 4.93%(+10.2)#2,076 |
| 62. | Hingham | 15.09% | 11.49%(+3.60)#62 | 4.93%(+10.2)#2,086 |
| 63. | Haverhill | 15.06% | 11.49%(+3.57)#63 | 4.93%(+10.1)#2,093 |
| 64. | North Pembroke | 14.92% | 11.49%(+3.43)#64 | 4.93%(+9.99)#2,127 |
| 65. | West Yarmouth | 14.91% | 11.49%(+3.41)#65 | 4.93%(+9.98)#2,131 |
| 66. | Longmeadow | 14.73% | 11.49%(+3.23)#66 | 4.93%(+9.80)#2,174 |
| 67. | North Adams | 14.69% | 11.49%(+3.20)#67 | 4.93%(+9.77)#2,180 |
| 68. | East Falmouth | 14.68% | 11.49%(+3.19)#68 | 4.93%(+9.76)#2,182 |
| 69. | Cheshire | 14.63% | 11.49%(+3.13)#69 | 4.93%(+9.70)#2,198 |
| 70. | Leominster | 14.62% | 11.49%(+3.13)#70 | 4.93%(+9.69)#2,201 |
| 71. | Northborough | 14.54% | 11.49%(+3.05)#71 | 4.93%(+9.61)#2,222 |
| 72. | Nahant | 14.42% | 11.49%(+2.93)#72 | 4.93%(+9.49)#2,269 |
| 73. | Methuen Town | 14.33% | 11.49%(+2.84)#73 | 4.93%(+9.40)#2,290 |
| 74. | Swampscott | 14.33% | 11.49%(+2.84)#74 | 4.93%(+9.40)#2,291 |
| 75. | Marshfield | 14.32% | 11.49%(+2.83)#75 | 4.93%(+9.39)#2,292 |
| 76. | Mansfield Center | 14.29% | 11.49%(+2.80)#76 | 4.93%(+9.36)#2,298 |
| 77. | Norwood | 14.21% | 11.49%(+2.72)#77 | 4.93%(+9.28)#2,325 |
| 78. | Bellingham | 14.06% | 11.49%(+2.57)#78 | 4.93%(+9.14)#2,357 |
| 79. | Clinton | 14.06% | 11.49%(+2.57)#79 | 4.93%(+9.13)#2,359 |
| 80. | Topsfield | 14.01% | 11.49%(+2.51)#80 | 4.93%(+9.08)#2,378 |
| 81. | Maynard | 13.79% | 11.49%(+2.30)#81 | 4.93%(+8.87)#2,434 |
| 82. | Marblehead | 13.79% | 11.49%(+2.30)#82 | 4.93%(+8.86)#2,435 |
| 83. | White Island Shores | 13.72% | 11.49%(+2.23)#83 | 4.93%(+8.79)#2,453 |
| 84. | Seabrook | 13.45% | 11.49%(+1.95)#84 | 4.93%(+8.52)#2,527 |
| 85. | Rowley | 13.40% | 11.49%(+1.91)#85 | 4.93%(+8.47)#2,544 |
| 86. | South Deerfield | 13.31% | 11.49%(+1.82)#86 | 4.93%(+8.38)#2,571 |
| 87. | Watertown Town | 13.30% | 11.49%(+1.81)#87 | 4.93%(+8.37)#2,575 |
| 88. | Buzzards Bay | 13.30% | 11.49%(+1.81)#88 | 4.93%(+8.37)#2,577 |
| 89. | Walpole | 13.27% | 11.49%(+1.78)#89 | 4.93%(+8.35)#2,584 |
| 90. | Winchendon | 13.27% | 11.49%(+1.78)#90 | 4.93%(+8.34)#2,586 |
| 91. | Waltham | 13.19% | 11.49%(+1.70)#91 | 4.93%(+8.26)#2,613 |
| 92. | Boxford | 13.12% | 11.49%(+1.63)#92 | 4.93%(+8.19)#2,630 |
| 93. | Abington | 13.08% | 11.49%(+1.59)#93 | 4.93%(+8.15)#2,640 |
| 94. | North Plymouth | 13.01% | 11.49%(+1.52)#94 | 4.93%(+8.09)#2,664 |
| 95. | East Sandwich | 12.99% | 11.49%(+1.50)#95 | 4.93%(+8.06)#2,677 |
| 96. | Braintree Town | 12.93% | 11.49%(+1.44)#96 | 4.93%(+8.00)#2,689 |
| 97. | North Brookfield | 12.84% | 11.49%(+1.35)#97 | 4.93%(+7.92)#2,717 |
| 98. | Great Barrington | 12.65% | 11.49%(+1.15)#98 | 4.93%(+7.72)#2,798 |
| 99. | Yarmouth Port | 12.26% | 11.49%(+0.768)#99 | 4.93%(+7.33)#2,931 |
| 100. | Shirley | 12.21% | 11.49%(+0.723)#100 | 4.93%(+7.29)#2,942 |
Common Questions
What are the Top 10 Cities with the Highest Percentage of Italian Population in Massachusetts?
Top 10 Cities with the Highest Percentage of Italian Population in Massachusetts are:
#1
33.91%
#2
27.99%
#3
27.54%
#4
26.18%
#5
25.68%
#6
25.62%
#7
24.79%
#8
24.16%
#9
24.03%
#10
23.92%
What city has the Highest Percentage of Italian Population in Massachusetts?
Lee has the Highest Percentage of Italian Population in Massachusetts with 33.91%.
What is the Percentage of Italian Population in the State of Massachusetts?
Percentage of Italian Population in Massachusetts is 11.49%.
What is the Percentage of Italian Population in the United States?
Percentage of Italian Population in the United States is 4.93%.