Cities with the Most Immigrants from England in Massachusetts
RELATED REPORTS & OPTIONS
England
Massachusetts
Compare Cities
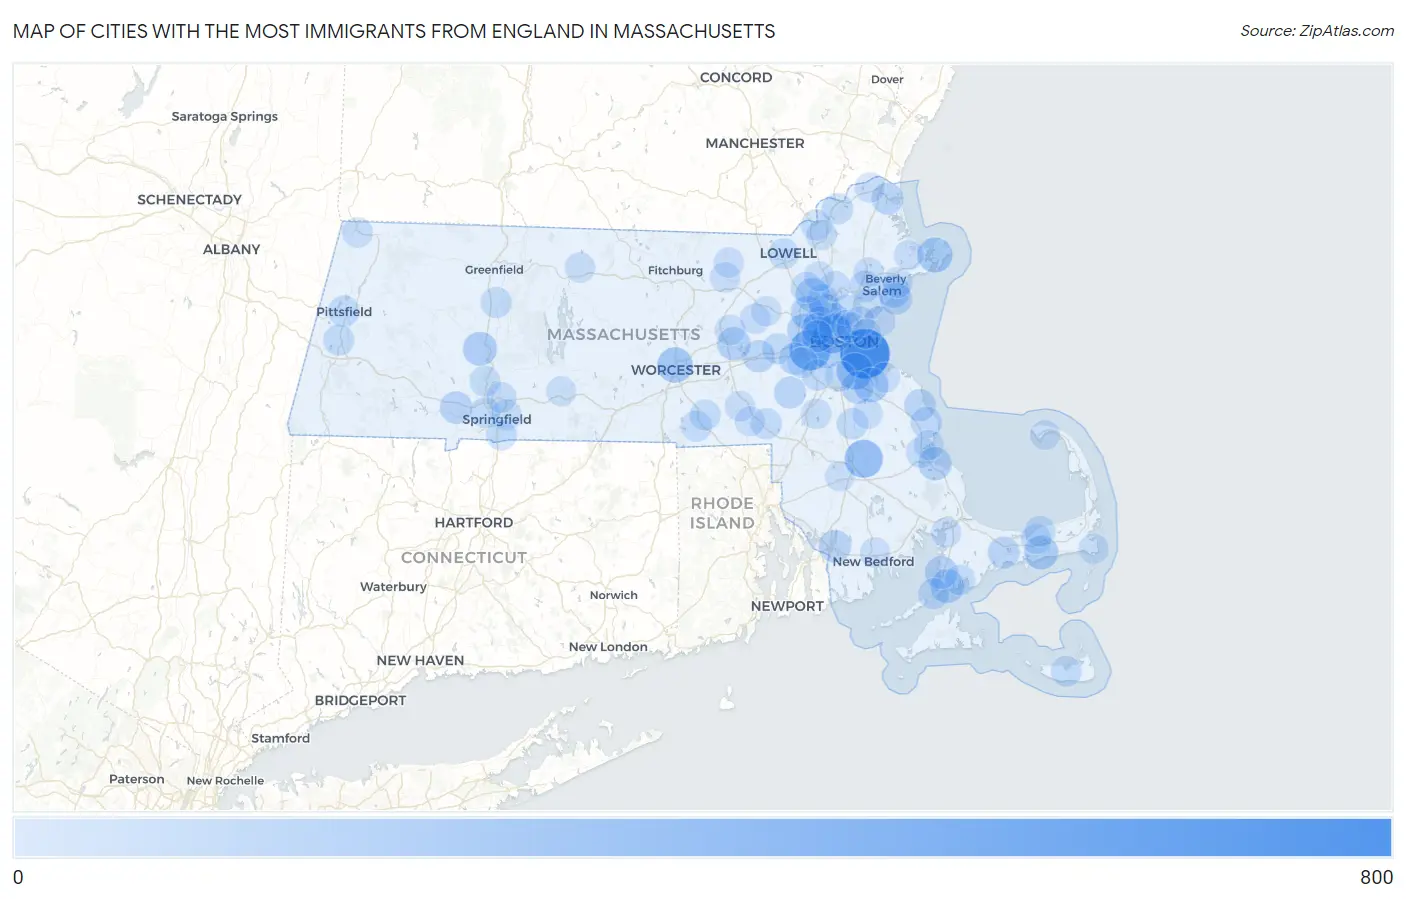
Map of Cities with the Most Immigrants from England in Massachusetts
0
800
Cities with the Most Immigrants from England in Massachusetts
| City | England | vs State | vs National | |
| 1. | Boston | 670 | 10,698(6.26%)#1 | 318,896(0.21%)#26 |
| 2. | Newton | 363 | 10,698(3.39%)#2 | 318,896(0.11%)#80 |
| 3. | Cambridge | 306 | 10,698(2.86%)#3 | 318,896(0.10%)#102 |
| 4. | Bridgewater Town | 270 | 10,698(2.52%)#4 | 318,896(0.08%)#122 |
| 5. | Quincy | 225 | 10,698(2.10%)#5 | 318,896(0.07%)#157 |
| 6. | Worcester | 187 | 10,698(1.75%)#6 | 318,896(0.06%)#208 |
| 7. | Gloucester | 171 | 10,698(1.60%)#7 | 318,896(0.05%)#240 |
| 8. | Weymouth Town | 159 | 10,698(1.49%)#8 | 318,896(0.05%)#263 |
| 9. | South Yarmouth | 140 | 10,698(1.31%)#9 | 318,896(0.04%)#310 |
| 10. | Brookline | 138 | 10,698(1.29%)#10 | 318,896(0.04%)#316 |
| 11. | Northampton | 136 | 10,698(1.27%)#11 | 318,896(0.04%)#323 |
| 12. | Burlington | 130 | 10,698(1.22%)#12 | 318,896(0.04%)#338 |
| 13. | Falmouth | 129 | 10,698(1.21%)#13 | 318,896(0.04%)#346 |
| 14. | Lexington | 116 | 10,698(1.08%)#14 | 318,896(0.04%)#416 |
| 15. | Plymouth | 116 | 10,698(1.08%)#15 | 318,896(0.04%)#421 |
| 16. | Marlborough | 110 | 10,698(1.03%)#16 | 318,896(0.03%)#440 |
| 17. | Waltham | 109 | 10,698(1.02%)#17 | 318,896(0.03%)#444 |
| 18. | Medford | 106 | 10,698(0.99%)#18 | 318,896(0.03%)#464 |
| 19. | West Falmouth | 101 | 10,698(0.94%)#19 | 318,896(0.03%)#500 |
| 20. | Salem | 96 | 10,698(0.90%)#20 | 318,896(0.03%)#527 |
| 21. | Arlington | 89 | 10,698(0.83%)#21 | 318,896(0.03%)#567 |
| 22. | Braintree Town | 86 | 10,698(0.80%)#22 | 318,896(0.03%)#591 |
| 23. | Winchester | 86 | 10,698(0.80%)#23 | 318,896(0.03%)#594 |
| 24. | Fall River | 85 | 10,698(0.79%)#24 | 318,896(0.03%)#597 |
| 25. | Westfield | 85 | 10,698(0.79%)#25 | 318,896(0.03%)#601 |
| 26. | Belmont | 82 | 10,698(0.77%)#26 | 318,896(0.03%)#619 |
| 27. | Wellesley | 81 | 10,698(0.76%)#27 | 318,896(0.03%)#633 |
| 28. | Somerville | 80 | 10,698(0.75%)#28 | 318,896(0.03%)#639 |
| 29. | Framingham | 75 | 10,698(0.70%)#29 | 318,896(0.02%)#697 |
| 30. | Marblehead | 74 | 10,698(0.69%)#30 | 318,896(0.02%)#711 |
| 31. | Medfield | 74 | 10,698(0.69%)#31 | 318,896(0.02%)#713 |
| 32. | Barnstable Town | 73 | 10,698(0.68%)#32 | 318,896(0.02%)#717 |
| 33. | Watertown Town | 66 | 10,698(0.62%)#33 | 318,896(0.02%)#795 |
| 34. | Marshfield Hills | 65 | 10,698(0.61%)#34 | 318,896(0.02%)#819 |
| 35. | Newburyport | 62 | 10,698(0.58%)#35 | 318,896(0.02%)#848 |
| 36. | Amherst | 57 | 10,698(0.53%)#36 | 318,896(0.02%)#925 |
| 37. | Woburn | 55 | 10,698(0.51%)#37 | 318,896(0.02%)#966 |
| 38. | Peabody | 54 | 10,698(0.50%)#38 | 318,896(0.02%)#984 |
| 39. | Marshfield | 54 | 10,698(0.50%)#39 | 318,896(0.02%)#993 |
| 40. | Dedham | 50 | 10,698(0.47%)#40 | 318,896(0.02%)#1,071 |
| 41. | Brockton | 48 | 10,698(0.45%)#41 | 318,896(0.02%)#1,112 |
| 42. | Pittsfield | 44 | 10,698(0.41%)#42 | 318,896(0.01%)#1,228 |
| 43. | Franklin Town | 41 | 10,698(0.38%)#43 | 318,896(0.01%)#1,304 |
| 44. | Cochituate | 41 | 10,698(0.38%)#44 | 318,896(0.01%)#1,318 |
| 45. | Lenox | 41 | 10,698(0.38%)#45 | 318,896(0.01%)#1,324 |
| 46. | South Deerfield | 41 | 10,698(0.38%)#46 | 318,896(0.01%)#1,325 |
| 47. | Haverhill | 40 | 10,698(0.37%)#47 | 318,896(0.01%)#1,329 |
| 48. | Woods Hole | 40 | 10,698(0.37%)#48 | 318,896(0.01%)#1,347 |
| 49. | Methuen Town | 39 | 10,698(0.36%)#49 | 318,896(0.01%)#1,352 |
| 50. | East Douglas | 39 | 10,698(0.36%)#50 | 318,896(0.01%)#1,373 |
| 51. | Whitinsville | 38 | 10,698(0.36%)#51 | 318,896(0.01%)#1,403 |
| 52. | Dennis | 36 | 10,698(0.34%)#52 | 318,896(0.01%)#1,462 |
| 53. | Needham | 32 | 10,698(0.30%)#53 | 318,896(0.01%)#1,598 |
| 54. | Melrose | 32 | 10,698(0.30%)#54 | 318,896(0.01%)#1,600 |
| 55. | Springfield | 31 | 10,698(0.29%)#55 | 318,896(0.01%)#1,628 |
| 56. | Lowell | 31 | 10,698(0.29%)#56 | 318,896(0.01%)#1,629 |
| 57. | Longmeadow | 31 | 10,698(0.29%)#57 | 318,896(0.01%)#1,647 |
| 58. | East Falmouth | 31 | 10,698(0.29%)#58 | 318,896(0.01%)#1,662 |
| 59. | Pinehurst | 31 | 10,698(0.29%)#59 | 318,896(0.01%)#1,663 |
| 60. | Kingston | 31 | 10,698(0.29%)#60 | 318,896(0.01%)#1,666 |
| 61. | Holyoke | 30 | 10,698(0.28%)#61 | 318,896(0.01%)#1,678 |
| 62. | West Springfield Town | 29 | 10,698(0.27%)#62 | 318,896(0.01%)#1,717 |
| 63. | Reading | 29 | 10,698(0.27%)#63 | 318,896(0.01%)#1,720 |
| 64. | Chicopee | 28 | 10,698(0.26%)#64 | 318,896(0.01%)#1,766 |
| 65. | Nantucket | 28 | 10,698(0.26%)#65 | 318,896(0.01%)#1,792 |
| 66. | Beverly | 27 | 10,698(0.25%)#66 | 318,896(0.01%)#1,810 |
| 67. | North Attleborough | 27 | 10,698(0.25%)#67 | 318,896(0.01%)#1,820 |
| 68. | Sharon | 26 | 10,698(0.24%)#68 | 318,896(0.01%)#1,889 |
| 69. | Nahant | 24 | 10,698(0.22%)#69 | 318,896(0.01%)#2,012 |
| 70. | Milton | 23 | 10,698(0.21%)#70 | 318,896(0.01%)#2,040 |
| 71. | Lawrence | 22 | 10,698(0.21%)#71 | 318,896(0.01%)#2,093 |
| 72. | Hudson | 22 | 10,698(0.21%)#72 | 318,896(0.01%)#2,117 |
| 73. | Williamstown | 22 | 10,698(0.21%)#73 | 318,896(0.01%)#2,148 |
| 74. | Lynn | 21 | 10,698(0.20%)#74 | 318,896(0.01%)#2,166 |
| 75. | Greenfield | 20 | 10,698(0.19%)#75 | 318,896(0.01%)#2,269 |
| 76. | Everett | 18 | 10,698(0.17%)#76 | 318,896(0.01%)#2,414 |
| 77. | Maynard | 18 | 10,698(0.17%)#77 | 318,896(0.01%)#2,459 |
| 78. | Athol | 18 | 10,698(0.17%)#78 | 318,896(0.01%)#2,466 |
| 79. | Ayer | 18 | 10,698(0.17%)#79 | 318,896(0.01%)#2,503 |
| 80. | Danvers | 17 | 10,698(0.16%)#80 | 318,896(0.01%)#2,539 |
| 81. | Milford | 17 | 10,698(0.16%)#81 | 318,896(0.01%)#2,540 |
| 82. | Yarmouth Port | 17 | 10,698(0.16%)#82 | 318,896(0.01%)#2,582 |
| 83. | Amesbury Town | 16 | 10,698(0.15%)#83 | 318,896(0.01%)#2,638 |
| 84. | Chatham | 16 | 10,698(0.15%)#84 | 318,896(0.01%)#2,683 |
| 85. | Groton | 16 | 10,698(0.15%)#85 | 318,896(0.01%)#2,685 |
| 86. | New Bedford | 15 | 10,698(0.14%)#86 | 318,896(0.00%)#2,695 |
| 87. | Abington | 15 | 10,698(0.14%)#87 | 318,896(0.00%)#2,736 |
| 88. | Bourne | 15 | 10,698(0.14%)#88 | 318,896(0.00%)#2,792 |
| 89. | Revere | 14 | 10,698(0.13%)#89 | 318,896(0.00%)#2,808 |
| 90. | West Concord | 13 | 10,698(0.12%)#90 | 318,896(0.00%)#2,975 |
| 91. | Chelsea | 12 | 10,698(0.11%)#91 | 318,896(0.00%)#3,035 |
| 92. | Palmer Town | 11 | 10,698(0.10%)#92 | 318,896(0.00%)#3,222 |
| 93. | Bellingham | 11 | 10,698(0.10%)#93 | 318,896(0.00%)#3,278 |
| 94. | Taunton | 10 | 10,698(0.09%)#94 | 318,896(0.00%)#3,345 |
| 95. | Wilmington | 10 | 10,698(0.09%)#95 | 318,896(0.00%)#3,366 |
| 96. | Winthrop Town | 10 | 10,698(0.09%)#96 | 318,896(0.00%)#3,372 |
| 97. | Hingham | 10 | 10,698(0.09%)#97 | 318,896(0.00%)#3,434 |
| 98. | Provincetown | 10 | 10,698(0.09%)#98 | 318,896(0.00%)#3,452 |
| 99. | South Duxbury | 10 | 10,698(0.09%)#99 | 318,896(0.00%)#3,454 |
| 100. | Essex | 10 | 10,698(0.09%)#100 | 318,896(0.00%)#3,475 |
Common Questions
What are the Top 10 Cities with the Most Immigrants from England in Massachusetts?
Top 10 Cities with the Most Immigrants from England in Massachusetts are:
#1
670
#2
363
#3
306
#4
270
#5
225
#6
187
#7
171
#8
159
#9
140
#10
138
What city has the Most Immigrants from England in Massachusetts?
Boston has the Most Immigrants from England in Massachusetts with 670.
What is the Total Immigrants from England in the State of Massachusetts?
Total Immigrants from England in Massachusetts is 10,698.
What is the Total Immigrants from England in the United States?
Total Immigrants from England in the United States is 318,896.