Cities with the Most Immigrants from Spain in Massachusetts
RELATED REPORTS & OPTIONS
Spain
Massachusetts
Compare Cities
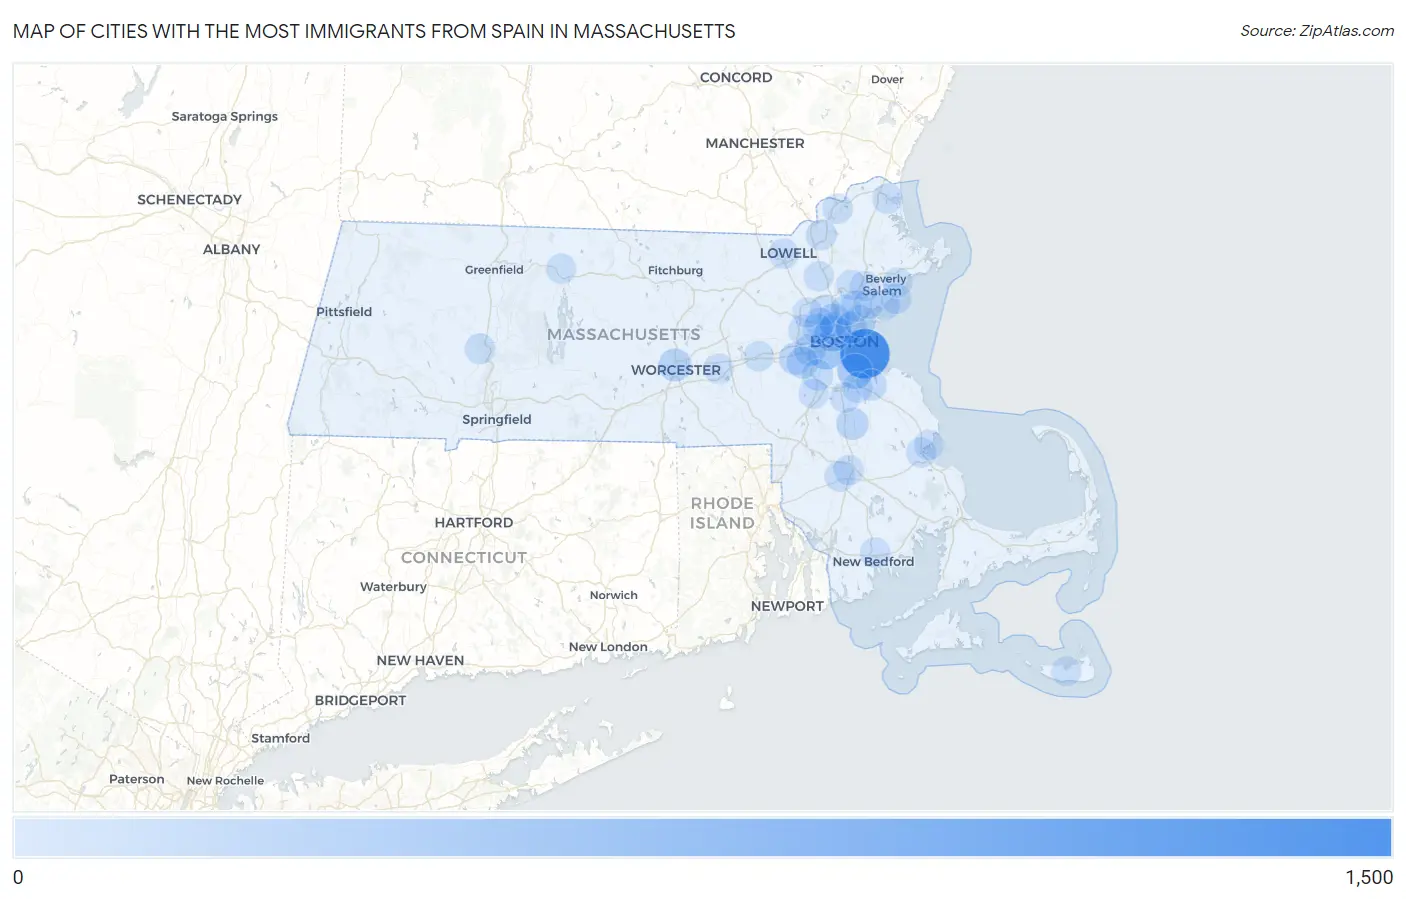
Map of Cities with the Most Immigrants from Spain in Massachusetts
0
1,500
Cities with the Most Immigrants from Spain in Massachusetts
| City | Spain | vs State | vs National | |
| 1. | Boston | 1,082 | 4,618(23.43%)#1 | 120,953(0.89%)#10 |
| 2. | Brookline | 331 | 4,618(7.17%)#2 | 120,953(0.27%)#32 |
| 3. | Cambridge | 320 | 4,618(6.93%)#3 | 120,953(0.26%)#35 |
| 4. | Quincy | 274 | 4,618(5.93%)#4 | 120,953(0.23%)#44 |
| 5. | Somerville | 169 | 4,618(3.66%)#5 | 120,953(0.14%)#98 |
| 6. | Worcester | 156 | 4,618(3.38%)#6 | 120,953(0.13%)#113 |
| 7. | Medford | 151 | 4,618(3.27%)#7 | 120,953(0.12%)#122 |
| 8. | Wellesley | 120 | 4,618(2.60%)#8 | 120,953(0.10%)#163 |
| 9. | Brockton | 117 | 4,618(2.53%)#9 | 120,953(0.10%)#166 |
| 10. | Newton | 117 | 4,618(2.53%)#10 | 120,953(0.10%)#167 |
| 11. | Chelsea | 106 | 4,618(2.30%)#11 | 120,953(0.09%)#186 |
| 12. | Needham | 93 | 4,618(2.01%)#12 | 120,953(0.08%)#228 |
| 13. | Revere | 88 | 4,618(1.91%)#13 | 120,953(0.07%)#240 |
| 14. | Dedham | 75 | 4,618(1.62%)#14 | 120,953(0.06%)#276 |
| 15. | Weymouth Town | 64 | 4,618(1.39%)#15 | 120,953(0.05%)#326 |
| 16. | Saugus | 63 | 4,618(1.36%)#16 | 120,953(0.05%)#334 |
| 17. | Amherst | 59 | 4,618(1.28%)#17 | 120,953(0.05%)#357 |
| 18. | Melrose | 58 | 4,618(1.26%)#18 | 120,953(0.05%)#366 |
| 19. | Waltham | 44 | 4,618(0.95%)#19 | 120,953(0.04%)#471 |
| 20. | Taunton | 37 | 4,618(0.80%)#20 | 120,953(0.03%)#545 |
| 21. | Winchester | 37 | 4,618(0.80%)#21 | 120,953(0.03%)#552 |
| 22. | Lawrence | 34 | 4,618(0.74%)#22 | 120,953(0.03%)#595 |
| 23. | Marblehead | 33 | 4,618(0.71%)#23 | 120,953(0.03%)#618 |
| 24. | Northampton | 29 | 4,618(0.63%)#24 | 120,953(0.02%)#682 |
| 25. | Haverhill | 27 | 4,618(0.58%)#25 | 120,953(0.02%)#716 |
| 26. | New Bedford | 25 | 4,618(0.54%)#26 | 120,953(0.02%)#758 |
| 27. | Braintree Town | 25 | 4,618(0.54%)#27 | 120,953(0.02%)#762 |
| 28. | Swampscott | 25 | 4,618(0.54%)#28 | 120,953(0.02%)#767 |
| 29. | Peabody | 24 | 4,618(0.52%)#29 | 120,953(0.02%)#789 |
| 30. | Belmont | 23 | 4,618(0.50%)#30 | 120,953(0.02%)#834 |
| 31. | Lowell | 22 | 4,618(0.48%)#31 | 120,953(0.02%)#853 |
| 32. | Randolph Town | 21 | 4,618(0.45%)#32 | 120,953(0.02%)#901 |
| 33. | Newburyport | 17 | 4,618(0.37%)#33 | 120,953(0.01%)#1,039 |
| 34. | Arlington | 13 | 4,618(0.28%)#34 | 120,953(0.01%)#1,202 |
| 35. | Lynnfield | 13 | 4,618(0.28%)#35 | 120,953(0.01%)#1,223 |
| 36. | Raynham Center | 13 | 4,618(0.28%)#36 | 120,953(0.01%)#1,231 |
| 37. | Orange | 13 | 4,618(0.28%)#37 | 120,953(0.01%)#1,234 |
| 38. | Framingham | 12 | 4,618(0.26%)#38 | 120,953(0.01%)#1,249 |
| 39. | Kingston | 12 | 4,618(0.26%)#39 | 120,953(0.01%)#1,284 |
| 40. | Norwood | 11 | 4,618(0.24%)#40 | 120,953(0.01%)#1,307 |
| 41. | Wilmington | 11 | 4,618(0.24%)#41 | 120,953(0.01%)#1,312 |
| 42. | Westborough | 11 | 4,618(0.24%)#42 | 120,953(0.01%)#1,337 |
| 43. | Lynn | 10 | 4,618(0.22%)#43 | 120,953(0.01%)#1,348 |
| 44. | Lexington | 9 | 4,618(0.19%)#44 | 120,953(0.01%)#1,431 |
| 45. | South Duxbury | 9 | 4,618(0.19%)#45 | 120,953(0.01%)#1,467 |
| 46. | Beverly | 7 | 4,618(0.15%)#46 | 120,953(0.01%)#1,553 |
| 47. | Nantucket | 3 | 4,618(0.06%)#47 | 120,953(0.00%)#1,779 |
Common Questions
What are the Top 10 Cities with the Most Immigrants from Spain in Massachusetts?
Top 10 Cities with the Most Immigrants from Spain in Massachusetts are:
What city has the Most Immigrants from Spain in Massachusetts?
Boston has the Most Immigrants from Spain in Massachusetts with 1,082.
What is the Total Immigrants from Spain in the State of Massachusetts?
Total Immigrants from Spain in Massachusetts is 4,618.
What is the Total Immigrants from Spain in the United States?
Total Immigrants from Spain in the United States is 120,953.