Seabrook, MA
Seabrook Map
Seabrook Overview
595
TOTAL POPULATION
294
MALE POPULATION
301
FEMALE POPULATION
97.67
MALES / 100 FEMALES
102.38
FEMALES / 100 MALES
57.5
MEDIAN AGE
2.6
AVG FAMILY SIZE
2.4
AVG HOUSEHOLD SIZE
$63,378
PER CAPITA INCOME
$125,875
AVG FAMILY INCOME
$123,889
AVG HOUSEHOLD INCOME
44.3%
WAGE / INCOME GAP [ % ]
55.7¢/ $1
WAGE / INCOME GAP [ $ ]
0.39
INEQUALITY / GINI INDEX
366
LABOR FORCE [ PEOPLE ]
67.5%
PERCENT IN LABOR FORCE
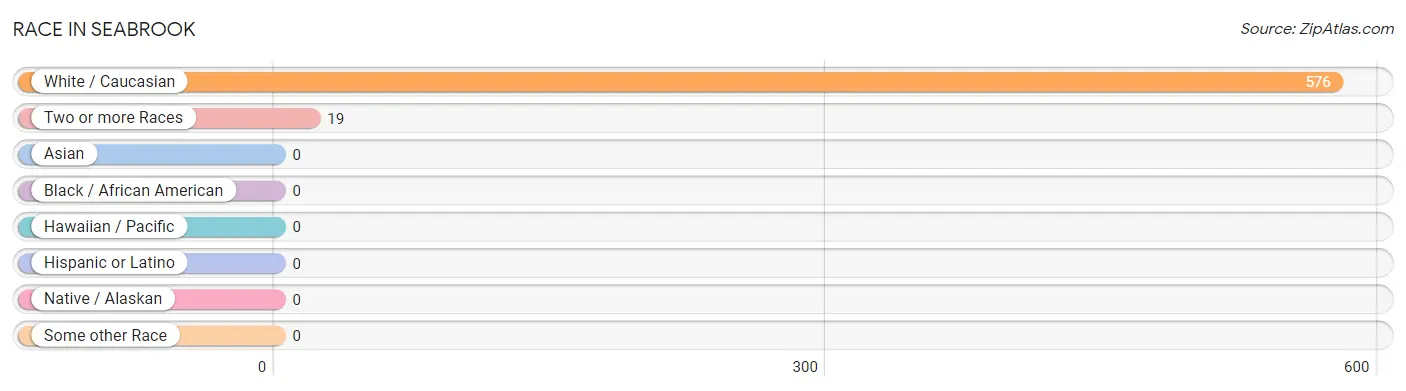
Race in Seabrook
The most populous races in Seabrook are White / Caucasian (576 | 96.8%), and Two or more Races (19 | 3.2%).
| Race | # Population | % Population |
| Asian | 0 | 0.0% |
| Black / African American | 0 | 0.0% |
| Hawaiian / Pacific | 0 | 0.0% |
| Hispanic or Latino | 0 | 0.0% |
| Native / Alaskan | 0 | 0.0% |
| White / Caucasian | 576 | 96.8% |
| Two or more Races | 19 | 3.2% |
| Some other Race | 0 | 0.0% |
| Total | 595 | 100.0% |
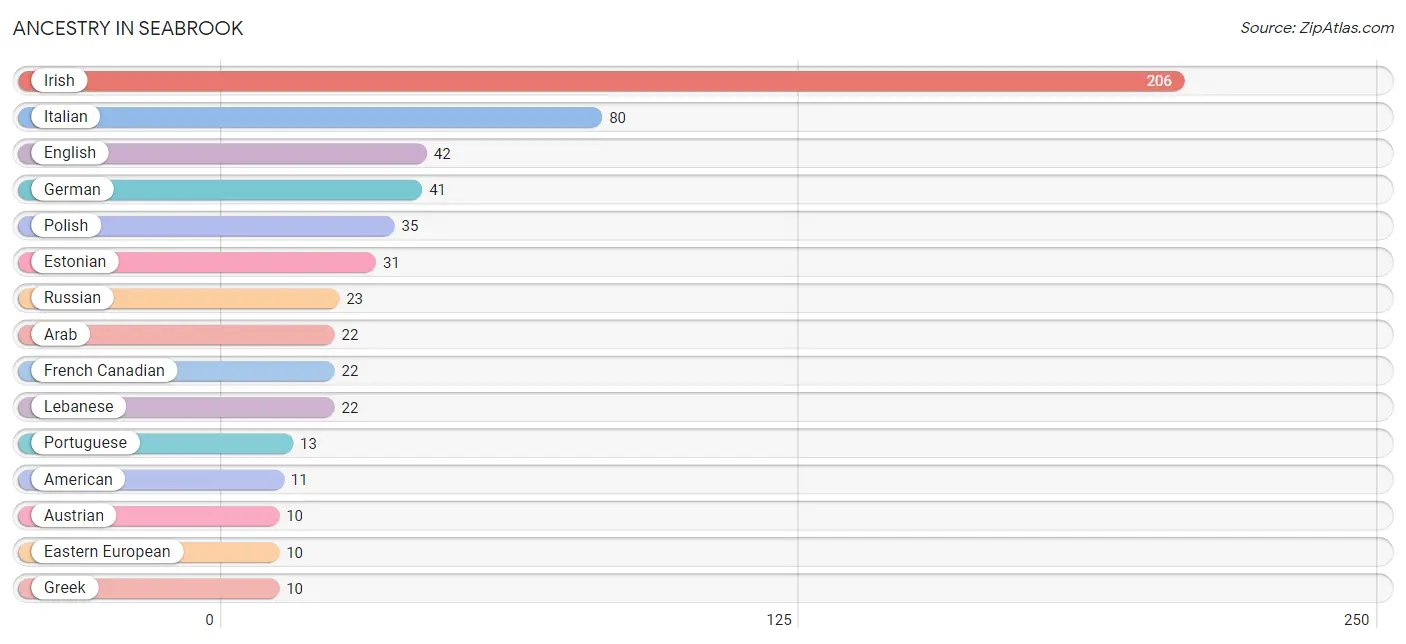
Ancestry in Seabrook
The most populous ancestries reported in Seabrook are Irish (206 | 34.6%), Italian (80 | 13.5%), English (42 | 7.1%), German (41 | 6.9%), and Polish (35 | 5.9%), together accounting for 67.9% of all Seabrook residents.
| Ancestry | # Population | % Population |
| American | 11 | 1.8% |
| Arab | 22 | 3.7% |
| Austrian | 10 | 1.7% |
| Dutch | 4 | 0.7% |
| Eastern European | 10 | 1.7% |
| English | 42 | 7.1% |
| Estonian | 31 | 5.2% |
| French | 3 | 0.5% |
| French Canadian | 22 | 3.7% |
| German | 41 | 6.9% |
| Greek | 10 | 1.7% |
| Irish | 206 | 34.6% |
| Italian | 80 | 13.5% |
| Lebanese | 22 | 3.7% |
| Polish | 35 | 5.9% |
| Portuguese | 13 | 2.2% |
| Russian | 23 | 3.9% | View All 17 Rows |
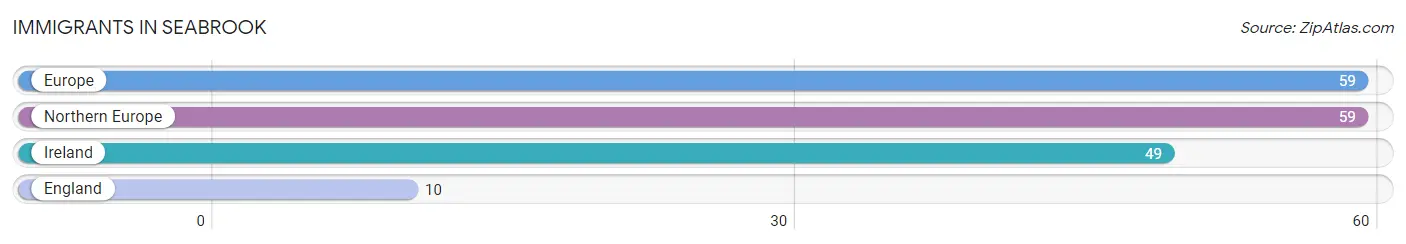
Immigrants in Seabrook
The most numerous immigrant groups reported in Seabrook came from Europe (59 | 9.9%), Northern Europe (59 | 9.9%), Ireland (49 | 8.2%), and England (10 | 1.7%), together accounting for 29.8% of all Seabrook residents.
| Immigration Origin | # Population | % Population |
| England | 10 | 1.7% |
| Europe | 59 | 9.9% |
| Ireland | 49 | 8.2% |
| Northern Europe | 59 | 9.9% | View All 4 Rows |
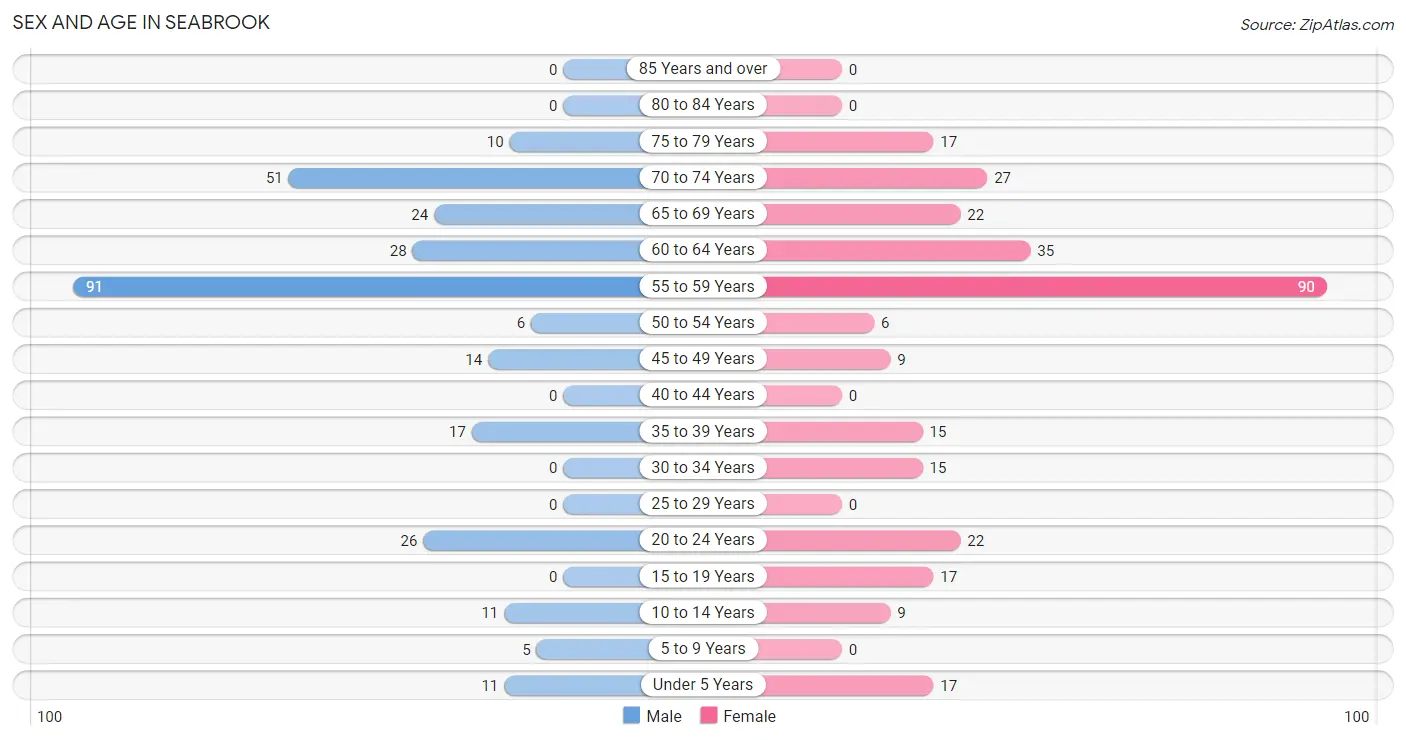
Sex and Age in Seabrook
Sex and Age in Seabrook
The most populous age groups in Seabrook are 55 to 59 Years (91 | 30.9%) for men and 55 to 59 Years (90 | 29.9%) for women.
| Age Bracket | Male | Female |
| Under 5 Years | 11 (3.7%) | 17 (5.7%) |
| 5 to 9 Years | 5 (1.7%) | 0 (0.0%) |
| 10 to 14 Years | 11 (3.7%) | 9 (3.0%) |
| 15 to 19 Years | 0 (0.0%) | 17 (5.7%) |
| 20 to 24 Years | 26 (8.8%) | 22 (7.3%) |
| 25 to 29 Years | 0 (0.0%) | 0 (0.0%) |
| 30 to 34 Years | 0 (0.0%) | 15 (5.0%) |
| 35 to 39 Years | 17 (5.8%) | 15 (5.0%) |
| 40 to 44 Years | 0 (0.0%) | 0 (0.0%) |
| 45 to 49 Years | 14 (4.8%) | 9 (3.0%) |
| 50 to 54 Years | 6 (2.0%) | 6 (2.0%) |
| 55 to 59 Years | 91 (30.9%) | 90 (29.9%) |
| 60 to 64 Years | 28 (9.5%) | 35 (11.6%) |
| 65 to 69 Years | 24 (8.2%) | 22 (7.3%) |
| 70 to 74 Years | 51 (17.3%) | 27 (9.0%) |
| 75 to 79 Years | 10 (3.4%) | 17 (5.7%) |
| 80 to 84 Years | 0 (0.0%) | 0 (0.0%) |
| 85 Years and over | 0 (0.0%) | 0 (0.0%) |
| Total | 294 (100.0%) | 301 (100.0%) |
Families and Households in Seabrook
Median Family Size in Seabrook
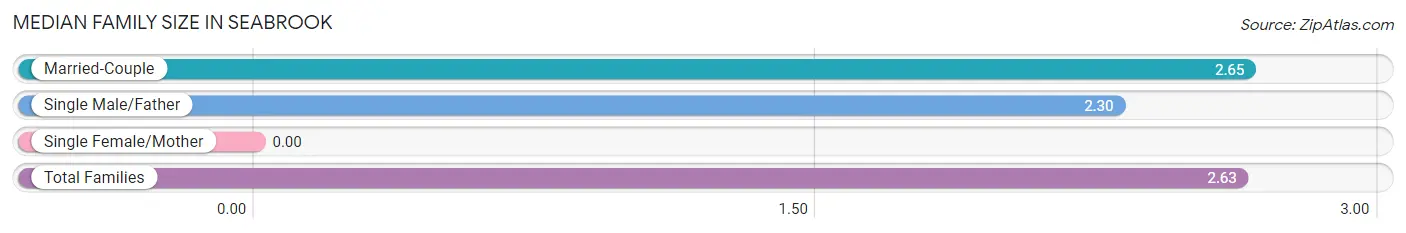
| Family Type | # Families | Family Size |
| Married-Couple | 183 (94.8%) | 2.65 |
| Single Male/Father | 10 (5.2%) | 2.30 |
| Single Female/Mother | 0 (0.0%) | - |
| Total Families | 193 (100.0%) | 2.63 |
Median Household Size in Seabrook
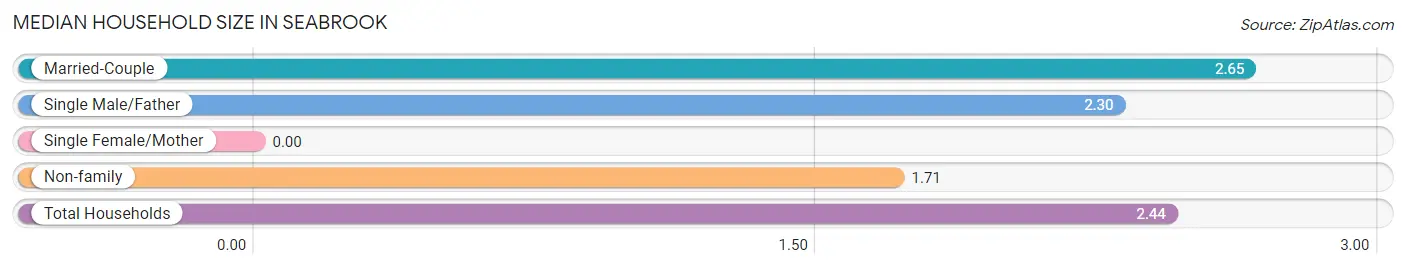
| Household Type | # Households | Household Size |
| Married-Couple | 183 (75.0%) | 2.65 |
| Single Male/Father | 10 (4.1%) | 2.30 |
| Single Female/Mother | 0 (0.0%) | - |
| Non-family | 51 (20.9%) | 1.71 |
| Total Households | 244 (100.0%) | 2.44 |
Household Size by Marriage Status in Seabrook
Out of a total of 244 households in Seabrook, 193 (79.1%) are family households, while 51 (20.9%) are nonfamily households. The most numerous type of family households are 2-person households, comprising 143, and the most common type of nonfamily households are 1-person households, comprising 33.
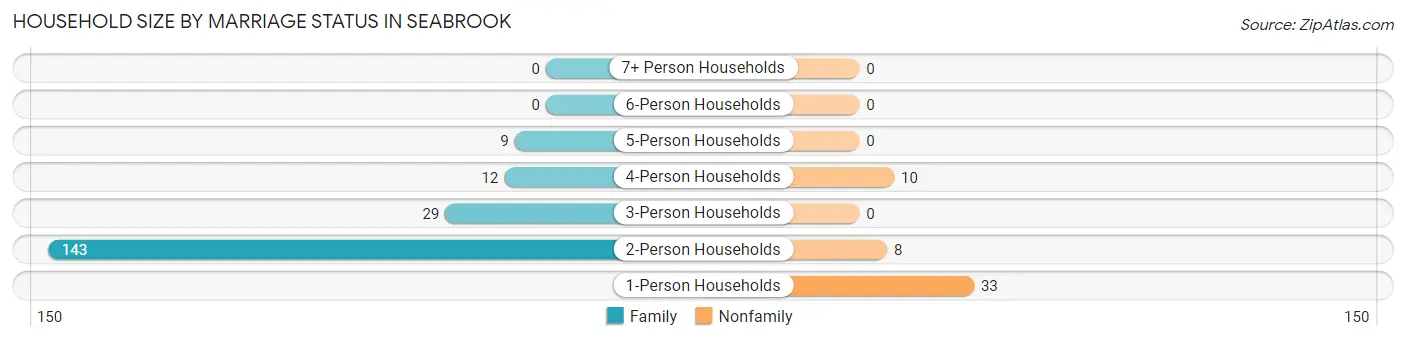
| Household Size | Family Households | Nonfamily Households |
| 1-Person Households | - | 33 (13.5%) |
| 2-Person Households | 143 (58.6%) | 8 (3.3%) |
| 3-Person Households | 29 (11.9%) | 0 (0.0%) |
| 4-Person Households | 12 (4.9%) | 10 (4.1%) |
| 5-Person Households | 9 (3.7%) | 0 (0.0%) |
| 6-Person Households | 0 (0.0%) | 0 (0.0%) |
| 7+ Person Households | 0 (0.0%) | 0 (0.0%) |
| Total | 193 (79.1%) | 51 (20.9%) |
Female Fertility in Seabrook
Fertility by Age in Seabrook
| Age Bracket | Women with Births | Births / 1,000 Women |
| 15 to 19 years | 0 (0.0%) | 0.0 |
| 20 to 34 years | 0 (0.0%) | 0.0 |
| 35 to 50 years | 0 (0.0%) | 0.0 |
| Total | 0 (0.0%) | 0.0 |
Fertility by Age by Marriage Status in Seabrook
| Age Bracket | Married | Unmarried |
| 15 to 19 years | 0 (0.0%) | 0 (0.0%) |
| 20 to 34 years | 0 (0.0%) | 0 (0.0%) |
| 35 to 50 years | 0 (0.0%) | 0 (0.0%) |
| Total | 0 (0.0%) | 0 (0.0%) |
Fertility by Education in Seabrook
| Educational Attainment | Women with Births | Births / 1,000 Women |
| Less than High School | 0 (0.0%) | 0.0 |
| High School Diploma | 0 (0.0%) | 0.0 |
| College or Associate's Degree | 0 (0.0%) | 0.0 |
| Bachelor's Degree | 0 (0.0%) | 0.0 |
| Graduate Degree | 0 (0.0%) | 0.0 |
| Total | 0 (0.0%) | 0.0 |
Fertility by Education by Marriage Status in Seabrook
| Educational Attainment | Married | Unmarried |
| Less than High School | 0 (0.0%) | 0 (0.0%) |
| High School Diploma | 0 (0.0%) | 0 (0.0%) |
| College or Associate's Degree | 0 (0.0%) | 0 (0.0%) |
| Bachelor's Degree | 0 (0.0%) | 0 (0.0%) |
| Graduate Degree | 0 (0.0%) | 0 (0.0%) |
| Total | 0 (0.0%) | 0 (0.0%) |
Income in Seabrook
Income Overview in Seabrook
Per Capita Income in Seabrook is $63,378, while median incomes of families and households are $125,875 and $123,889 respectively.
| Characteristic | Number | Measure |
| Per Capita Income | 595 | $63,378 |
| Median Family Income | 193 | $125,875 |
| Mean Family Income | 193 | $159,595 |
| Median Household Income | 244 | $123,889 |
| Mean Household Income | 244 | $149,900 |
| Income Deficit | 193 | $0 |
| Wage / Income Gap (%) | 595 | 44.32% |
| Wage / Income Gap ($) | 595 | 55.68¢ per $1 |
| Gini / Inequality Index | 595 | 0.39 |
Earnings by Sex in Seabrook
Average Earnings in Seabrook are $50,455, $81,750 for men and $45,521 for women, a difference of 44.3%.
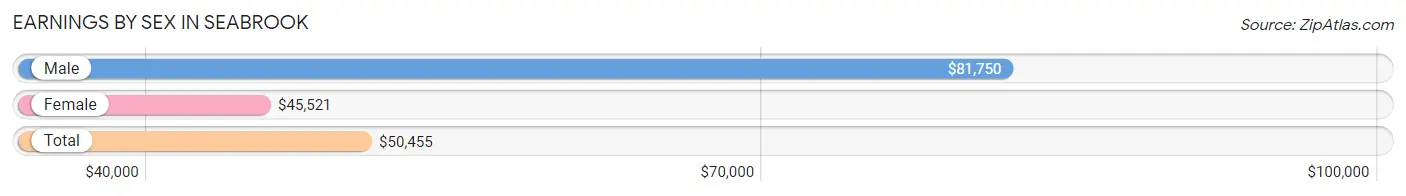
| Sex | Number | Average Earnings |
| Male | 198 (52.7%) | $81,750 |
| Female | 178 (47.3%) | $45,521 |
| Total | 376 (100.0%) | $50,455 |
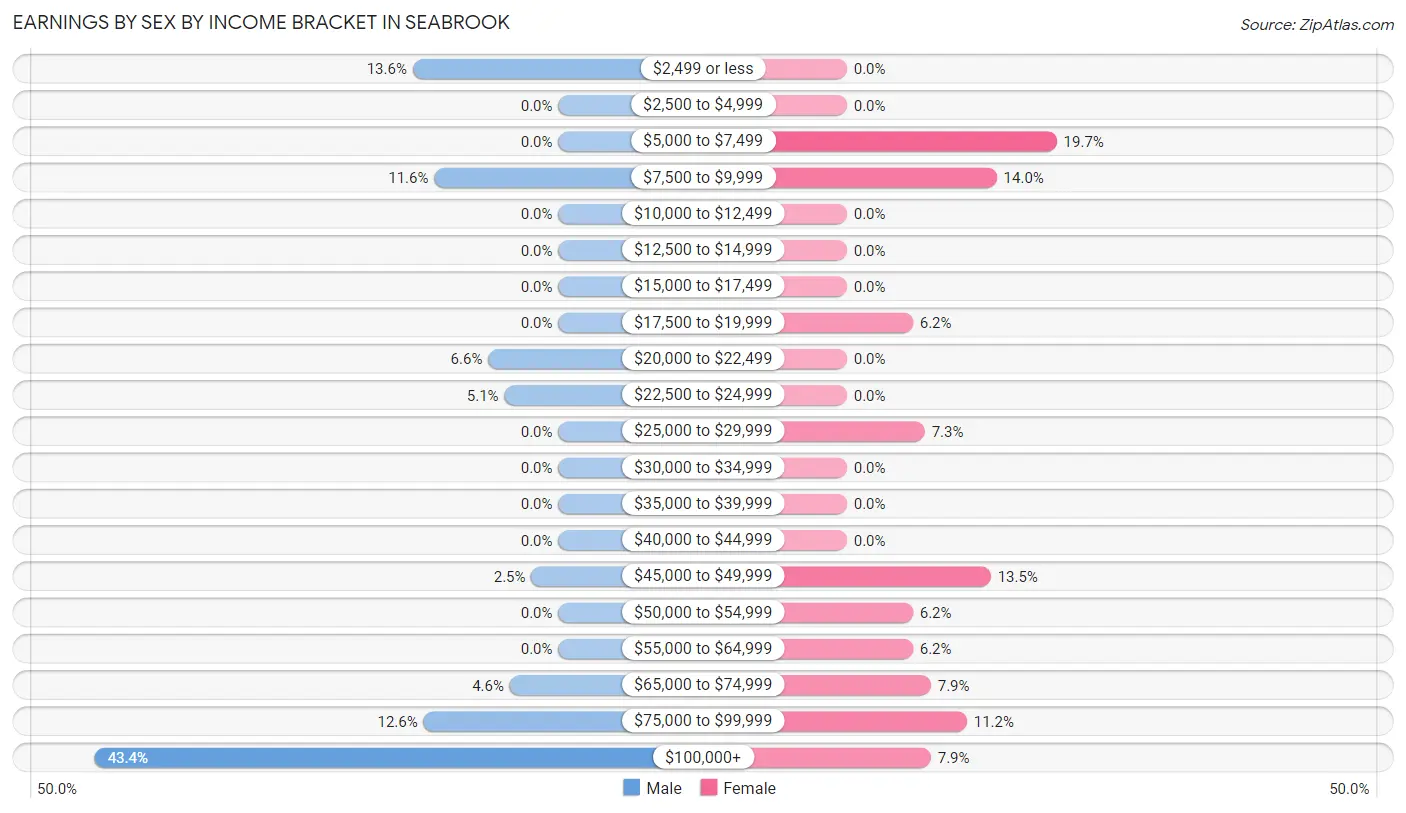
Earnings by Sex by Income Bracket in Seabrook
The most common earnings brackets in Seabrook are $100,000+ for men (86 | 43.4%) and $5,000 to $7,499 for women (35 | 19.7%).
| Income | Male | Female |
| $2,499 or less | 27 (13.6%) | 0 (0.0%) |
| $2,500 to $4,999 | 0 (0.0%) | 0 (0.0%) |
| $5,000 to $7,499 | 0 (0.0%) | 35 (19.7%) |
| $7,500 to $9,999 | 23 (11.6%) | 25 (14.0%) |
| $10,000 to $12,499 | 0 (0.0%) | 0 (0.0%) |
| $12,500 to $14,999 | 0 (0.0%) | 0 (0.0%) |
| $15,000 to $17,499 | 0 (0.0%) | 0 (0.0%) |
| $17,500 to $19,999 | 0 (0.0%) | 11 (6.2%) |
| $20,000 to $22,499 | 13 (6.6%) | 0 (0.0%) |
| $22,500 to $24,999 | 10 (5.1%) | 0 (0.0%) |
| $25,000 to $29,999 | 0 (0.0%) | 13 (7.3%) |
| $30,000 to $34,999 | 0 (0.0%) | 0 (0.0%) |
| $35,000 to $39,999 | 0 (0.0%) | 0 (0.0%) |
| $40,000 to $44,999 | 0 (0.0%) | 0 (0.0%) |
| $45,000 to $49,999 | 5 (2.5%) | 24 (13.5%) |
| $50,000 to $54,999 | 0 (0.0%) | 11 (6.2%) |
| $55,000 to $64,999 | 0 (0.0%) | 11 (6.2%) |
| $65,000 to $74,999 | 9 (4.5%) | 14 (7.9%) |
| $75,000 to $99,999 | 25 (12.6%) | 20 (11.2%) |
| $100,000+ | 86 (43.4%) | 14 (7.9%) |
| Total | 198 (100.0%) | 178 (100.0%) |
Earnings by Sex by Educational Attainment in Seabrook
Average earnings in Seabrook are $93,750 for men and $45,938 for women, a difference of 51.0%. Men with an educational attainment of bachelor's degree enjoy the highest average annual earnings of $172,000, while those with bachelor's degree education earn the least with $172,000. Women with an educational attainment of bachelor's degree earn the most with the average annual earnings of $92,813, while those with bachelor's degree education have the smallest earnings of $92,813.
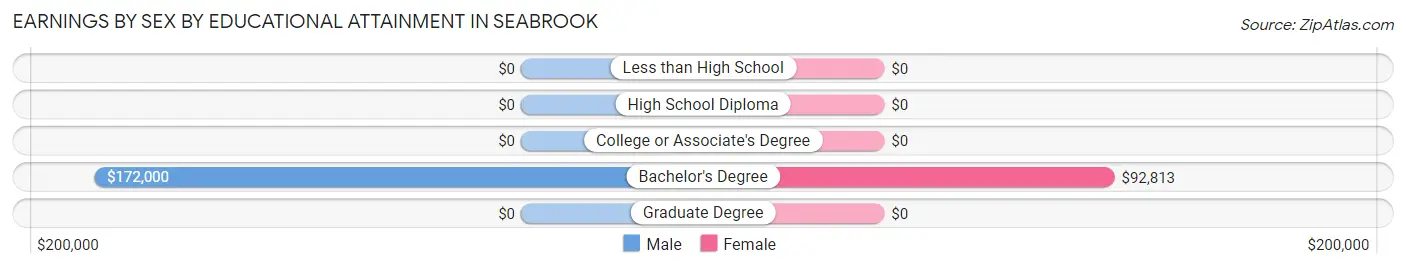
| Educational Attainment | Male Income | Female Income |
| Less than High School | - | - |
| High School Diploma | - | - |
| College or Associate's Degree | - | - |
| Bachelor's Degree | $172,000 | $92,813 |
| Graduate Degree | - | - |
| Total | $93,750 | $45,938 |
Family Income in Seabrook
Family Income Brackets in Seabrook
According to the Seabrook family income data, there are 73 families falling into the $200,000+ income range, which is the most common income bracket and makes up 37.8% of all families.
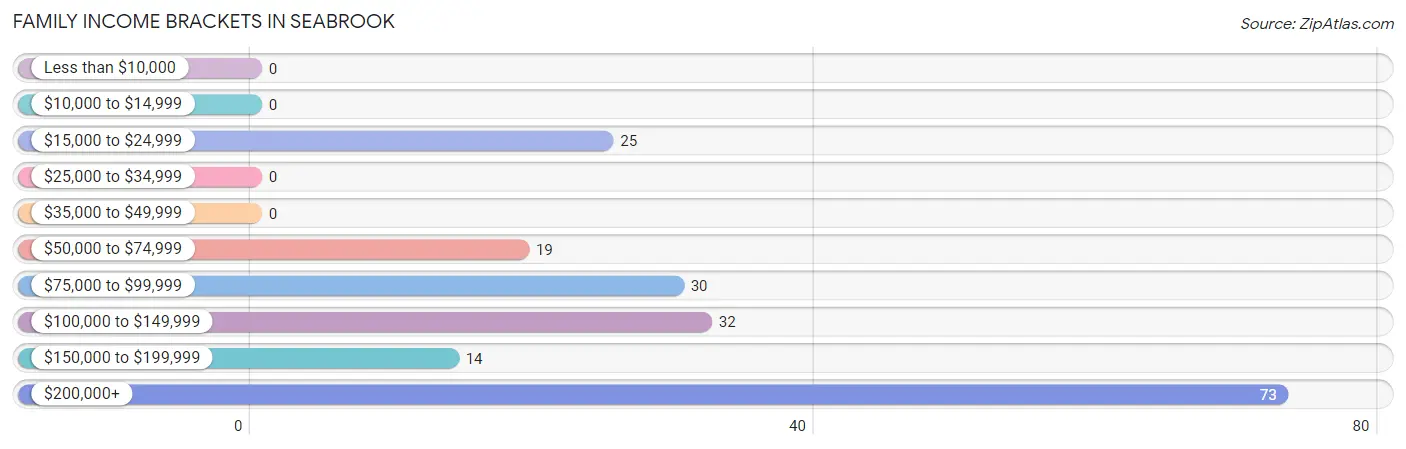
| Income Bracket | # Families | % Families |
| Less than $10,000 | 0 | 0.0% |
| $10,000 to $14,999 | 0 | 0.0% |
| $15,000 to $24,999 | 25 | 13.0% |
| $25,000 to $34,999 | 0 | 0.0% |
| $35,000 to $49,999 | 0 | 0.0% |
| $50,000 to $74,999 | 19 | 9.8% |
| $75,000 to $99,999 | 30 | 15.5% |
| $100,000 to $149,999 | 32 | 16.6% |
| $150,000 to $199,999 | 14 | 7.3% |
| $200,000+ | 73 | 37.8% |
Family Income by Famaliy Size in Seabrook
| Income Bracket | # Families | Median Income |
| 2-Person Families | 143 (74.1%) | $0 |
| 3-Person Families | 29 (15.0%) | $0 |
| 4-Person Families | 12 (6.2%) | $0 |
| 5-Person Families | 9 (4.7%) | $0 |
| 6-Person Families | 0 (0.0%) | $0 |
| 7+ Person Families | 0 (0.0%) | $0 |
| Total | 193 (100.0%) | $125,875 |
Family Income by Number of Earners in Seabrook
| Number of Earners | # Families | Median Income |
| No Earners | 21 (10.9%) | $0 |
| 1 Earner | 52 (26.9%) | $0 |
| 2 Earners | 114 (59.1%) | $0 |
| 3+ Earners | 6 (3.1%) | $0 |
| Total | 193 (100.0%) | $125,875 |
Household Income in Seabrook
Household Income Brackets in Seabrook
With 83 households falling in the category, the $200,000+ income range is the most frequent in Seabrook, accounting for 34.0% of all households.
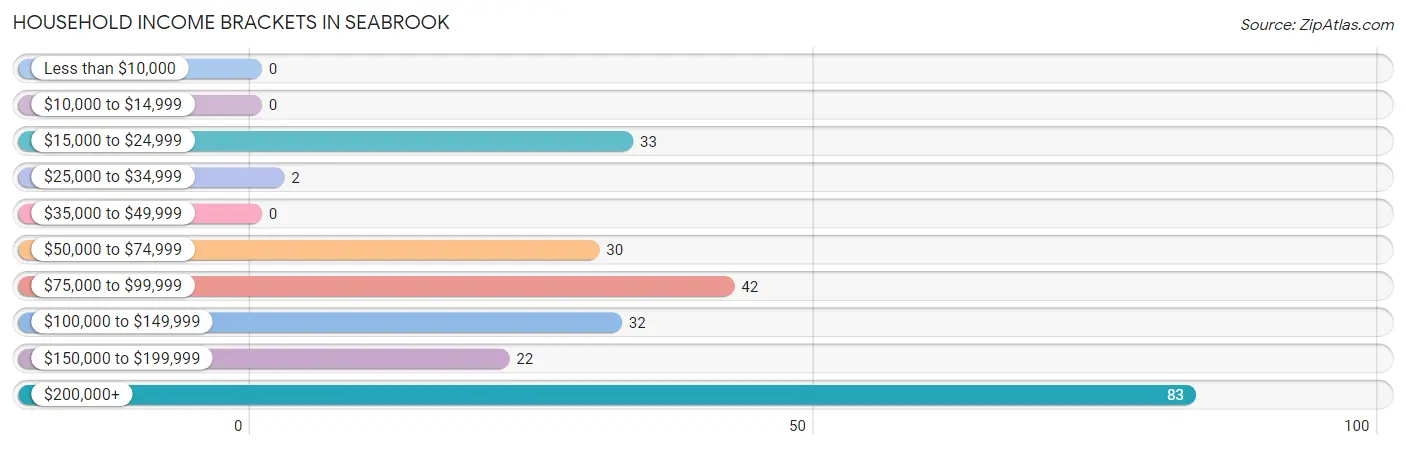
| Income Bracket | # Households | % Households |
| Less than $10,000 | 0 | 0.0% |
| $10,000 to $14,999 | 0 | 0.0% |
| $15,000 to $24,999 | 33 | 13.5% |
| $25,000 to $34,999 | 2 | 0.8% |
| $35,000 to $49,999 | 0 | 0.0% |
| $50,000 to $74,999 | 30 | 12.3% |
| $75,000 to $99,999 | 42 | 17.2% |
| $100,000 to $149,999 | 32 | 13.1% |
| $150,000 to $199,999 | 22 | 9.0% |
| $200,000+ | 83 | 34.0% |
Household Income by Householder Age in Seabrook
The median household income in Seabrook is $123,889, with the highest median household income of $217,000 found in the 25 to 44 years age bracket for the primary householder. A total of 16 households (6.6%) fall into this category.
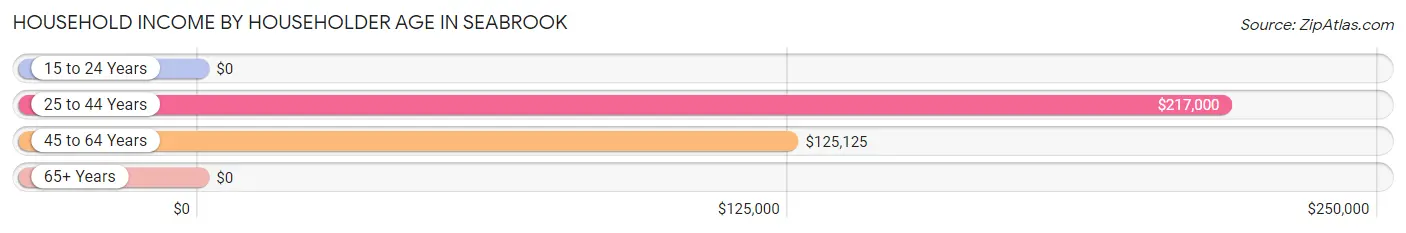
| Income Bracket | # Households | Median Income |
| 15 to 24 Years | 0 (0.0%) | $0 |
| 25 to 44 Years | 16 (6.6%) | $217,000 |
| 45 to 64 Years | 147 (60.3%) | $125,125 |
| 65+ Years | 81 (33.2%) | $0 |
| Total | 244 (100.0%) | $123,889 |
Poverty in Seabrook
Income Below Poverty by Sex and Age in Seabrook
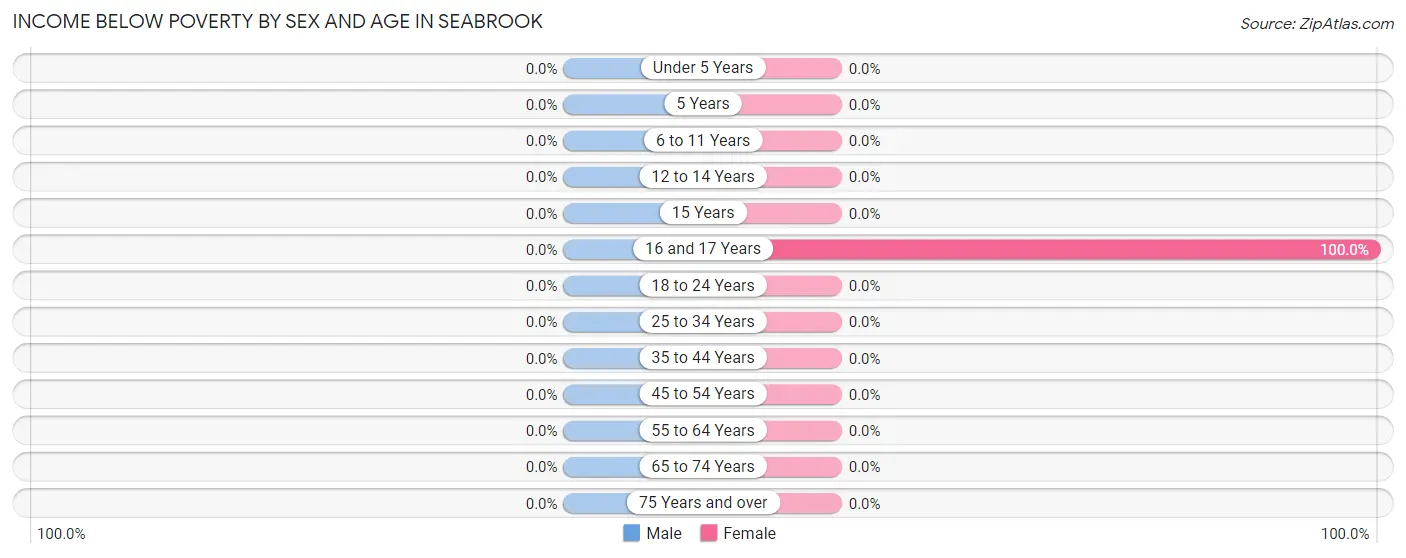
| Age Bracket | Male | Female |
| Under 5 Years | 0 (0.0%) | 0 (0.0%) |
| 5 Years | 0 (0.0%) | 0 (0.0%) |
| 6 to 11 Years | 0 (0.0%) | 0 (0.0%) |
| 12 to 14 Years | 0 (0.0%) | 0 (0.0%) |
| 15 Years | 0 (0.0%) | 0 (0.0%) |
| 16 and 17 Years | 0 (0.0%) | 9 (100.0%) |
| 18 to 24 Years | 0 (0.0%) | 0 (0.0%) |
| 25 to 34 Years | 0 (0.0%) | 0 (0.0%) |
| 35 to 44 Years | 0 (0.0%) | 0 (0.0%) |
| 45 to 54 Years | 0 (0.0%) | 0 (0.0%) |
| 55 to 64 Years | 0 (0.0%) | 0 (0.0%) |
| 65 to 74 Years | 0 (0.0%) | 0 (0.0%) |
| 75 Years and over | 0 (0.0%) | 0 (0.0%) |
| Total | 0 (0.0%) | 9 (3.1%) |
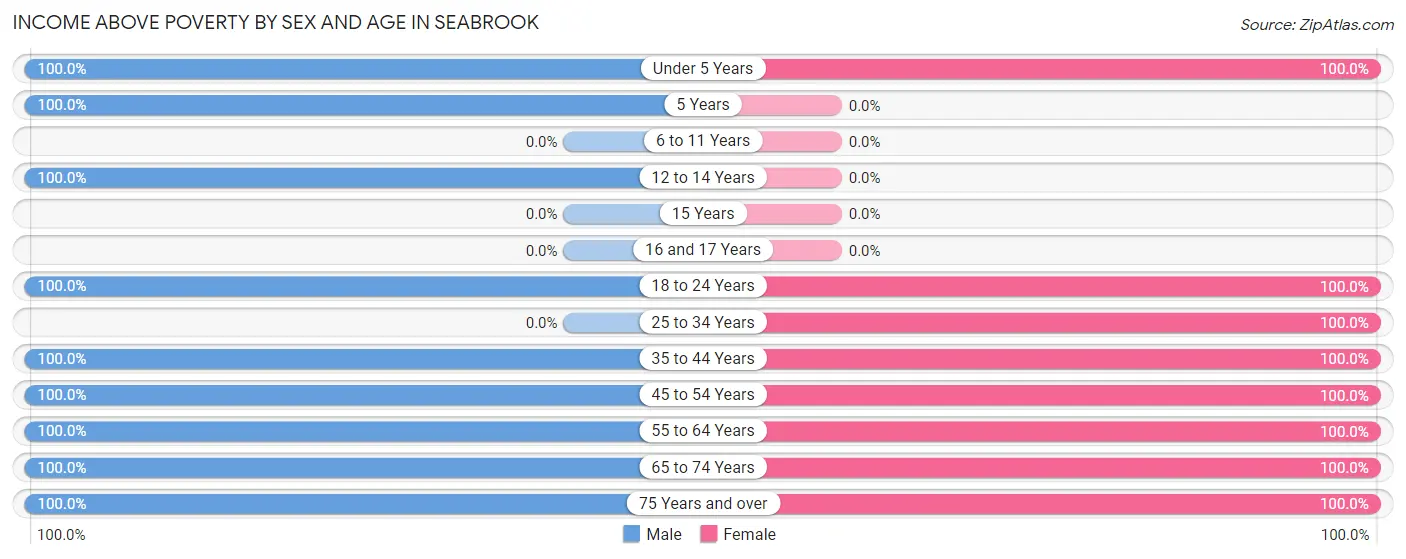
Income Above Poverty by Sex and Age in Seabrook
According to the poverty statistics in Seabrook, males aged under 5 years and females aged under 5 years are the age groups that are most secure financially, with 100.0% of males and 100.0% of females in these age groups living above the poverty line.
| Age Bracket | Male | Female |
| Under 5 Years | 11 (100.0%) | 17 (100.0%) |
| 5 Years | 5 (100.0%) | 0 (0.0%) |
| 6 to 11 Years | 0 (0.0%) | 0 (0.0%) |
| 12 to 14 Years | 11 (100.0%) | 0 (0.0%) |
| 15 Years | 0 (0.0%) | 0 (0.0%) |
| 16 and 17 Years | 0 (0.0%) | 0 (0.0%) |
| 18 to 24 Years | 26 (100.0%) | 30 (100.0%) |
| 25 to 34 Years | 0 (0.0%) | 15 (100.0%) |
| 35 to 44 Years | 17 (100.0%) | 15 (100.0%) |
| 45 to 54 Years | 20 (100.0%) | 15 (100.0%) |
| 55 to 64 Years | 119 (100.0%) | 125 (100.0%) |
| 65 to 74 Years | 75 (100.0%) | 49 (100.0%) |
| 75 Years and over | 10 (100.0%) | 17 (100.0%) |
| Total | 294 (100.0%) | 283 (96.9%) |
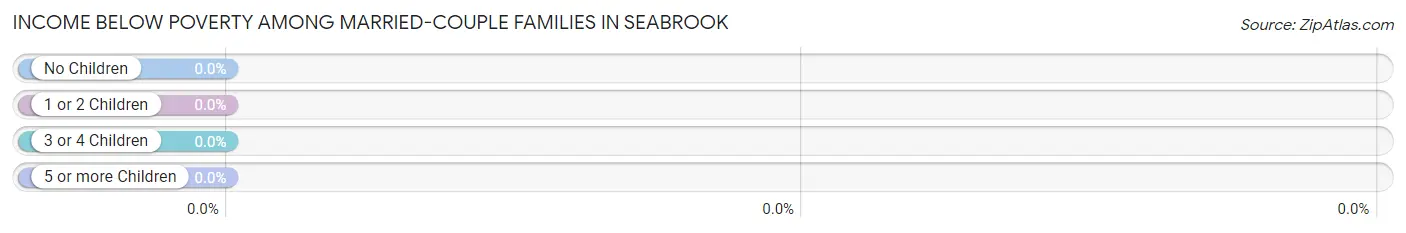
Income Below Poverty Among Married-Couple Families in Seabrook
| Children | Above Poverty | Below Poverty |
| No Children | 168 (100.0%) | 0 (0.0%) |
| 1 or 2 Children | 12 (100.0%) | 0 (0.0%) |
| 3 or 4 Children | 3 (100.0%) | 0 (0.0%) |
| 5 or more Children | 0 (0.0%) | 0 (0.0%) |
| Total | 183 (100.0%) | 0 (0.0%) |
Income Below Poverty Among Single-Parent Households in Seabrook
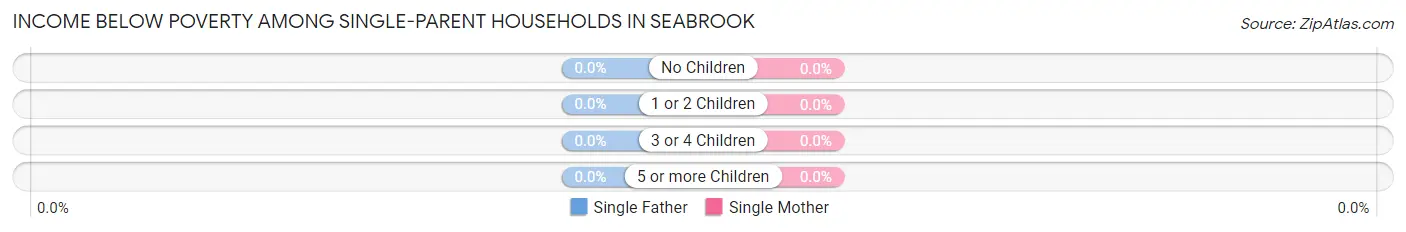
| Children | Single Father | Single Mother |
| No Children | 0 (0.0%) | 0 (0.0%) |
| 1 or 2 Children | 0 (0.0%) | 0 (0.0%) |
| 3 or 4 Children | 0 (0.0%) | 0 (0.0%) |
| 5 or more Children | 0 (0.0%) | 0 (0.0%) |
| Total | 0 (0.0%) | 0 (0.0%) |
Income Below Poverty Among Married-Couple vs Single-Parent Households in Seabrook
| Children | Married-Couple Families | Single-Parent Households |
| No Children | 0 (0.0%) | 0 (0.0%) |
| 1 or 2 Children | 0 (0.0%) | 0 (0.0%) |
| 3 or 4 Children | 0 (0.0%) | 0 (0.0%) |
| 5 or more Children | 0 (0.0%) | 0 (0.0%) |
| Total | 0 (0.0%) | 0 (0.0%) |
Employment Characteristics in Seabrook
Employment by Class of Employer in Seabrook
Among the 353 employed individuals in Seabrook, private company employees (206 | 58.4%), state government employees (49 | 13.9%), and not-for-profit organizations (32 | 9.1%) make up the most common classes of employment.
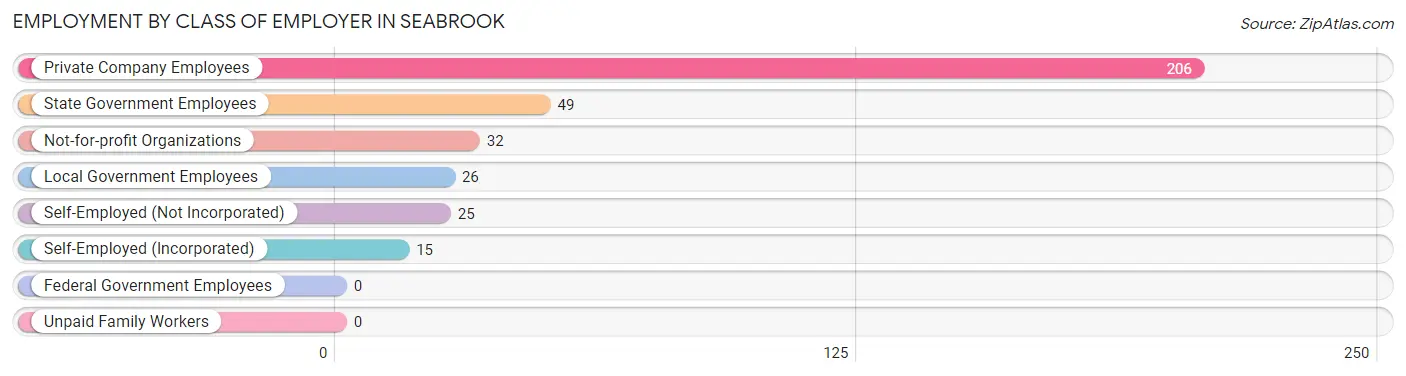
| Employer Class | # Employees | % Employees |
| Private Company Employees | 206 | 58.4% |
| Self-Employed (Incorporated) | 15 | 4.3% |
| Self-Employed (Not Incorporated) | 25 | 7.1% |
| Not-for-profit Organizations | 32 | 9.1% |
| Local Government Employees | 26 | 7.4% |
| State Government Employees | 49 | 13.9% |
| Federal Government Employees | 0 | 0.0% |
| Unpaid Family Workers | 0 | 0.0% |
| Total | 353 | 100.0% |
Employment Status by Age in Seabrook
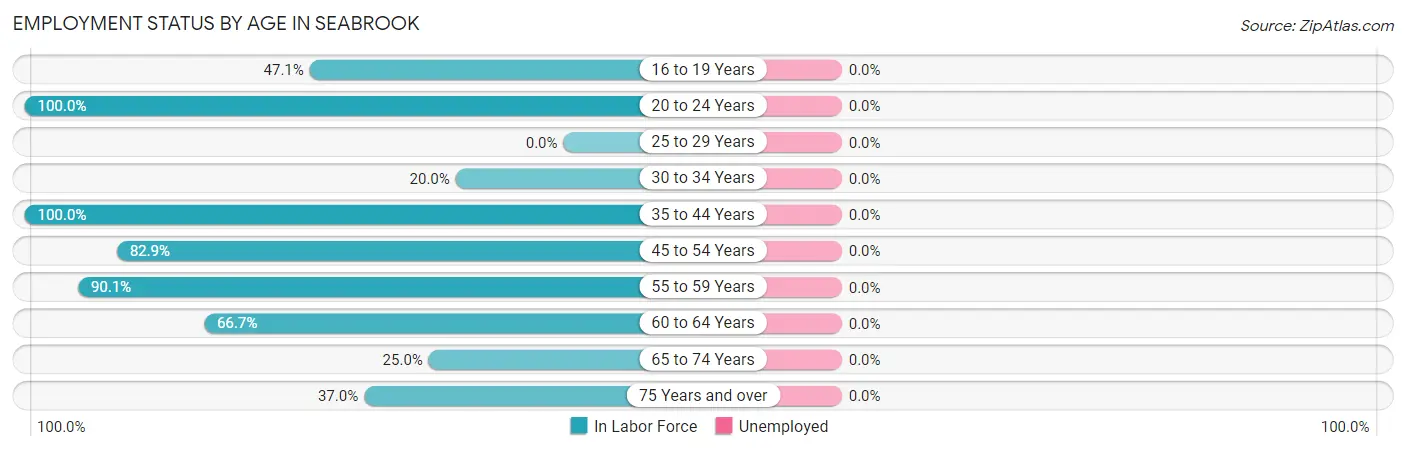
| Age Bracket | In Labor Force | Unemployed |
| 16 to 19 Years | 8 (47.1%) | 0 (0.0%) |
| 20 to 24 Years | 48 (100.0%) | 0 (0.0%) |
| 25 to 29 Years | 0 (0.0%) | 0 (0.0%) |
| 30 to 34 Years | 3 (20.0%) | 0 (0.0%) |
| 35 to 44 Years | 32 (100.0%) | 0 (0.0%) |
| 45 to 54 Years | 29 (82.9%) | 0 (0.0%) |
| 55 to 59 Years | 163 (90.1%) | 0 (0.0%) |
| 60 to 64 Years | 42 (66.7%) | 0 (0.0%) |
| 65 to 74 Years | 31 (25.0%) | 0 (0.0%) |
| 75 Years and over | 10 (37.0%) | 0 (0.0%) |
| Total | 366 (67.5%) | 0 (0.0%) |
Employment Status by Educational Attainment in Seabrook
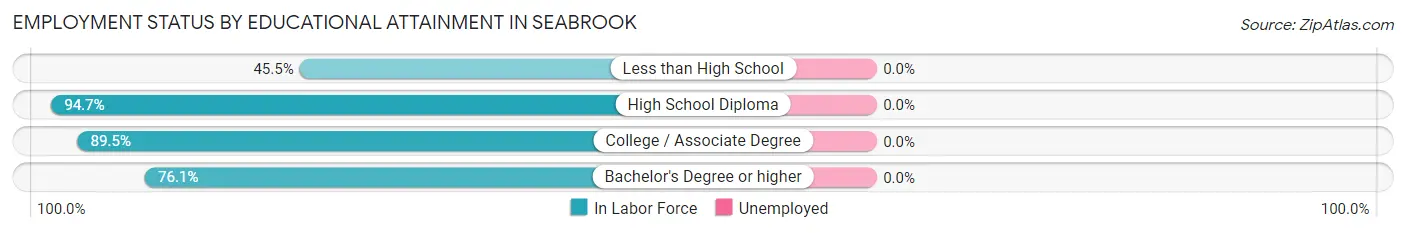
| Educational Attainment | In Labor Force | Unemployed |
| Less than High School | 10 (45.5%) | 0 (0.0%) |
| High School Diploma | 89 (94.7%) | 0 (0.0%) |
| College / Associate Degree | 68 (89.5%) | 0 (0.0%) |
| Bachelor's Degree or higher | 102 (76.1%) | 0 (0.0%) |
| Total | 269 (82.5%) | 0 (0.0%) |
Employment Occupations by Sex in Seabrook
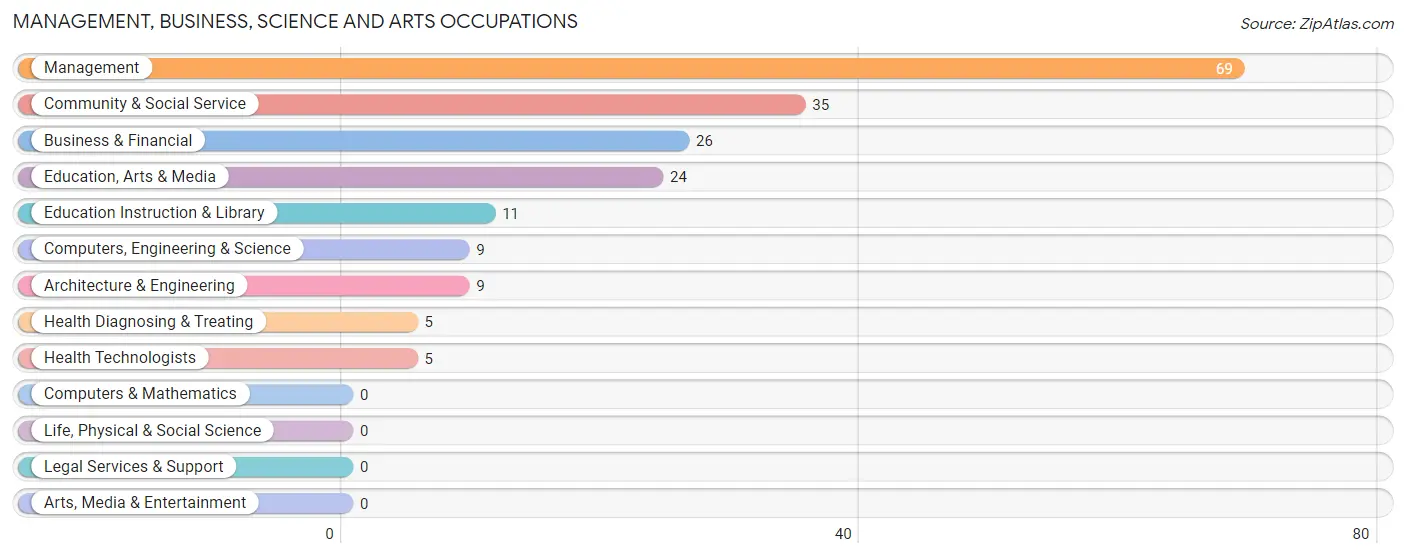
Management, Business, Science and Arts Occupations
The most common Management, Business, Science and Arts occupations in Seabrook are Management (69 | 18.9%), Community & Social Service (35 | 9.6%), Business & Financial (26 | 7.1%), Education, Arts & Media (24 | 6.6%), and Education Instruction & Library (11 | 3.0%).
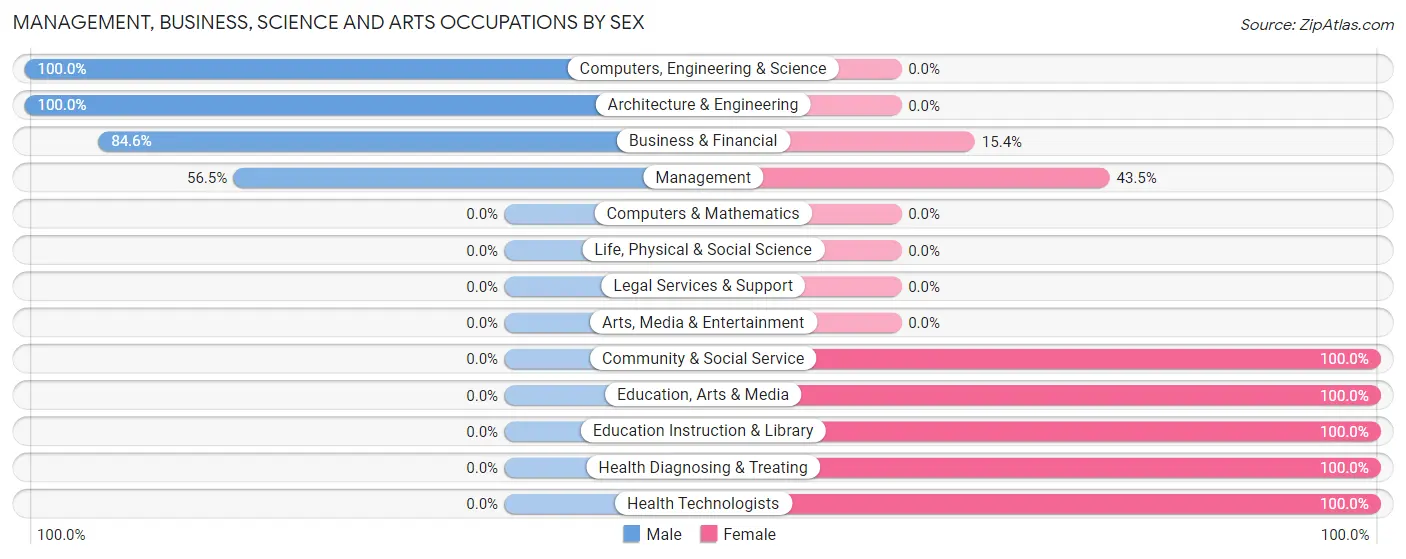
Management, Business, Science and Arts Occupations by Sex
Within the Management, Business, Science and Arts occupations in Seabrook, the most male-oriented occupations are Computers, Engineering & Science (100.0%), Architecture & Engineering (100.0%), and Business & Financial (84.6%), while the most female-oriented occupations are Community & Social Service (100.0%), Education, Arts & Media (100.0%), and Education Instruction & Library (100.0%).
| Occupation | Male | Female |
| Management | 39 (56.5%) | 30 (43.5%) |
| Business & Financial | 22 (84.6%) | 4 (15.4%) |
| Computers, Engineering & Science | 9 (100.0%) | 0 (0.0%) |
| Computers & Mathematics | 0 (0.0%) | 0 (0.0%) |
| Architecture & Engineering | 9 (100.0%) | 0 (0.0%) |
| Life, Physical & Social Science | 0 (0.0%) | 0 (0.0%) |
| Community & Social Service | 0 (0.0%) | 35 (100.0%) |
| Education, Arts & Media | 0 (0.0%) | 24 (100.0%) |
| Legal Services & Support | 0 (0.0%) | 0 (0.0%) |
| Education Instruction & Library | 0 (0.0%) | 11 (100.0%) |
| Arts, Media & Entertainment | 0 (0.0%) | 0 (0.0%) |
| Health Diagnosing & Treating | 0 (0.0%) | 5 (100.0%) |
| Health Technologists | 0 (0.0%) | 5 (100.0%) |
| Total (Category) | 70 (48.6%) | 74 (51.4%) |
| Total (Overall) | 188 (51.4%) | 178 (48.6%) |
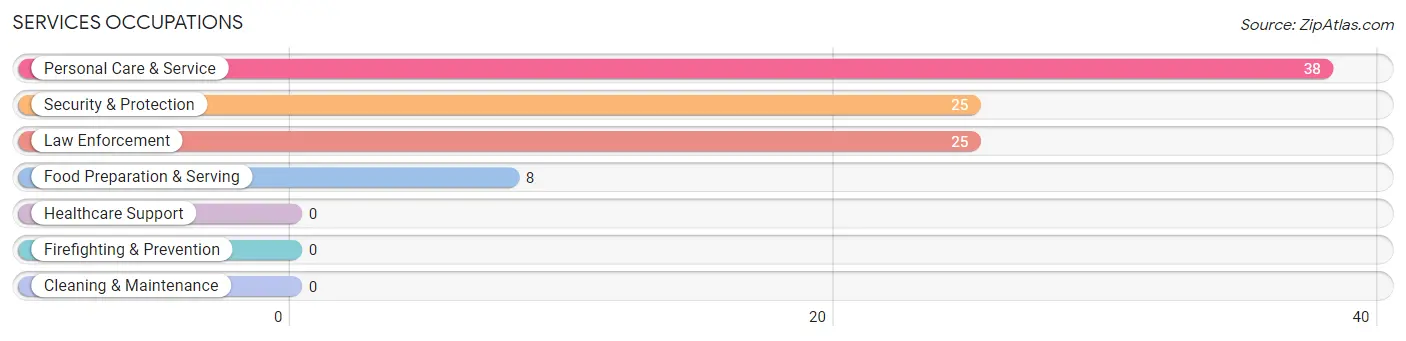
Services Occupations
The most common Services occupations in Seabrook are Personal Care & Service (38 | 10.4%), Security & Protection (25 | 6.8%), Law Enforcement (25 | 6.8%), and Food Preparation & Serving (8 | 2.2%).
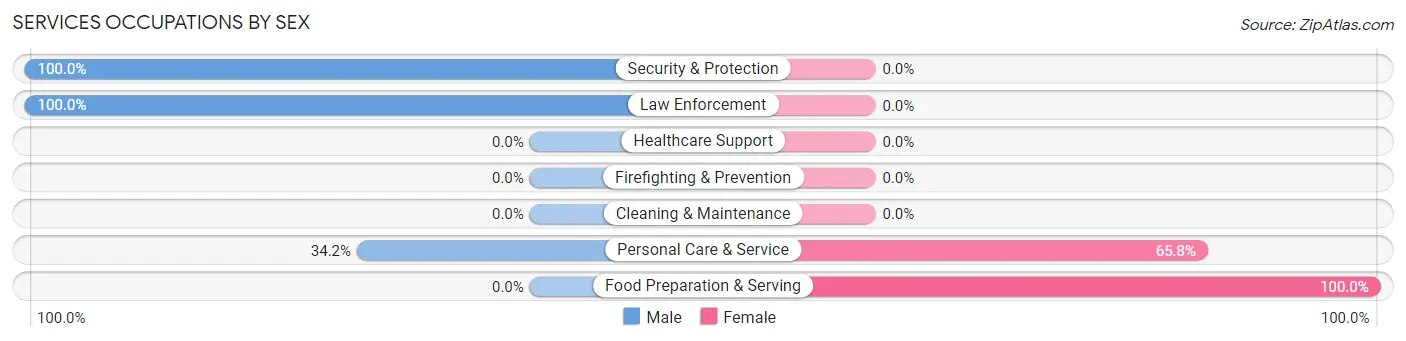
Services Occupations by Sex
Within the Services occupations in Seabrook, the most male-oriented occupations are Security & Protection (100.0%), Law Enforcement (100.0%), and Personal Care & Service (34.2%), while the most female-oriented occupations are Food Preparation & Serving (100.0%), and Personal Care & Service (65.8%).
| Occupation | Male | Female |
| Healthcare Support | 0 (0.0%) | 0 (0.0%) |
| Security & Protection | 25 (100.0%) | 0 (0.0%) |
| Firefighting & Prevention | 0 (0.0%) | 0 (0.0%) |
| Law Enforcement | 25 (100.0%) | 0 (0.0%) |
| Food Preparation & Serving | 0 (0.0%) | 8 (100.0%) |
| Cleaning & Maintenance | 0 (0.0%) | 0 (0.0%) |
| Personal Care & Service | 13 (34.2%) | 25 (65.8%) |
| Total (Category) | 38 (53.5%) | 33 (46.5%) |
| Total (Overall) | 188 (51.4%) | 178 (48.6%) |
Sales and Office Occupations
The most common Sales and Office occupations in Seabrook are Office & Administration (53 | 14.5%), and Sales & Related (21 | 5.7%).
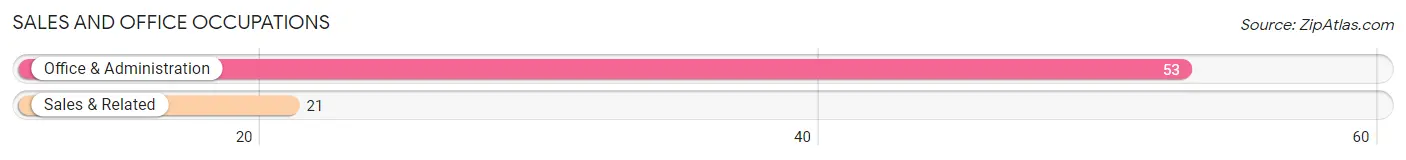
Sales and Office Occupations by Sex
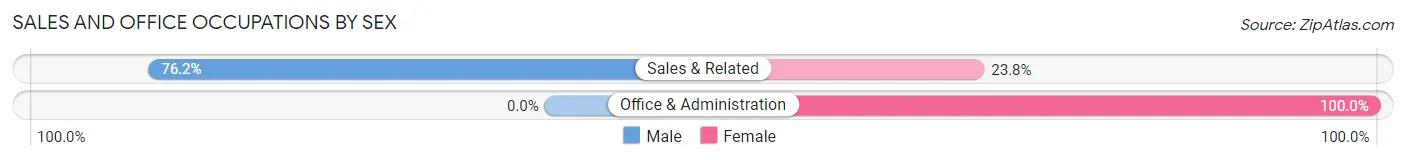
| Occupation | Male | Female |
| Sales & Related | 16 (76.2%) | 5 (23.8%) |
| Office & Administration | 0 (0.0%) | 53 (100.0%) |
| Total (Category) | 16 (21.6%) | 58 (78.4%) |
| Total (Overall) | 188 (51.4%) | 178 (48.6%) |
Natural Resources, Construction and Maintenance Occupations
The most common Natural Resources, Construction and Maintenance occupations in Seabrook are Construction & Extraction (37 | 10.1%), and Installation, Maintenance & Repair (4 | 1.1%).
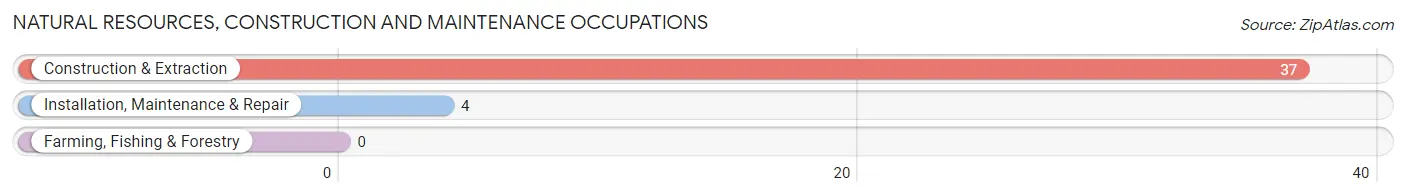
Natural Resources, Construction and Maintenance Occupations by Sex
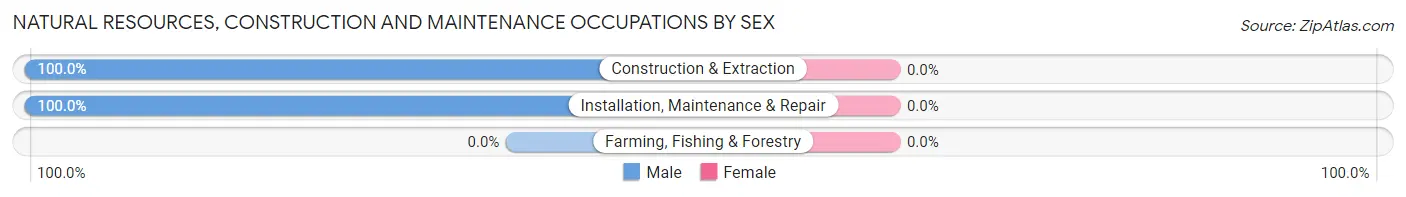
| Occupation | Male | Female |
| Farming, Fishing & Forestry | 0 (0.0%) | 0 (0.0%) |
| Construction & Extraction | 37 (100.0%) | 0 (0.0%) |
| Installation, Maintenance & Repair | 4 (100.0%) | 0 (0.0%) |
| Total (Category) | 41 (100.0%) | 0 (0.0%) |
| Total (Overall) | 188 (51.4%) | 178 (48.6%) |
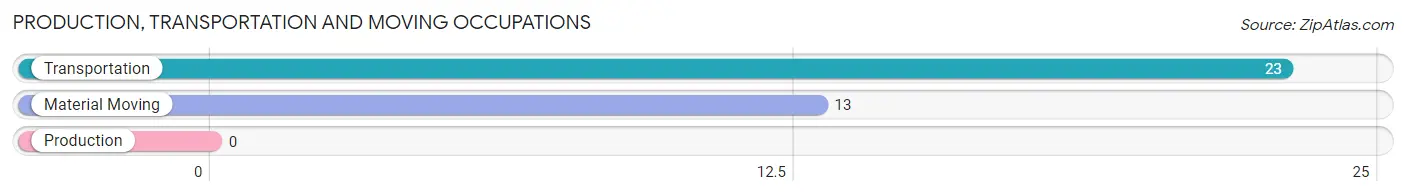
Production, Transportation and Moving Occupations
The most common Production, Transportation and Moving occupations in Seabrook are Transportation (23 | 6.3%), and Material Moving (13 | 3.5%).
Production, Transportation and Moving Occupations by Sex
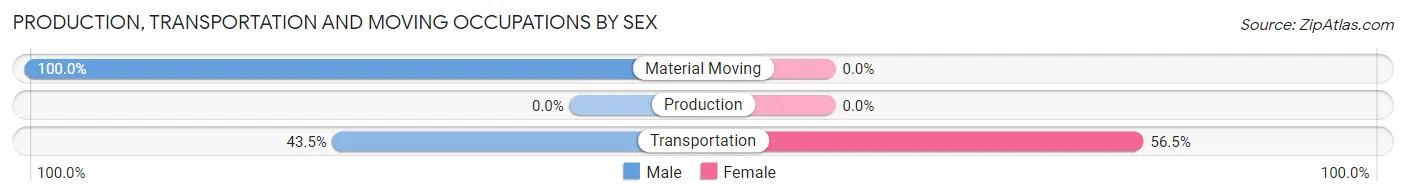
| Occupation | Male | Female |
| Production | 0 (0.0%) | 0 (0.0%) |
| Transportation | 10 (43.5%) | 13 (56.5%) |
| Material Moving | 13 (100.0%) | 0 (0.0%) |
| Total (Category) | 23 (63.9%) | 13 (36.1%) |
| Total (Overall) | 188 (51.4%) | 178 (48.6%) |
Employment Industries by Sex in Seabrook
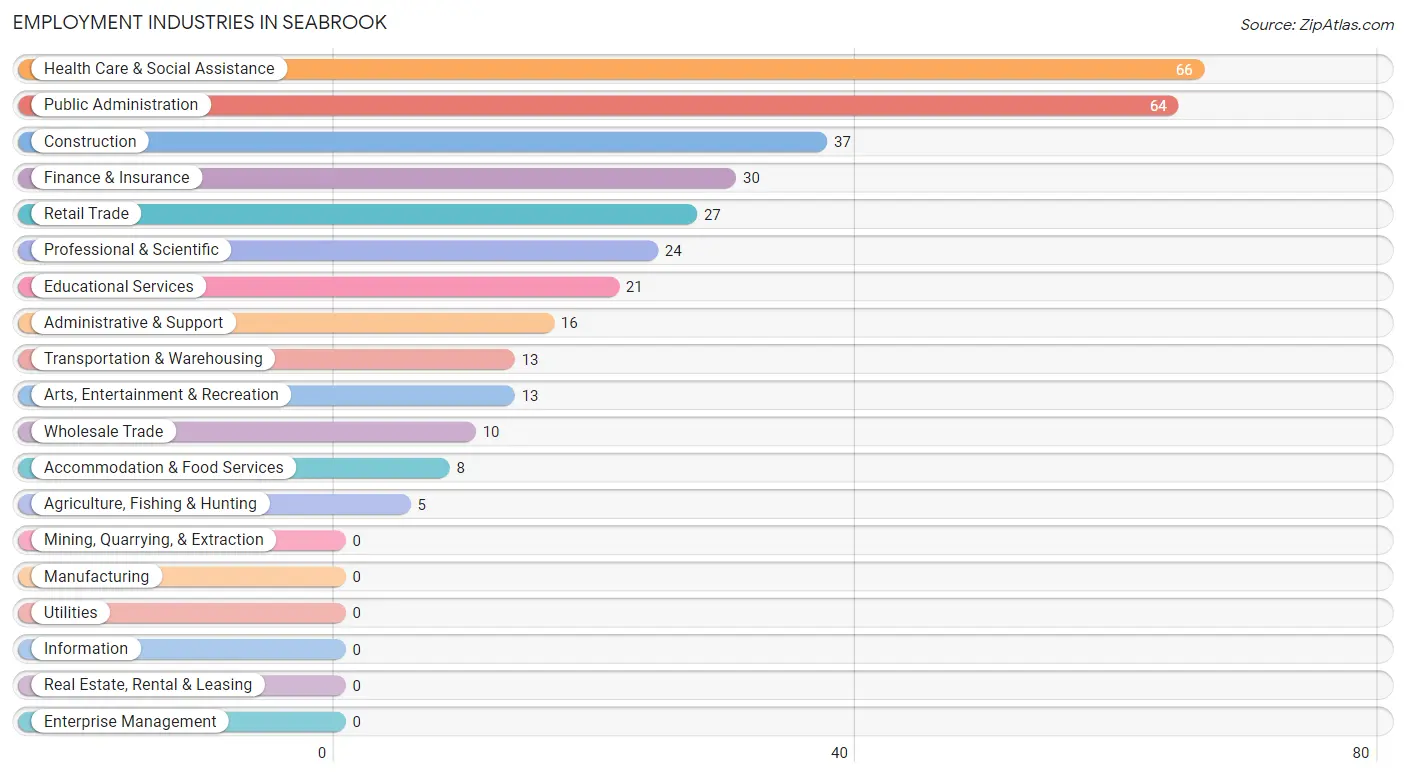
Employment Industries in Seabrook
The major employment industries in Seabrook include Health Care & Social Assistance (66 | 18.0%), Public Administration (64 | 17.5%), Construction (37 | 10.1%), Finance & Insurance (30 | 8.2%), and Retail Trade (27 | 7.4%).
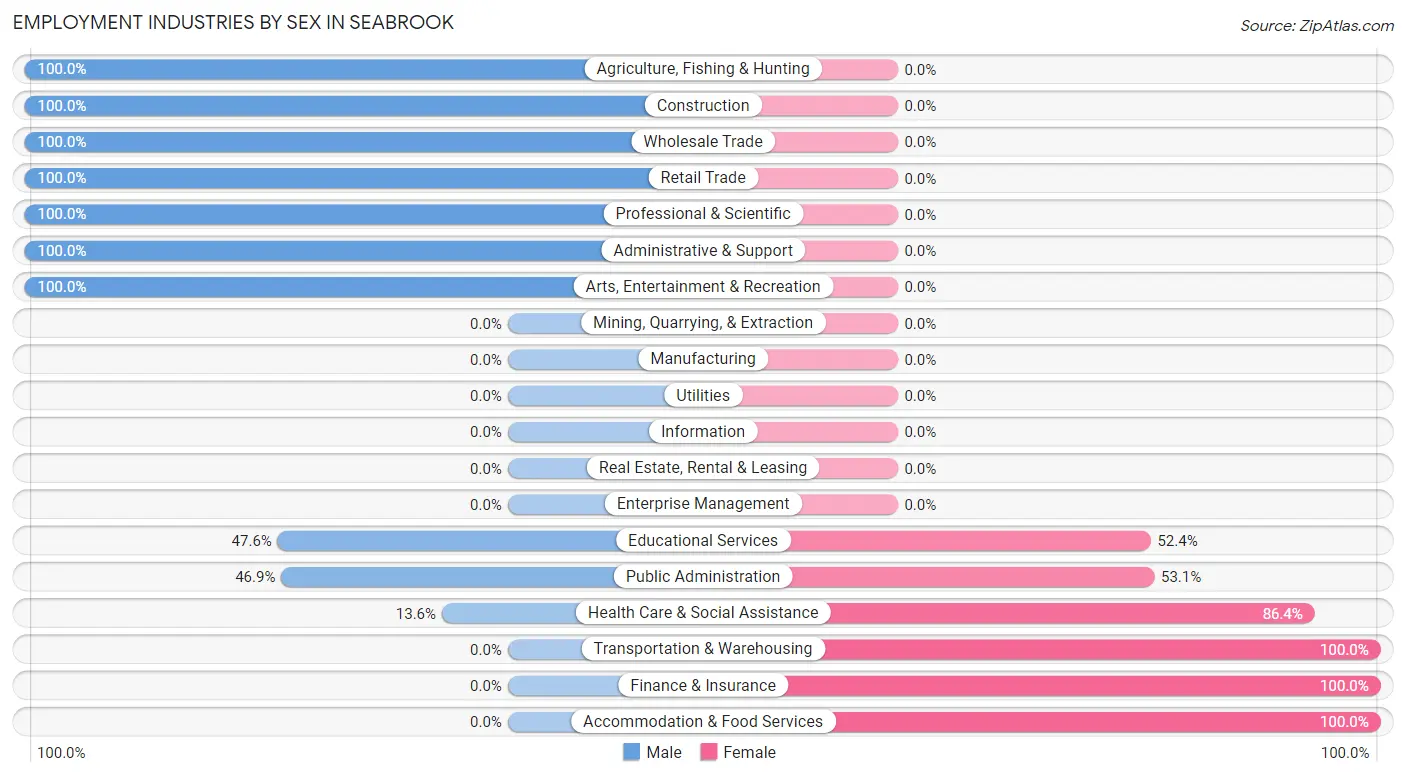
Employment Industries by Sex in Seabrook
The Seabrook industries that see more men than women are Agriculture, Fishing & Hunting (100.0%), Construction (100.0%), and Wholesale Trade (100.0%), whereas the industries that tend to have a higher number of women are Transportation & Warehousing (100.0%), Finance & Insurance (100.0%), and Accommodation & Food Services (100.0%).
| Industry | Male | Female |
| Agriculture, Fishing & Hunting | 5 (100.0%) | 0 (0.0%) |
| Mining, Quarrying, & Extraction | 0 (0.0%) | 0 (0.0%) |
| Construction | 37 (100.0%) | 0 (0.0%) |
| Manufacturing | 0 (0.0%) | 0 (0.0%) |
| Wholesale Trade | 10 (100.0%) | 0 (0.0%) |
| Retail Trade | 27 (100.0%) | 0 (0.0%) |
| Transportation & Warehousing | 0 (0.0%) | 13 (100.0%) |
| Utilities | 0 (0.0%) | 0 (0.0%) |
| Information | 0 (0.0%) | 0 (0.0%) |
| Finance & Insurance | 0 (0.0%) | 30 (100.0%) |
| Real Estate, Rental & Leasing | 0 (0.0%) | 0 (0.0%) |
| Professional & Scientific | 24 (100.0%) | 0 (0.0%) |
| Enterprise Management | 0 (0.0%) | 0 (0.0%) |
| Administrative & Support | 16 (100.0%) | 0 (0.0%) |
| Educational Services | 10 (47.6%) | 11 (52.4%) |
| Health Care & Social Assistance | 9 (13.6%) | 57 (86.4%) |
| Arts, Entertainment & Recreation | 13 (100.0%) | 0 (0.0%) |
| Accommodation & Food Services | 0 (0.0%) | 8 (100.0%) |
| Public Administration | 30 (46.9%) | 34 (53.1%) |
| Total | 188 (51.4%) | 178 (48.6%) |
Education in Seabrook
School Enrollment in Seabrook
The most common levels of schooling among the 90 students in Seabrook are college / undergraduate (42 | 46.7%), middle school (20 | 22.2%), and nursery / preschool (13 | 14.4%).
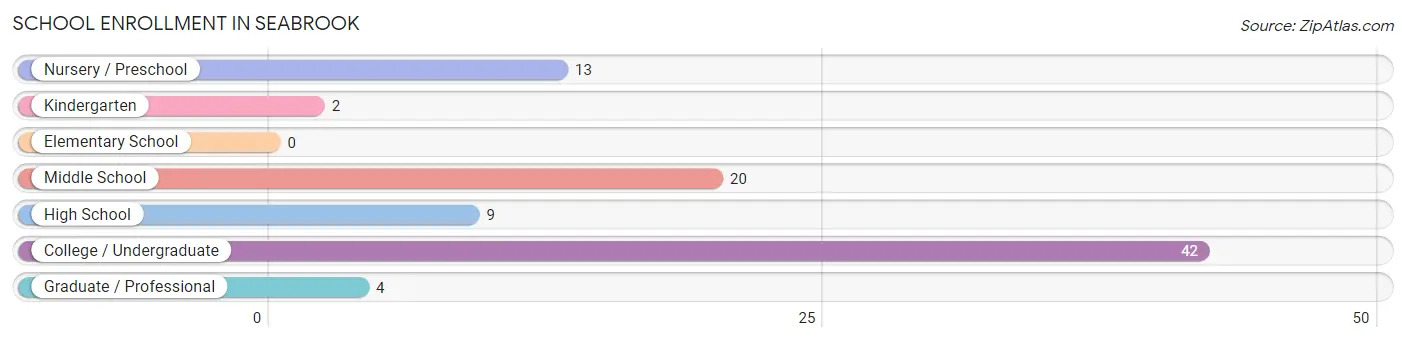
| School Level | # Students | % Students |
| Nursery / Preschool | 13 | 14.4% |
| Kindergarten | 2 | 2.2% |
| Elementary School | 0 | 0.0% |
| Middle School | 20 | 22.2% |
| High School | 9 | 10.0% |
| College / Undergraduate | 42 | 46.7% |
| Graduate / Professional | 4 | 4.4% |
| Total | 90 | 100.0% |
School Enrollment by Age by Funding Source in Seabrook
Out of a total of 90 students who are enrolled in schools in Seabrook, 35 (38.9%) attend a private institution, while the remaining 55 (61.1%) are enrolled in public schools. The age group of 18 to 19 year olds has the highest likelihood of being enrolled in private schools, with 8 (100.0% in the age bracket) enrolled. Conversely, the age group of 5 to 9 year old has the lowest likelihood of being enrolled in a private school, with 5 (100.0% in the age bracket) attending a public institution.
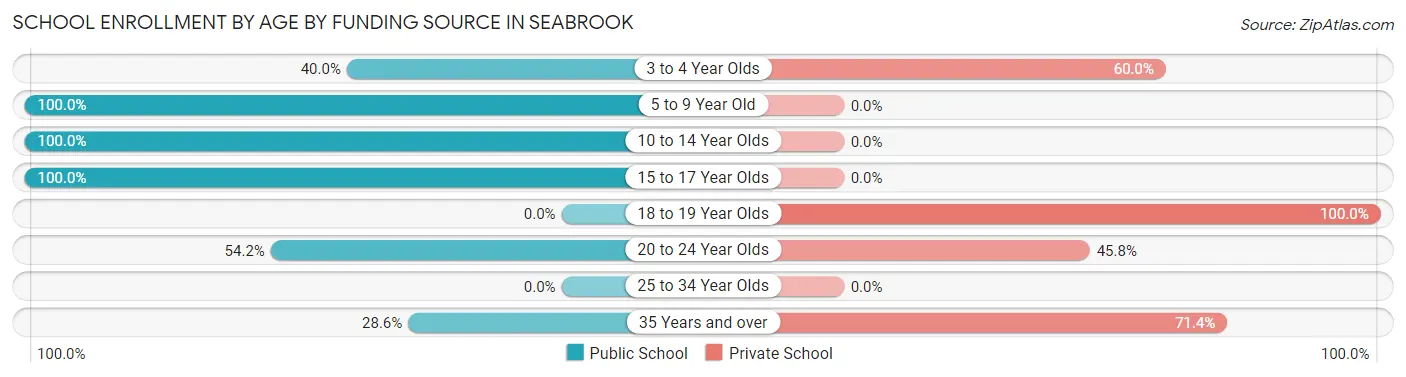
| Age Bracket | Public School | Private School |
| 3 to 4 Year Olds | 4 (40.0%) | 6 (60.0%) |
| 5 to 9 Year Old | 5 (100.0%) | 0 (0.0%) |
| 10 to 14 Year Olds | 20 (100.0%) | 0 (0.0%) |
| 15 to 17 Year Olds | 9 (100.0%) | 0 (0.0%) |
| 18 to 19 Year Olds | 0 (0.0%) | 8 (100.0%) |
| 20 to 24 Year Olds | 13 (54.2%) | 11 (45.8%) |
| 25 to 34 Year Olds | 0 (0.0%) | 0 (0.0%) |
| 35 Years and over | 4 (28.6%) | 10 (71.4%) |
| Total | 55 (61.1%) | 35 (38.9%) |
Educational Attainment by Field of Study in Seabrook
Business (70 | 25.8%), literature & languages (48 | 17.7%), social sciences (38 | 14.0%), education (20 | 7.4%), and communications (17 | 6.3%) are the most common fields of study among 271 individuals in Seabrook who have obtained a bachelor's degree or higher.
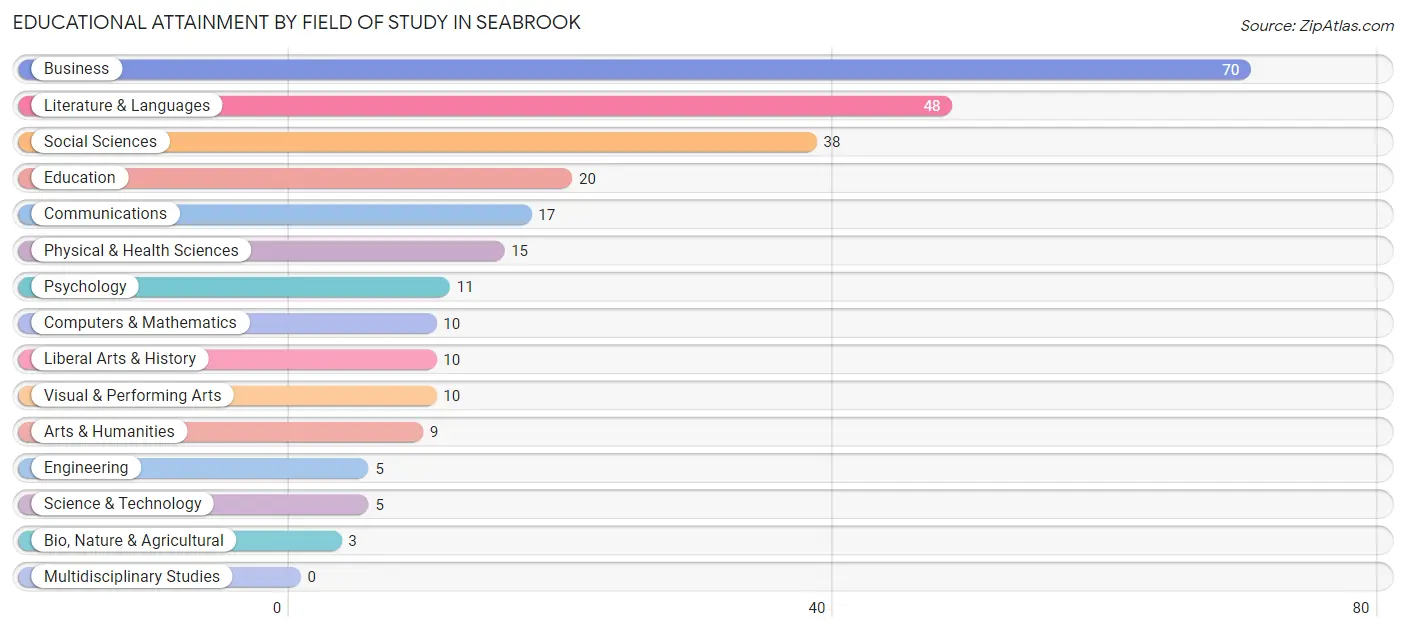
| Field of Study | # Graduates | % Graduates |
| Computers & Mathematics | 10 | 3.7% |
| Bio, Nature & Agricultural | 3 | 1.1% |
| Physical & Health Sciences | 15 | 5.5% |
| Psychology | 11 | 4.1% |
| Social Sciences | 38 | 14.0% |
| Engineering | 5 | 1.8% |
| Multidisciplinary Studies | 0 | 0.0% |
| Science & Technology | 5 | 1.8% |
| Business | 70 | 25.8% |
| Education | 20 | 7.4% |
| Literature & Languages | 48 | 17.7% |
| Liberal Arts & History | 10 | 3.7% |
| Visual & Performing Arts | 10 | 3.7% |
| Communications | 17 | 6.3% |
| Arts & Humanities | 9 | 3.3% |
| Total | 271 | 100.0% |
Transportation & Commute in Seabrook
Vehicle Availability by Sex in Seabrook
The most prevalent vehicle ownership categories in Seabrook are males with 2 vehicles (62, accounting for 33.0%) and females with 2 vehicles (75, making up 37.6%).
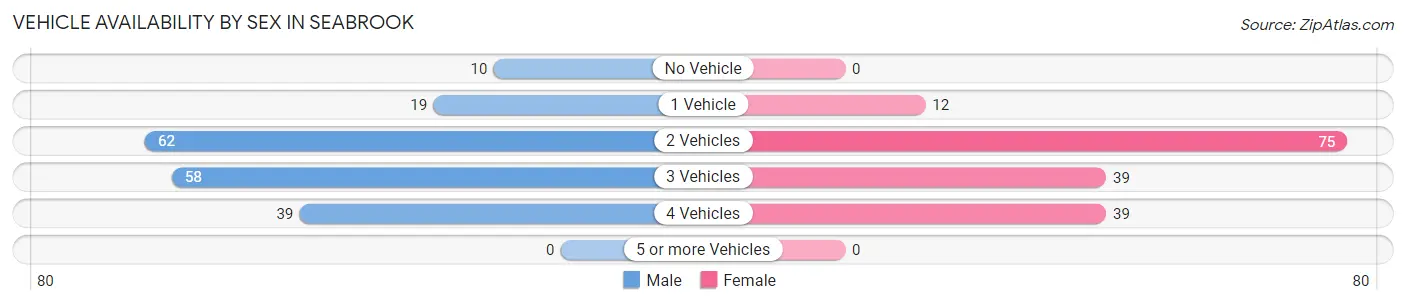
| Vehicles Available | Male | Female |
| No Vehicle | 10 (5.3%) | 0 (0.0%) |
| 1 Vehicle | 19 (10.1%) | 12 (7.3%) |
| 2 Vehicles | 62 (33.0%) | 75 (45.5%) |
| 3 Vehicles | 58 (30.8%) | 39 (23.6%) |
| 4 Vehicles | 39 (20.7%) | 39 (23.6%) |
| 5 or more Vehicles | 0 (0.0%) | 0 (0.0%) |
| Total | 188 (100.0%) | 165 (100.0%) |
Commute Time in Seabrook
The most frequently occuring commute durations in Seabrook are 15 to 19 minutes (122 commuters, 37.5%), 20 to 24 minutes (69 commuters, 21.2%), and 90 or more minutes (27 commuters, 8.3%).
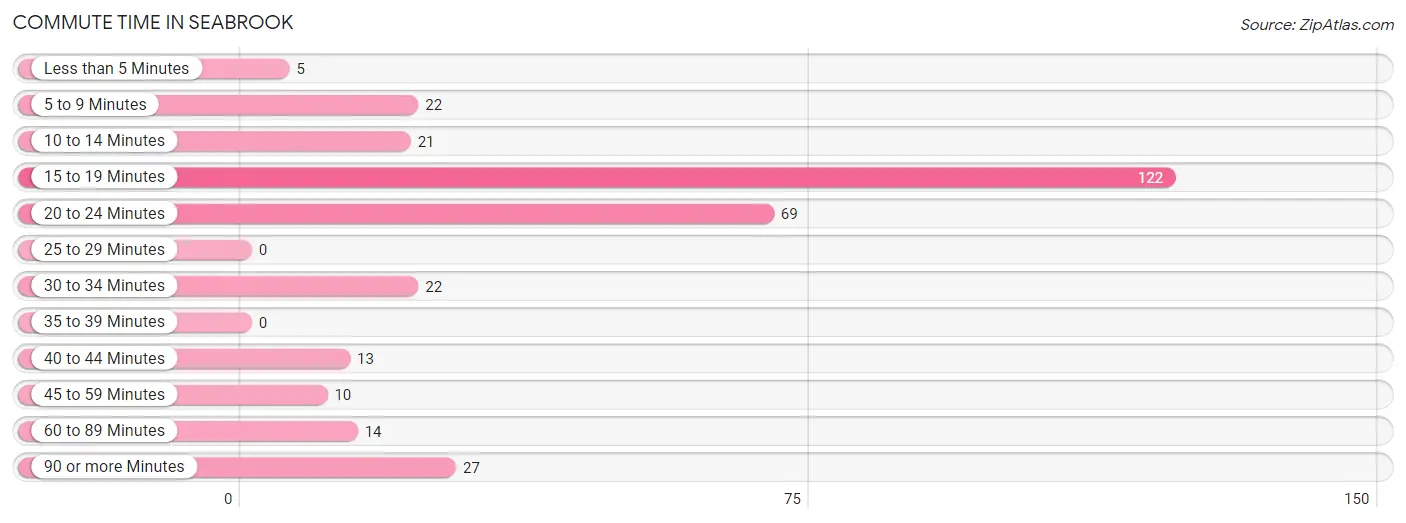
| Commute Time | # Commuters | % Commuters |
| Less than 5 Minutes | 5 | 1.5% |
| 5 to 9 Minutes | 22 | 6.8% |
| 10 to 14 Minutes | 21 | 6.5% |
| 15 to 19 Minutes | 122 | 37.5% |
| 20 to 24 Minutes | 69 | 21.2% |
| 25 to 29 Minutes | 0 | 0.0% |
| 30 to 34 Minutes | 22 | 6.8% |
| 35 to 39 Minutes | 0 | 0.0% |
| 40 to 44 Minutes | 13 | 4.0% |
| 45 to 59 Minutes | 10 | 3.1% |
| 60 to 89 Minutes | 14 | 4.3% |
| 90 or more Minutes | 27 | 8.3% |
Commute Time by Sex in Seabrook
The most common commute times in Seabrook are 15 to 19 minutes (50 commuters, 29.9%) for males and 15 to 19 minutes (72 commuters, 45.6%) for females.
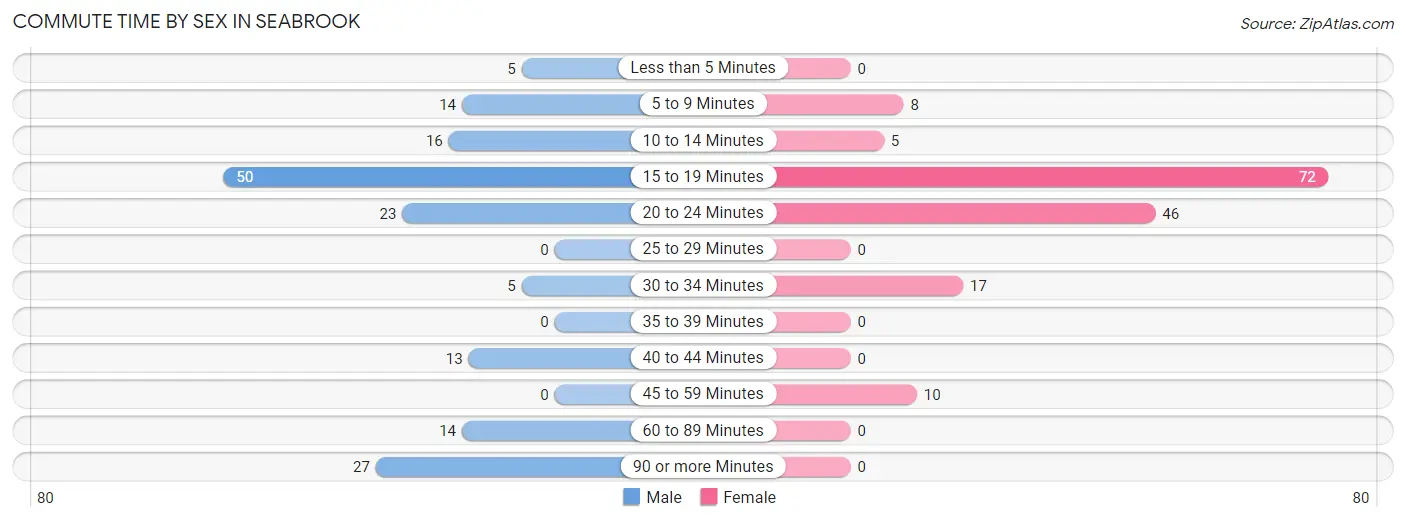
| Commute Time | Male | Female |
| Less than 5 Minutes | 5 (3.0%) | 0 (0.0%) |
| 5 to 9 Minutes | 14 (8.4%) | 8 (5.1%) |
| 10 to 14 Minutes | 16 (9.6%) | 5 (3.2%) |
| 15 to 19 Minutes | 50 (29.9%) | 72 (45.6%) |
| 20 to 24 Minutes | 23 (13.8%) | 46 (29.1%) |
| 25 to 29 Minutes | 0 (0.0%) | 0 (0.0%) |
| 30 to 34 Minutes | 5 (3.0%) | 17 (10.8%) |
| 35 to 39 Minutes | 0 (0.0%) | 0 (0.0%) |
| 40 to 44 Minutes | 13 (7.8%) | 0 (0.0%) |
| 45 to 59 Minutes | 0 (0.0%) | 10 (6.3%) |
| 60 to 89 Minutes | 14 (8.4%) | 0 (0.0%) |
| 90 or more Minutes | 27 (16.2%) | 0 (0.0%) |
Time of Departure to Work by Sex in Seabrook
The most frequent times of departure to work in Seabrook are 12:00 AM to 4:59 AM (66, 39.5%) for males and 8:00 AM to 8:29 AM (108, 68.3%) for females.
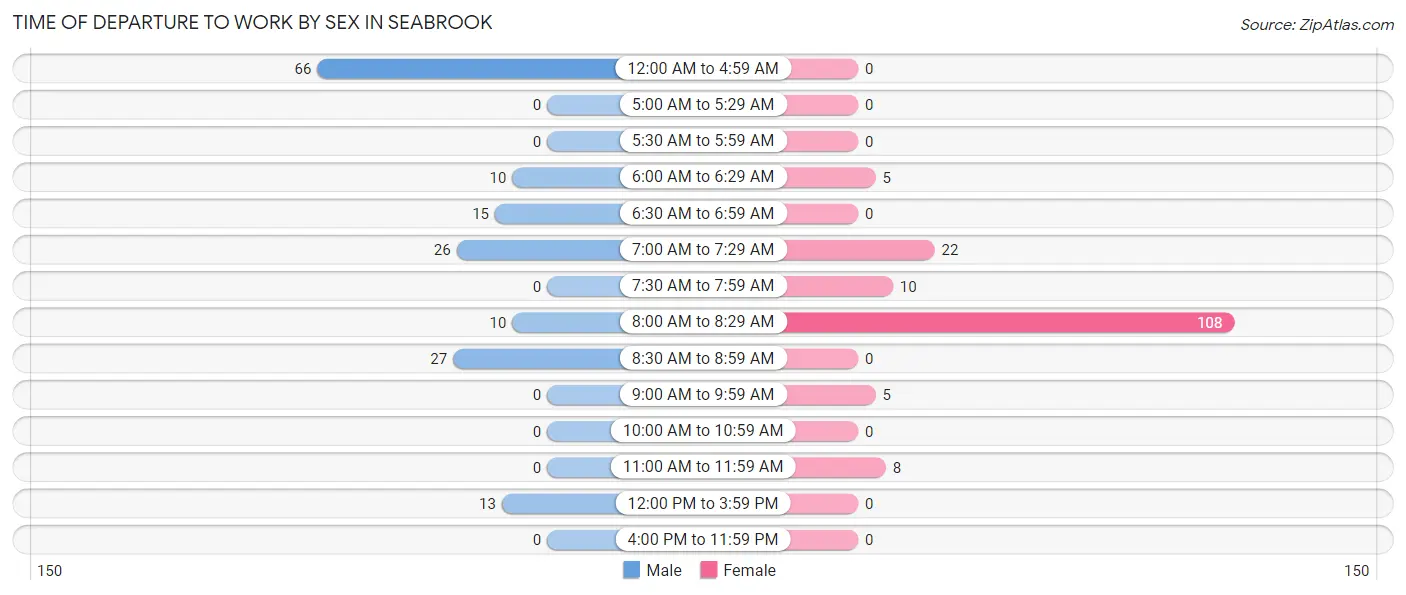
| Time of Departure | Male | Female |
| 12:00 AM to 4:59 AM | 66 (39.5%) | 0 (0.0%) |
| 5:00 AM to 5:29 AM | 0 (0.0%) | 0 (0.0%) |
| 5:30 AM to 5:59 AM | 0 (0.0%) | 0 (0.0%) |
| 6:00 AM to 6:29 AM | 10 (6.0%) | 5 (3.2%) |
| 6:30 AM to 6:59 AM | 15 (9.0%) | 0 (0.0%) |
| 7:00 AM to 7:29 AM | 26 (15.6%) | 22 (13.9%) |
| 7:30 AM to 7:59 AM | 0 (0.0%) | 10 (6.3%) |
| 8:00 AM to 8:29 AM | 10 (6.0%) | 108 (68.3%) |
| 8:30 AM to 8:59 AM | 27 (16.2%) | 0 (0.0%) |
| 9:00 AM to 9:59 AM | 0 (0.0%) | 5 (3.2%) |
| 10:00 AM to 10:59 AM | 0 (0.0%) | 0 (0.0%) |
| 11:00 AM to 11:59 AM | 0 (0.0%) | 8 (5.1%) |
| 12:00 PM to 3:59 PM | 13 (7.8%) | 0 (0.0%) |
| 4:00 PM to 11:59 PM | 0 (0.0%) | 0 (0.0%) |
| Total | 167 (100.0%) | 158 (100.0%) |
Housing Occupancy in Seabrook
Occupancy by Ownership in Seabrook
Of the total 244 dwellings in Seabrook, owner-occupied units account for 234 (95.9%), while renter-occupied units make up 10 (4.1%).
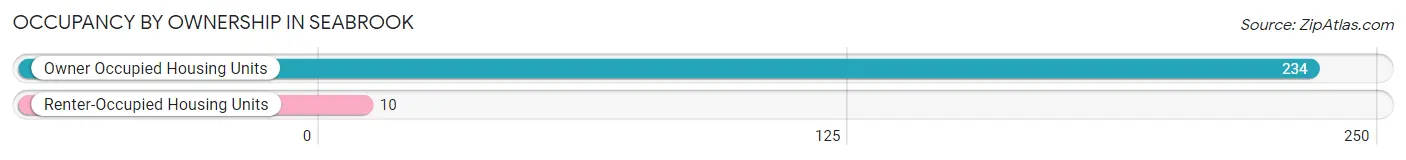
| Occupancy | # Housing Units | % Housing Units |
| Owner Occupied Housing Units | 234 | 95.9% |
| Renter-Occupied Housing Units | 10 | 4.1% |
| Total Occupied Housing Units | 244 | 100.0% |
Occupancy by Household Size in Seabrook
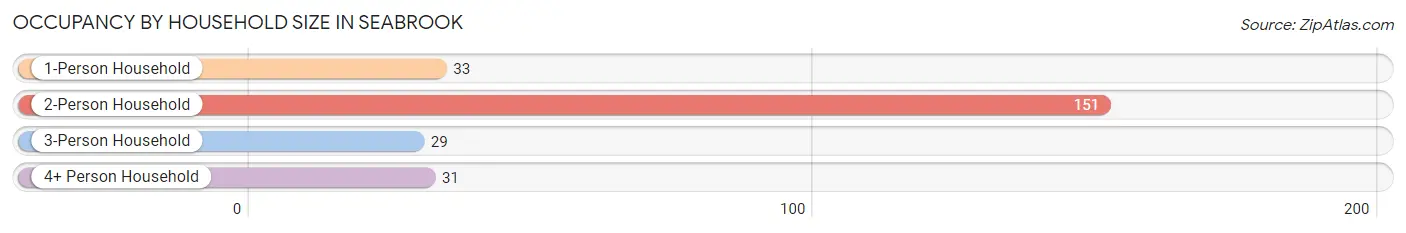
| Household Size | # Housing Units | % Housing Units |
| 1-Person Household | 33 | 13.5% |
| 2-Person Household | 151 | 61.9% |
| 3-Person Household | 29 | 11.9% |
| 4+ Person Household | 31 | 12.7% |
| Total Housing Units | 244 | 100.0% |
Occupancy by Ownership by Household Size in Seabrook
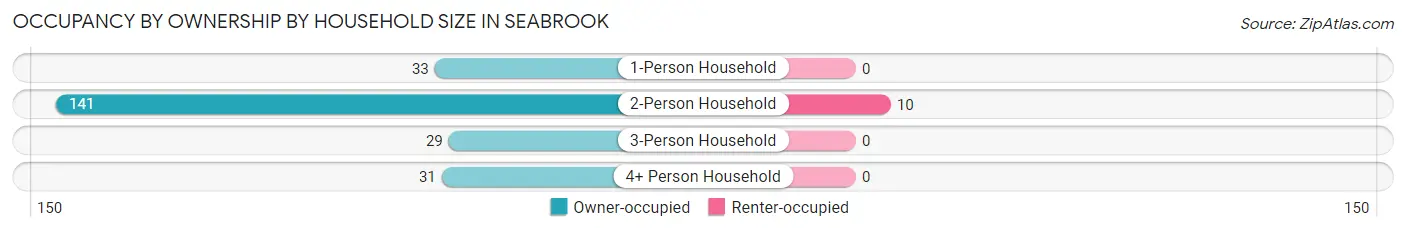
| Household Size | Owner-occupied | Renter-occupied |
| 1-Person Household | 33 (100.0%) | 0 (0.0%) |
| 2-Person Household | 141 (93.4%) | 10 (6.6%) |
| 3-Person Household | 29 (100.0%) | 0 (0.0%) |
| 4+ Person Household | 31 (100.0%) | 0 (0.0%) |
| Total Housing Units | 234 (95.9%) | 10 (4.1%) |
Occupancy by Educational Attainment in Seabrook
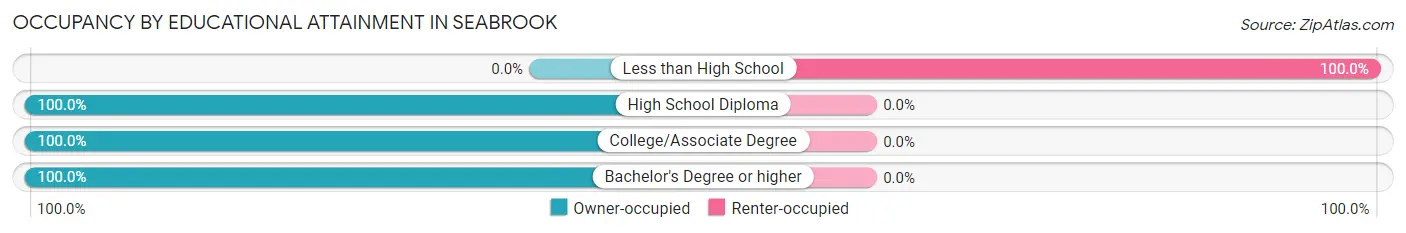
| Household Size | Owner-occupied | Renter-occupied |
| Less than High School | 0 (0.0%) | 10 (100.0%) |
| High School Diploma | 25 (100.0%) | 0 (0.0%) |
| College/Associate Degree | 55 (100.0%) | 0 (0.0%) |
| Bachelor's Degree or higher | 154 (100.0%) | 0 (0.0%) |
Occupancy by Age of Householder in Seabrook
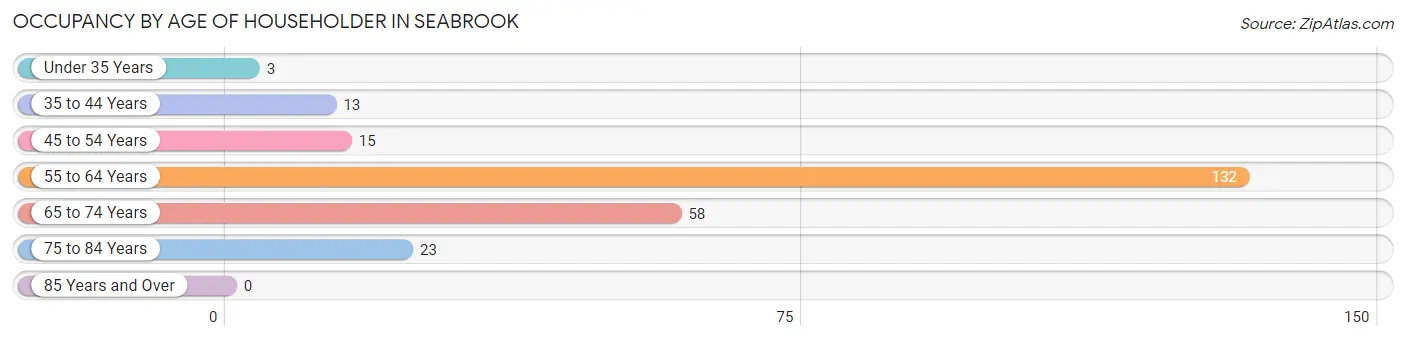
| Age Bracket | # Households | % Households |
| Under 35 Years | 3 | 1.2% |
| 35 to 44 Years | 13 | 5.3% |
| 45 to 54 Years | 15 | 6.1% |
| 55 to 64 Years | 132 | 54.1% |
| 65 to 74 Years | 58 | 23.8% |
| 75 to 84 Years | 23 | 9.4% |
| 85 Years and Over | 0 | 0.0% |
| Total | 244 | 100.0% |
Housing Finances in Seabrook
Median Income by Occupancy in Seabrook
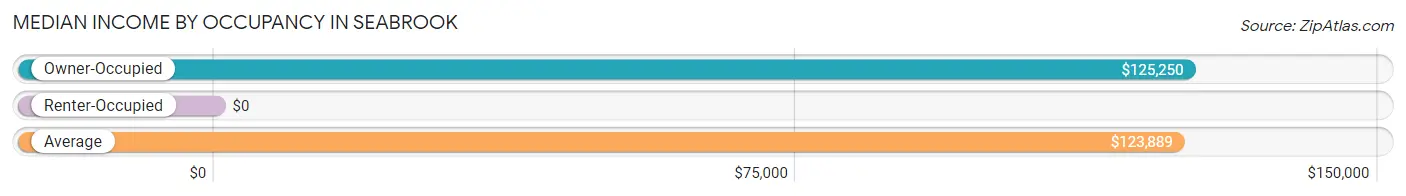
| Occupancy Type | # Households | Median Income |
| Owner-Occupied | 234 (95.9%) | $125,250 |
| Renter-Occupied | 10 (4.1%) | $0 |
| Average | 244 (100.0%) | $123,889 |
Occupancy by Householder Income Bracket in Seabrook
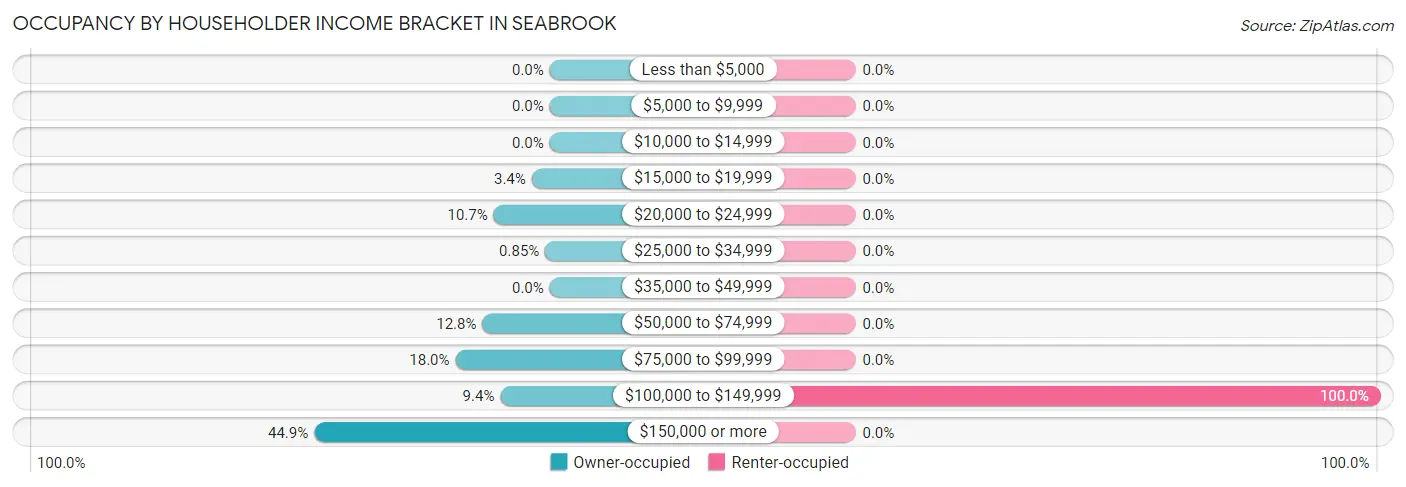
| Income Bracket | Owner-occupied | Renter-occupied |
| Less than $5,000 | 0 (0.0%) | 0 (0.0%) |
| $5,000 to $9,999 | 0 (0.0%) | 0 (0.0%) |
| $10,000 to $14,999 | 0 (0.0%) | 0 (0.0%) |
| $15,000 to $19,999 | 8 (3.4%) | 0 (0.0%) |
| $20,000 to $24,999 | 25 (10.7%) | 0 (0.0%) |
| $25,000 to $34,999 | 2 (0.9%) | 0 (0.0%) |
| $35,000 to $49,999 | 0 (0.0%) | 0 (0.0%) |
| $50,000 to $74,999 | 30 (12.8%) | 0 (0.0%) |
| $75,000 to $99,999 | 42 (17.9%) | 0 (0.0%) |
| $100,000 to $149,999 | 22 (9.4%) | 10 (100.0%) |
| $150,000 or more | 105 (44.9%) | 0 (0.0%) |
| Total | 234 (100.0%) | 10 (100.0%) |
Monthly Housing Cost Tiers in Seabrook
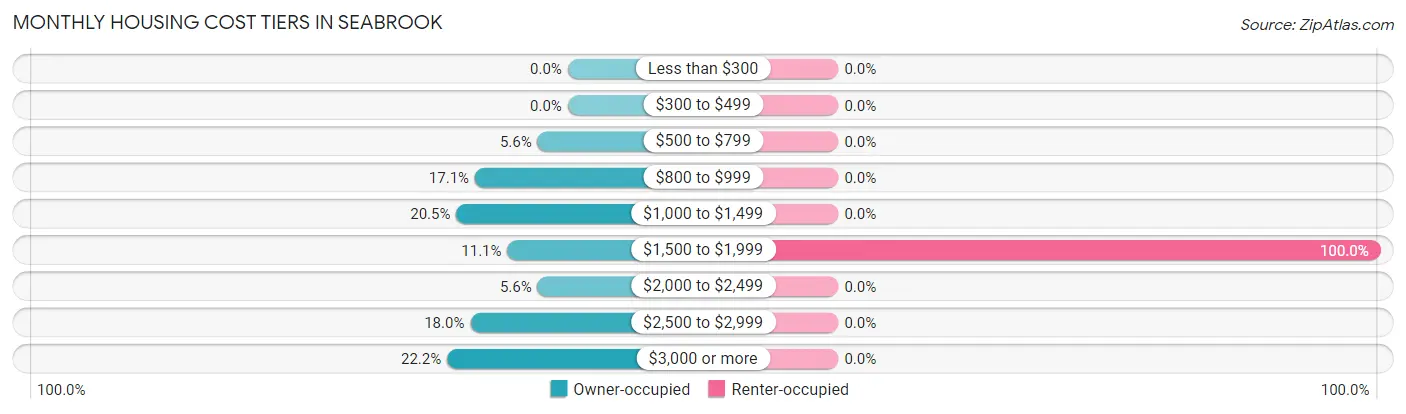
| Monthly Cost | Owner-occupied | Renter-occupied |
| Less than $300 | 0 (0.0%) | 0 (0.0%) |
| $300 to $499 | 0 (0.0%) | 0 (0.0%) |
| $500 to $799 | 13 (5.6%) | 0 (0.0%) |
| $800 to $999 | 40 (17.1%) | 0 (0.0%) |
| $1,000 to $1,499 | 48 (20.5%) | 0 (0.0%) |
| $1,500 to $1,999 | 26 (11.1%) | 10 (100.0%) |
| $2,000 to $2,499 | 13 (5.6%) | 0 (0.0%) |
| $2,500 to $2,999 | 42 (17.9%) | 0 (0.0%) |
| $3,000 or more | 52 (22.2%) | 0 (0.0%) |
| Total | 234 (100.0%) | 10 (100.0%) |
Physical Housing Characteristics in Seabrook
Housing Structures in Seabrook
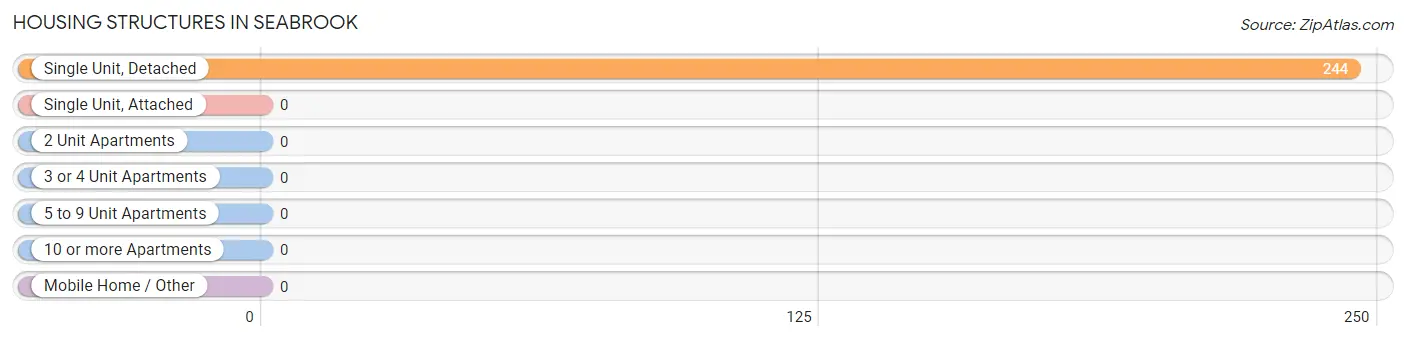
| Structure Type | # Housing Units | % Housing Units |
| Single Unit, Detached | 244 | 100.0% |
| Single Unit, Attached | 0 | 0.0% |
| 2 Unit Apartments | 0 | 0.0% |
| 3 or 4 Unit Apartments | 0 | 0.0% |
| 5 to 9 Unit Apartments | 0 | 0.0% |
| 10 or more Apartments | 0 | 0.0% |
| Mobile Home / Other | 0 | 0.0% |
| Total | 244 | 100.0% |
Housing Structures by Occupancy in Seabrook
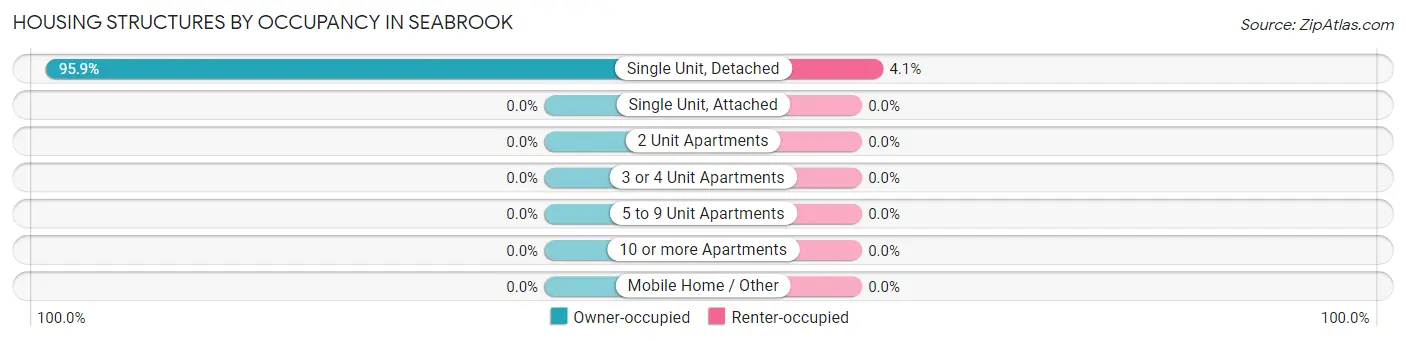
| Structure Type | Owner-occupied | Renter-occupied |
| Single Unit, Detached | 234 (95.9%) | 10 (4.1%) |
| Single Unit, Attached | 0 (0.0%) | 0 (0.0%) |
| 2 Unit Apartments | 0 (0.0%) | 0 (0.0%) |
| 3 or 4 Unit Apartments | 0 (0.0%) | 0 (0.0%) |
| 5 to 9 Unit Apartments | 0 (0.0%) | 0 (0.0%) |
| 10 or more Apartments | 0 (0.0%) | 0 (0.0%) |
| Mobile Home / Other | 0 (0.0%) | 0 (0.0%) |
| Total | 234 (95.9%) | 10 (4.1%) |
Housing Structures by Number of Rooms in Seabrook
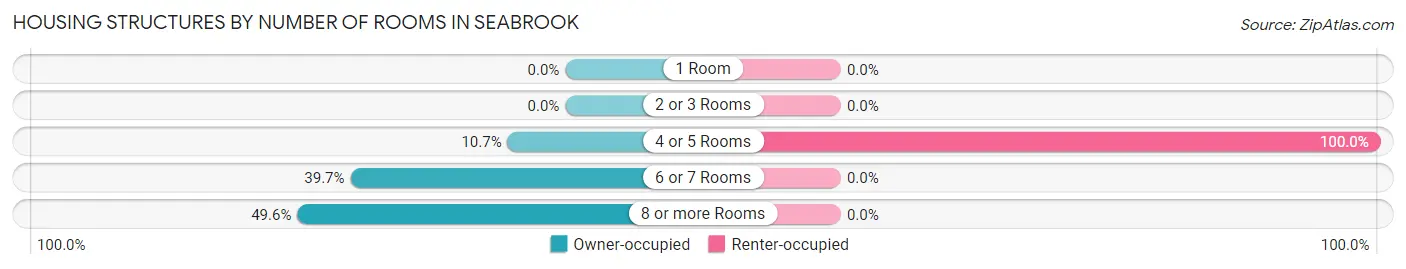
| Number of Rooms | Owner-occupied | Renter-occupied |
| 1 Room | 0 (0.0%) | 0 (0.0%) |
| 2 or 3 Rooms | 0 (0.0%) | 0 (0.0%) |
| 4 or 5 Rooms | 25 (10.7%) | 10 (100.0%) |
| 6 or 7 Rooms | 93 (39.7%) | 0 (0.0%) |
| 8 or more Rooms | 116 (49.6%) | 0 (0.0%) |
| Total | 234 (100.0%) | 10 (100.0%) |
Housing Structure by Heating Type in Seabrook
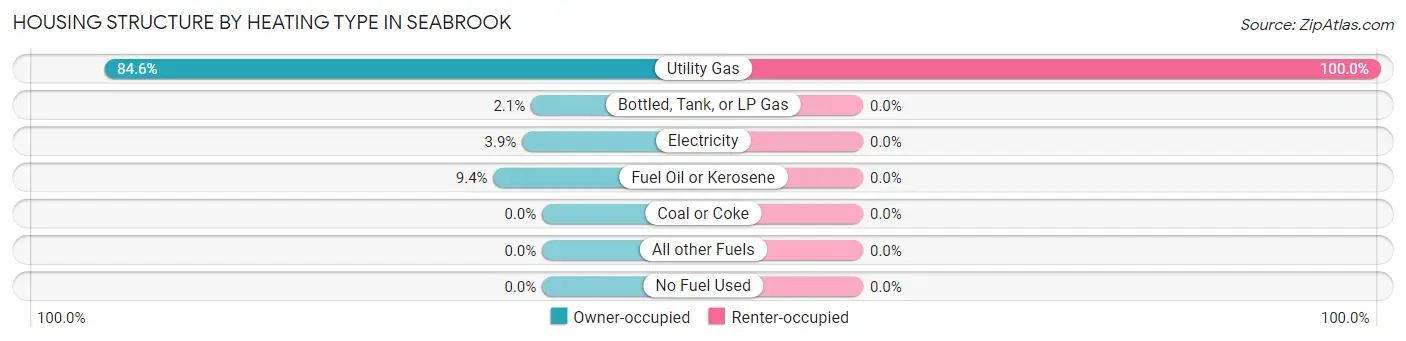
| Heating Type | Owner-occupied | Renter-occupied |
| Utility Gas | 198 (84.6%) | 10 (100.0%) |
| Bottled, Tank, or LP Gas | 5 (2.1%) | 0 (0.0%) |
| Electricity | 9 (3.8%) | 0 (0.0%) |
| Fuel Oil or Kerosene | 22 (9.4%) | 0 (0.0%) |
| Coal or Coke | 0 (0.0%) | 0 (0.0%) |
| All other Fuels | 0 (0.0%) | 0 (0.0%) |
| No Fuel Used | 0 (0.0%) | 0 (0.0%) |
| Total | 234 (100.0%) | 10 (100.0%) |
Household Vehicle Usage in Seabrook
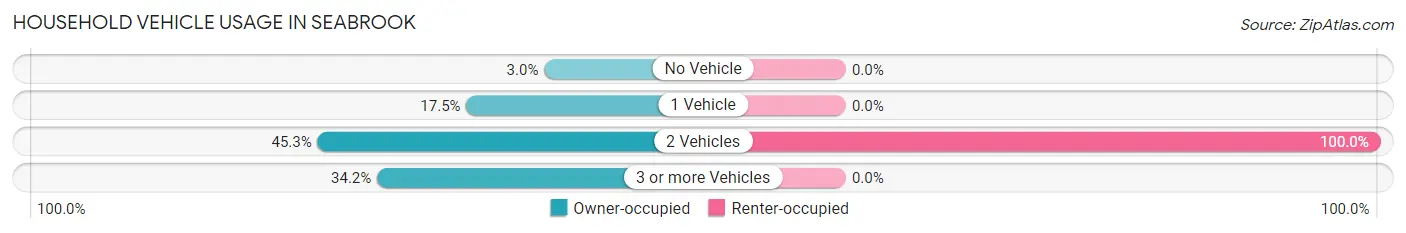
| Vehicles per Household | Owner-occupied | Renter-occupied |
| No Vehicle | 7 (3.0%) | 0 (0.0%) |
| 1 Vehicle | 41 (17.5%) | 0 (0.0%) |
| 2 Vehicles | 106 (45.3%) | 10 (100.0%) |
| 3 or more Vehicles | 80 (34.2%) | 0 (0.0%) |
| Total | 234 (100.0%) | 10 (100.0%) |
Real Estate & Mortgages in Seabrook
Real Estate and Mortgage Overview in Seabrook
| Characteristic | Without Mortgage | With Mortgage |
| Housing Units | 98 | 136 |
| Median Property Value | $647,100 | $648,700 |
| Median Household Income | $78,704 | $85 |
| Monthly Housing Costs | $973 | $52 |
| Real Estate Taxes | $4,935 | $0 |
Property Value by Mortgage Status in Seabrook
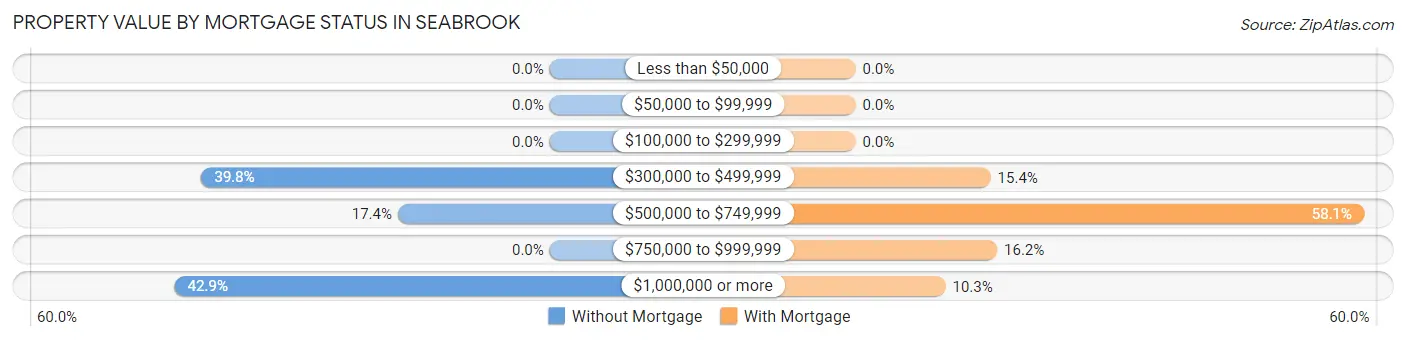
| Property Value | Without Mortgage | With Mortgage |
| Less than $50,000 | 0 (0.0%) | 0 (0.0%) |
| $50,000 to $99,999 | 0 (0.0%) | 0 (0.0%) |
| $100,000 to $299,999 | 0 (0.0%) | 0 (0.0%) |
| $300,000 to $499,999 | 39 (39.8%) | 21 (15.4%) |
| $500,000 to $749,999 | 17 (17.3%) | 79 (58.1%) |
| $750,000 to $999,999 | 0 (0.0%) | 22 (16.2%) |
| $1,000,000 or more | 42 (42.9%) | 14 (10.3%) |
| Total | 98 (100.0%) | 136 (100.0%) |
Household Income by Mortgage Status in Seabrook
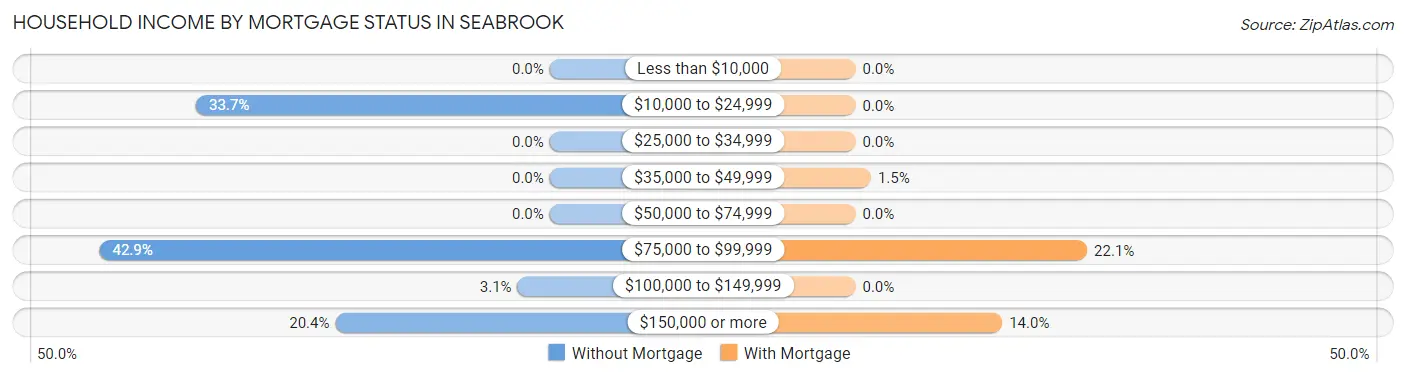
| Household Income | Without Mortgage | With Mortgage |
| Less than $10,000 | 0 (0.0%) | 0 (0.0%) |
| $10,000 to $24,999 | 33 (33.7%) | 0 (0.0%) |
| $25,000 to $34,999 | 0 (0.0%) | 0 (0.0%) |
| $35,000 to $49,999 | 0 (0.0%) | 2 (1.5%) |
| $50,000 to $74,999 | 0 (0.0%) | 0 (0.0%) |
| $75,000 to $99,999 | 42 (42.9%) | 30 (22.1%) |
| $100,000 to $149,999 | 3 (3.1%) | 0 (0.0%) |
| $150,000 or more | 20 (20.4%) | 19 (14.0%) |
| Total | 98 (100.0%) | 136 (100.0%) |
Property Value to Household Income Ratio in Seabrook
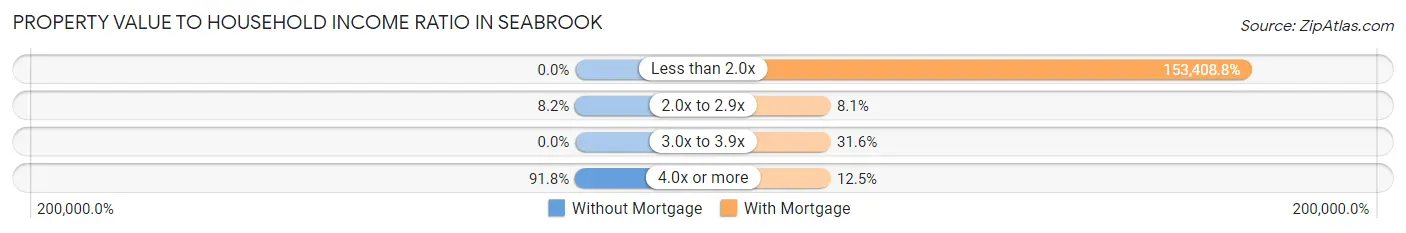
| Value-to-Income Ratio | Without Mortgage | With Mortgage |
| Less than 2.0x | 0 (0.0%) | 208,636 (153,408.8%) |
| 2.0x to 2.9x | 8 (8.2%) | 11 (8.1%) |
| 3.0x to 3.9x | 0 (0.0%) | 43 (31.6%) |
| 4.0x or more | 90 (91.8%) | 17 (12.5%) |
| Total | 98 (100.0%) | 136 (100.0%) |
Real Estate Taxes by Mortgage Status in Seabrook
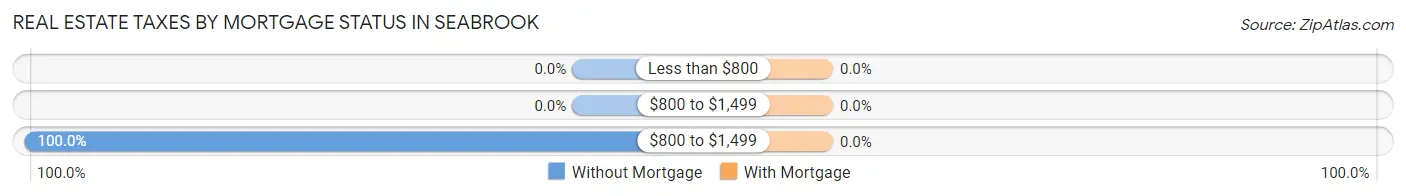
| Property Taxes | Without Mortgage | With Mortgage |
| Less than $800 | 0 (0.0%) | 0 (0.0%) |
| $800 to $1,499 | 0 (0.0%) | 0 (0.0%) |
| $800 to $1,499 | 98 (100.0%) | 0 (0.0%) |
| Total | 98 (100.0%) | 136 (100.0%) |
Health & Disability in Seabrook
Health Insurance Coverage by Age in Seabrook
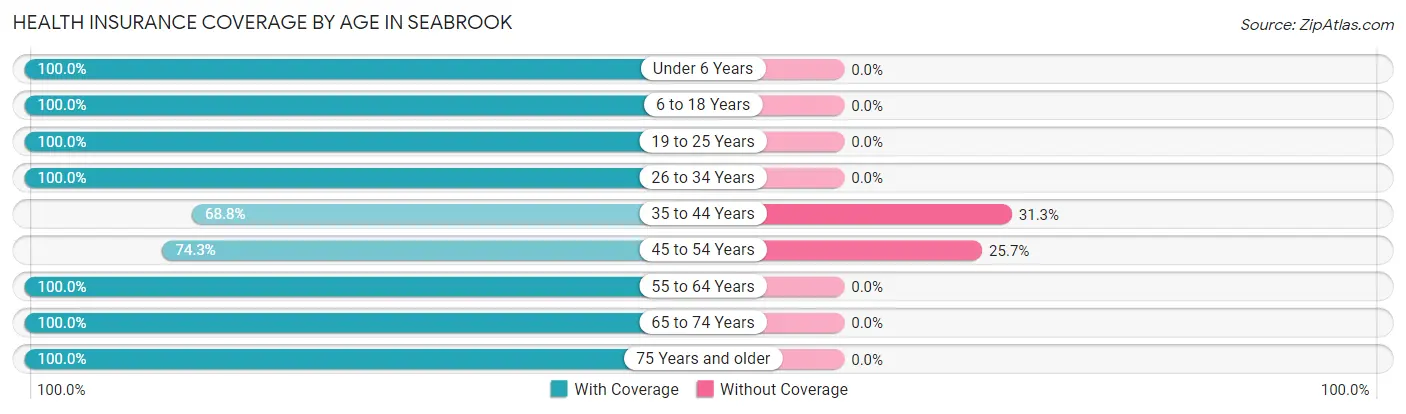
| Age Bracket | With Coverage | Without Coverage |
| Under 6 Years | 33 (100.0%) | 0 (0.0%) |
| 6 to 18 Years | 37 (100.0%) | 0 (0.0%) |
| 19 to 25 Years | 48 (100.0%) | 0 (0.0%) |
| 26 to 34 Years | 15 (100.0%) | 0 (0.0%) |
| 35 to 44 Years | 22 (68.8%) | 10 (31.2%) |
| 45 to 54 Years | 26 (74.3%) | 9 (25.7%) |
| 55 to 64 Years | 244 (100.0%) | 0 (0.0%) |
| 65 to 74 Years | 124 (100.0%) | 0 (0.0%) |
| 75 Years and older | 27 (100.0%) | 0 (0.0%) |
| Total | 576 (96.8%) | 19 (3.2%) |
Health Insurance Coverage by Citizenship Status in Seabrook
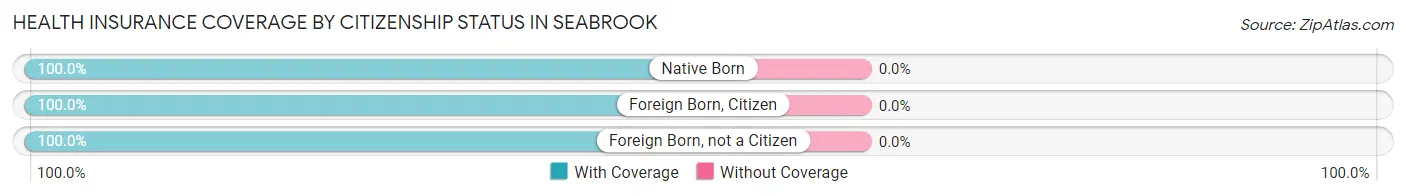
| Citizenship Status | With Coverage | Without Coverage |
| Native Born | 33 (100.0%) | 0 (0.0%) |
| Foreign Born, Citizen | 37 (100.0%) | 0 (0.0%) |
| Foreign Born, not a Citizen | 48 (100.0%) | 0 (0.0%) |
Health Insurance Coverage by Household Income in Seabrook
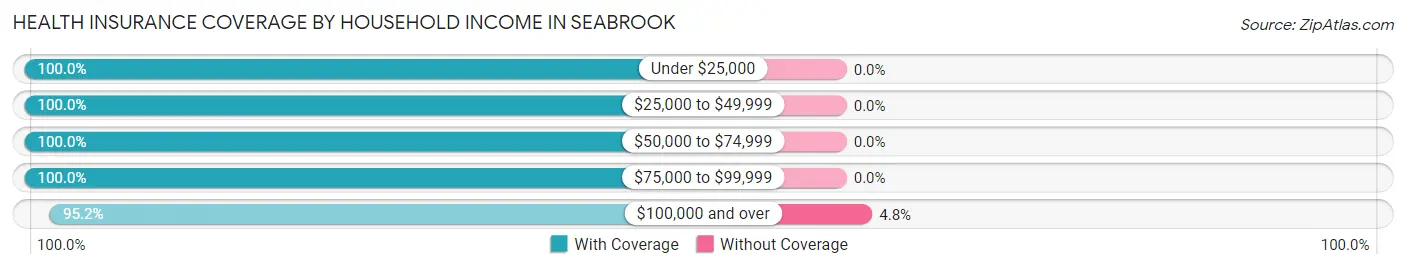
| Household Income | With Coverage | Without Coverage |
| Under $25,000 | 60 (100.0%) | 0 (0.0%) |
| $25,000 to $49,999 | 2 (100.0%) | 0 (0.0%) |
| $50,000 to $74,999 | 62 (100.0%) | 0 (0.0%) |
| $75,000 to $99,999 | 74 (100.0%) | 0 (0.0%) |
| $100,000 and over | 378 (95.2%) | 19 (4.8%) |
Public vs Private Health Insurance Coverage by Age in Seabrook
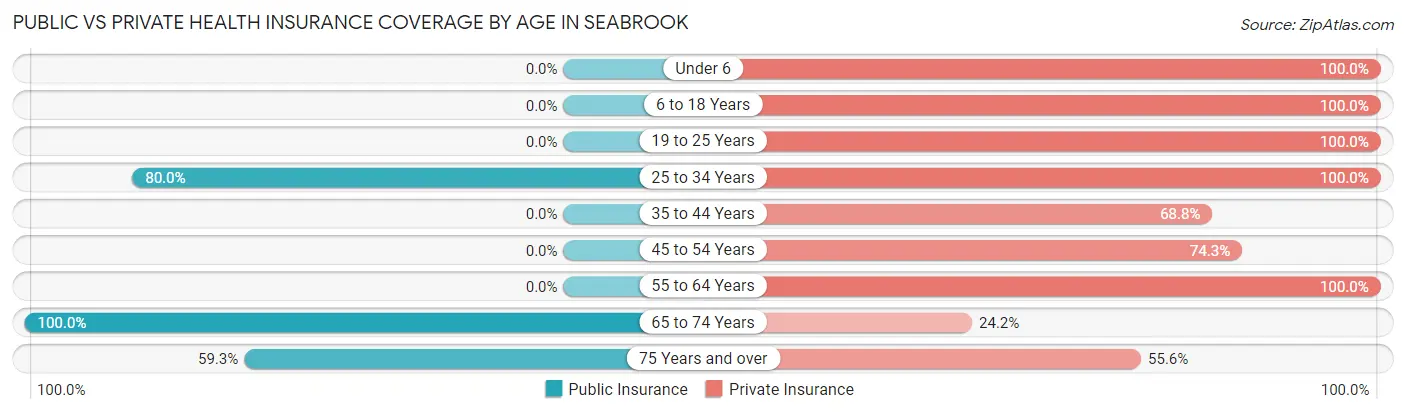
| Age Bracket | Public Insurance | Private Insurance |
| Under 6 | 0 (0.0%) | 33 (100.0%) |
| 6 to 18 Years | 0 (0.0%) | 37 (100.0%) |
| 19 to 25 Years | 0 (0.0%) | 48 (100.0%) |
| 25 to 34 Years | 12 (80.0%) | 15 (100.0%) |
| 35 to 44 Years | 0 (0.0%) | 22 (68.8%) |
| 45 to 54 Years | 0 (0.0%) | 26 (74.3%) |
| 55 to 64 Years | 0 (0.0%) | 244 (100.0%) |
| 65 to 74 Years | 124 (100.0%) | 30 (24.2%) |
| 75 Years and over | 16 (59.3%) | 15 (55.6%) |
| Total | 152 (25.6%) | 470 (79.0%) |
Disability Status by Sex by Age in Seabrook
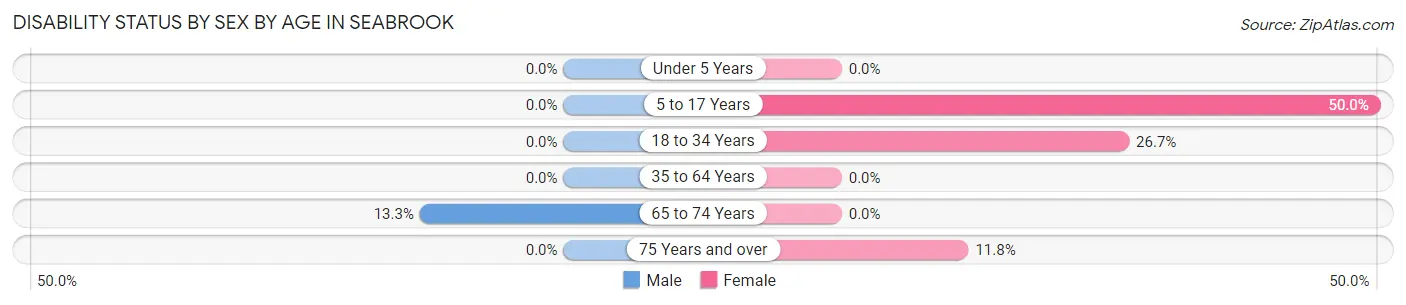
| Age Bracket | Male | Female |
| Under 5 Years | 0 (0.0%) | 0 (0.0%) |
| 5 to 17 Years | 0 (0.0%) | 9 (50.0%) |
| 18 to 34 Years | 0 (0.0%) | 12 (26.7%) |
| 35 to 64 Years | 0 (0.0%) | 0 (0.0%) |
| 65 to 74 Years | 10 (13.3%) | 0 (0.0%) |
| 75 Years and over | 0 (0.0%) | 2 (11.8%) |
Disability Class by Sex by Age in Seabrook
Disability Class: Hearing Difficulty
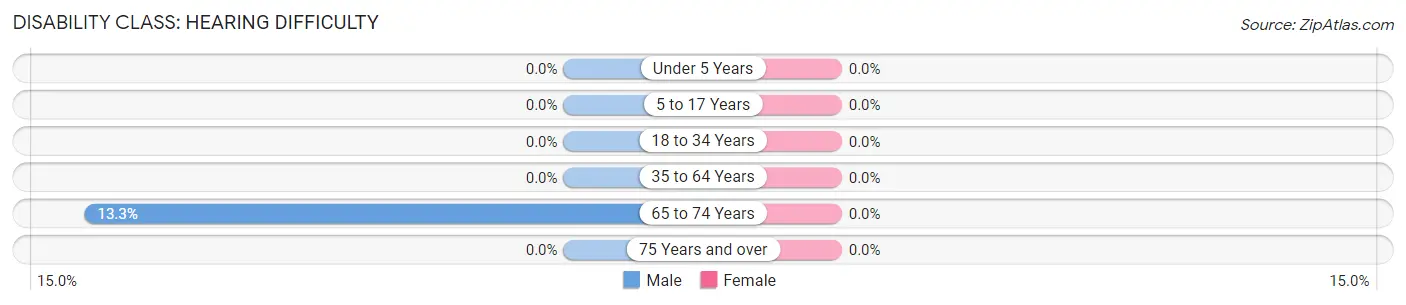
| Age Bracket | Male | Female |
| Under 5 Years | 0 (0.0%) | 0 (0.0%) |
| 5 to 17 Years | 0 (0.0%) | 0 (0.0%) |
| 18 to 34 Years | 0 (0.0%) | 0 (0.0%) |
| 35 to 64 Years | 0 (0.0%) | 0 (0.0%) |
| 65 to 74 Years | 10 (13.3%) | 0 (0.0%) |
| 75 Years and over | 0 (0.0%) | 0 (0.0%) |
Disability Class: Vision Difficulty
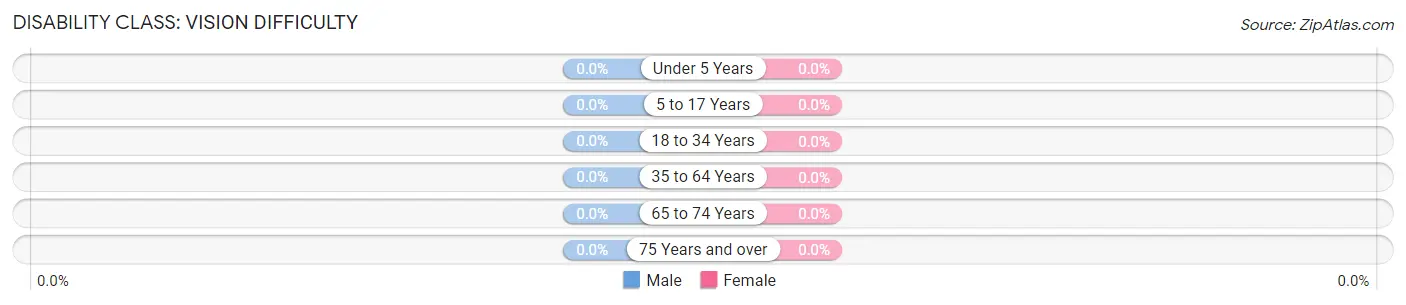
| Age Bracket | Male | Female |
| Under 5 Years | 0 (0.0%) | 0 (0.0%) |
| 5 to 17 Years | 0 (0.0%) | 0 (0.0%) |
| 18 to 34 Years | 0 (0.0%) | 0 (0.0%) |
| 35 to 64 Years | 0 (0.0%) | 0 (0.0%) |
| 65 to 74 Years | 0 (0.0%) | 0 (0.0%) |
| 75 Years and over | 0 (0.0%) | 0 (0.0%) |
Disability Class: Cognitive Difficulty
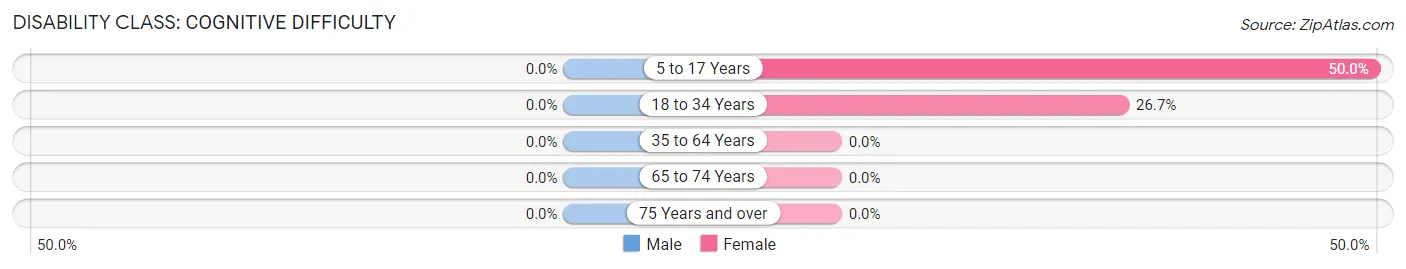
| Age Bracket | Male | Female |
| 5 to 17 Years | 0 (0.0%) | 9 (50.0%) |
| 18 to 34 Years | 0 (0.0%) | 12 (26.7%) |
| 35 to 64 Years | 0 (0.0%) | 0 (0.0%) |
| 65 to 74 Years | 0 (0.0%) | 0 (0.0%) |
| 75 Years and over | 0 (0.0%) | 0 (0.0%) |
Disability Class: Ambulatory Difficulty
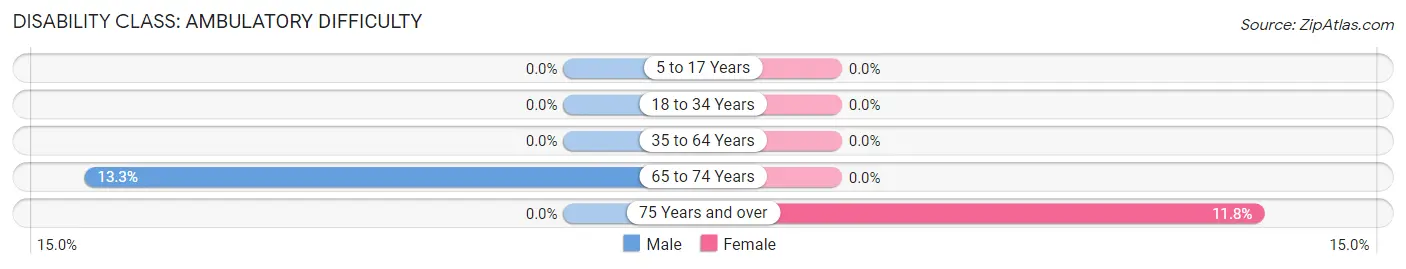
| Age Bracket | Male | Female |
| 5 to 17 Years | 0 (0.0%) | 0 (0.0%) |
| 18 to 34 Years | 0 (0.0%) | 0 (0.0%) |
| 35 to 64 Years | 0 (0.0%) | 0 (0.0%) |
| 65 to 74 Years | 10 (13.3%) | 0 (0.0%) |
| 75 Years and over | 0 (0.0%) | 2 (11.8%) |
Disability Class: Self-Care Difficulty
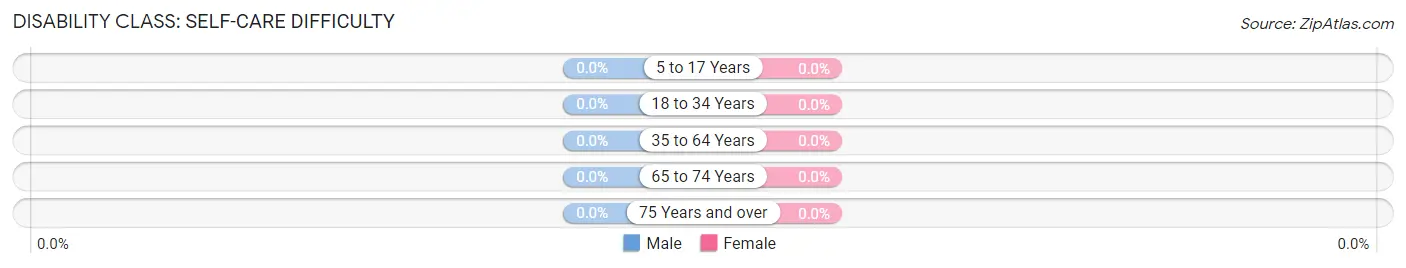
| Age Bracket | Male | Female |
| 5 to 17 Years | 0 (0.0%) | 0 (0.0%) |
| 18 to 34 Years | 0 (0.0%) | 0 (0.0%) |
| 35 to 64 Years | 0 (0.0%) | 0 (0.0%) |
| 65 to 74 Years | 0 (0.0%) | 0 (0.0%) |
| 75 Years and over | 0 (0.0%) | 0 (0.0%) |
Technology Access in Seabrook
Computing Device Access in Seabrook
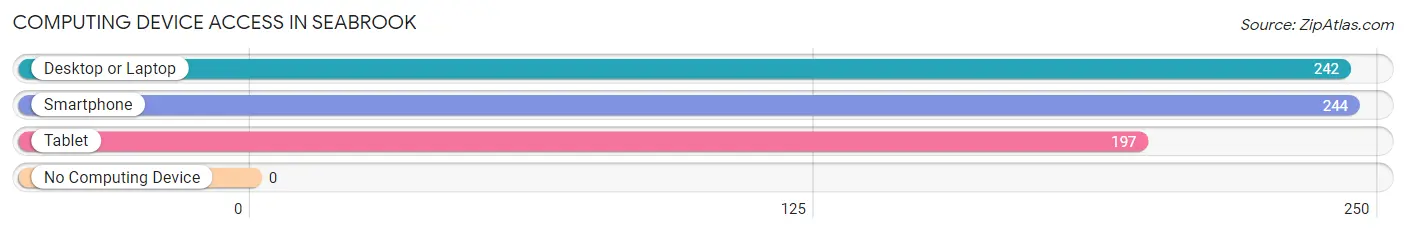
| Device Type | # Households | % Households |
| Desktop or Laptop | 242 | 99.2% |
| Smartphone | 244 | 100.0% |
| Tablet | 197 | 80.7% |
| No Computing Device | 0 | 0.0% |
| Total | 244 | 100.0% |
Internet Access in Seabrook
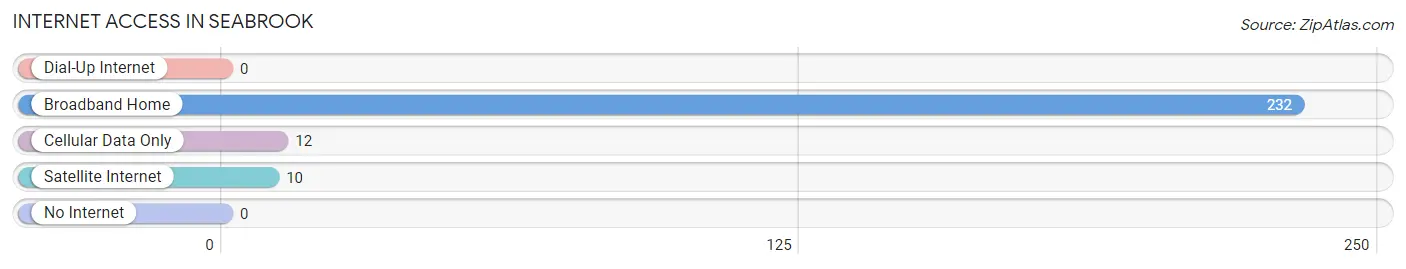
| Internet Type | # Households | % Households |
| Dial-Up Internet | 0 | 0.0% |
| Broadband Home | 232 | 95.1% |
| Cellular Data Only | 12 | 4.9% |
| Satellite Internet | 10 | 4.1% |
| No Internet | 0 | 0.0% |
| Total | 244 | 100.0% |
Seabrook Summary
Seabrook is a small town located in Rockingham County, New Hampshire, United States. It is situated along the Atlantic Ocean, just north of the Massachusetts border. The town was incorporated in 1768 and is home to a population of approximately 9,000 people.
History
The area that is now Seabrook was originally inhabited by the Abenaki Native American tribe. The first European settlers arrived in the area in 1638, and the town was officially incorporated in 1768. The town was named after the Seabrook River, which runs through the area.
In the late 19th century, Seabrook became a popular summer resort destination for wealthy families from Boston and New York. The town was home to several grand hotels, including the Seabrook House, which was built in 1881 and was one of the largest hotels in the area.
In the early 20th century, Seabrook became a popular destination for vacationers from all over the country. The town was home to several amusement parks, including the Seabrook Amusement Park, which opened in 1912 and was one of the first amusement parks in the United States.
Geography
Seabrook is located in southeastern New Hampshire, along the Atlantic Ocean. The town is bordered by Hampton to the north, Hampton Falls to the east, and Salisbury, Massachusetts to the south. The town is situated on a peninsula, with the Seabrook River running through the center of town.
The town has a total area of 8.3 square miles, of which 7.9 square miles is land and 0.4 square miles is water. The town is home to several beaches, including Seabrook Beach, which is a popular destination for swimming, fishing, and other recreational activities.
Economy
Seabrook’s economy is largely based on tourism and the service industry. The town is home to several hotels, restaurants, and other businesses that cater to tourists. The town is also home to several manufacturing companies, including the Seabrook Nuclear Power Plant, which is the largest employer in the town.
Demographics
As of the 2010 census, Seabrook had a population of 8,817 people. The racial makeup of the town was 94.3% White, 1.2% African American, 0.5% Native American, 1.2% Asian, 0.1% Pacific Islander, 1.2% from other races, and 1.5% from two or more races. Hispanic or Latino of any race were 3.2% of the population.
The median household income in Seabrook was $60,945, and the median family income was $71,917. The per capita income for the town was $30,945. About 5.2% of families and 6.7% of the population were below the poverty line, including 8.2% of those under age 18 and 4.2% of those age 65 or over.
Common Questions
What is the Total Population of Seabrook?
Total Population of Seabrook is 595.
What is the Total Male Population of Seabrook?
Total Male Population of Seabrook is 294.
What is the Total Female Population of Seabrook?
Total Female Population of Seabrook is 301.
What is the Ratio of Males per 100 Females in Seabrook?
There are 97.67 Males per 100 Females in Seabrook.
What is the Ratio of Females per 100 Males in Seabrook?
There are 102.38 Females per 100 Males in Seabrook.
What is the Median Population Age in Seabrook?
Median Population Age in Seabrook is 57.5 Years.
What is the Average Family Size in Seabrook
Average Family Size in Seabrook is 2.6 People.
What is the Average Household Size in Seabrook
Average Household Size in Seabrook is 2.4 People.
What is Per Capita Income in Seabrook?
Per Capita income in Seabrook is $63,378.
What is the Median Family Income in Seabrook?
Median Family Income in Seabrook is $125,875.
What is the Median Household income in Seabrook?
Median Household Income in Seabrook is $123,889.
What is Income or Wage Gap in Seabrook?
Income or Wage Gap in Seabrook is 44.3%.
Women in Seabrook earn 55.7 cents for every dollar earned by a man.
What is Inequality or Gini Index in Seabrook?
Inequality or Gini Index in Seabrook is 0.39.
How Large is the Labor Force in Seabrook?
There are 366 People in the Labor Forcein in Seabrook.
What is the Percentage of People in the Labor Force in Seabrook?
67.5% of People are in the Labor Force in Seabrook.