Cities with the Highest Percentage of Single Mothers in Massachusetts
RELATED REPORTS & OPTIONS
Most Single Mothers
Massachusetts
Compare Cities
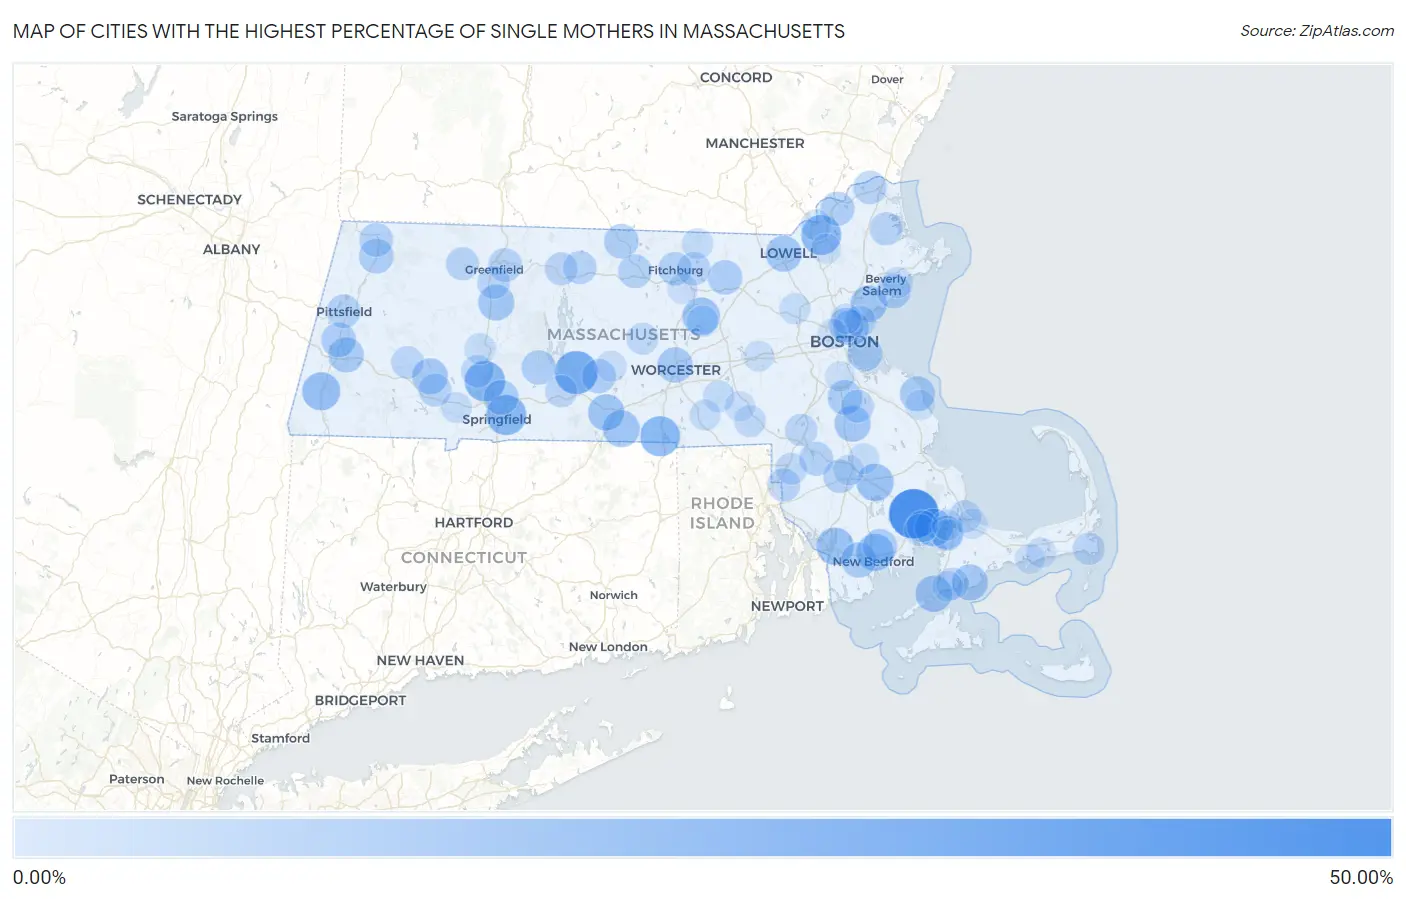
Map of Cities with the Highest Percentage of Single Mothers in Massachusetts
0.00%
50.00%
Cities with the Highest Percentage of Single Mothers in Massachusetts
| City | % Single Mothers | vs State | vs National | |
| 1. | West Wareham | 43.98% | 10.74%(+33.2)#1 | 11.49%(+32.5)#627 |
| 2. | Ware | 32.11% | 10.74%(+21.4)#2 | 11.49%(+20.6)#1,606 |
| 3. | Lenox Dale | 31.43% | 10.74%(+20.7)#3 | 11.49%(+19.9)#1,699 |
| 4. | West Warren | 28.70% | 10.74%(+18.0)#4 | 11.49%(+17.2)#2,183 |
| 5. | Holyoke | 27.54% | 10.74%(+16.8)#5 | 11.49%(+16.1)#2,458 |
| 6. | Springfield | 26.98% | 10.74%(+16.2)#6 | 11.49%(+15.5)#2,620 |
| 7. | Webster | 26.73% | 10.74%(+16.0)#7 | 11.49%(+15.2)#2,682 |
| 8. | Lawrence | 26.36% | 10.74%(+15.6)#8 | 11.49%(+14.9)#2,774 |
| 9. | Great Barrington | 23.02% | 10.74%(+12.3)#9 | 11.49%(+11.5)#3,810 |
| 10. | Onset | 22.56% | 10.74%(+11.8)#10 | 11.49%(+11.1)#3,980 |
| 11. | South Lancaster | 22.16% | 10.74%(+11.4)#11 | 11.49%(+10.7)#4,163 |
| 12. | Middleborough Center | 22.01% | 10.74%(+11.3)#12 | 11.49%(+10.5)#4,222 |
| 13. | Fall River | 21.92% | 10.74%(+11.2)#13 | 11.49%(+10.4)#4,261 |
| 14. | New Bedford | 21.76% | 10.74%(+11.0)#14 | 11.49%(+10.3)#4,343 |
| 15. | Southbridge Town | 21.05% | 10.74%(+10.3)#15 | 11.49%(+9.56)#4,679 |
| 16. | Woods Hole | 20.51% | 10.74%(+9.77)#16 | 11.49%(+9.03)#4,926 |
| 17. | Fiskdale | 20.25% | 10.74%(+9.51)#17 | 11.49%(+8.77)#5,085 |
| 18. | Lynn | 20.25% | 10.74%(+9.51)#18 | 11.49%(+8.76)#5,090 |
| 19. | Brockton | 19.63% | 10.74%(+8.89)#19 | 11.49%(+8.14)#5,444 |
| 20. | South Deerfield | 19.54% | 10.74%(+8.80)#20 | 11.49%(+8.05)#5,503 |
| 21. | Lowell | 19.51% | 10.74%(+8.77)#21 | 11.49%(+8.02)#5,533 |
| 22. | Seconsett Island | 19.35% | 10.74%(+8.61)#22 | 11.49%(+7.87)#5,626 |
| 23. | Huntington | 19.11% | 10.74%(+8.37)#23 | 11.49%(+7.62)#5,776 |
| 24. | Chelsea | 18.65% | 10.74%(+7.91)#24 | 11.49%(+7.17)#6,075 |
| 25. | Worcester | 18.55% | 10.74%(+7.81)#25 | 11.49%(+7.07)#6,130 |
| 26. | Smith Mills | 18.19% | 10.74%(+7.45)#26 | 11.49%(+6.70)#6,358 |
| 27. | Scituate | 17.87% | 10.74%(+7.13)#27 | 11.49%(+6.38)#6,599 |
| 28. | Lee | 17.77% | 10.74%(+7.03)#28 | 11.49%(+6.28)#6,673 |
| 29. | Boston | 17.52% | 10.74%(+6.78)#29 | 11.49%(+6.03)#6,845 |
| 30. | Chicopee | 17.46% | 10.74%(+6.72)#30 | 11.49%(+5.97)#6,892 |
| 31. | Lenox | 17.31% | 10.74%(+6.57)#31 | 11.49%(+5.82)#7,004 |
| 32. | Randolph Town | 17.18% | 10.74%(+6.44)#32 | 11.49%(+5.70)#7,123 |
| 33. | Ayer | 17.11% | 10.74%(+6.37)#33 | 11.49%(+5.63)#7,184 |
| 34. | Acushnet Center | 17.10% | 10.74%(+6.36)#34 | 11.49%(+5.61)#7,195 |
| 35. | Adams | 17.06% | 10.74%(+6.32)#35 | 11.49%(+5.57)#7,221 |
| 36. | Winchendon | 16.87% | 10.74%(+6.13)#36 | 11.49%(+5.38)#7,363 |
| 37. | Belchertown | 16.73% | 10.74%(+5.99)#37 | 11.49%(+5.24)#7,462 |
| 38. | Everett | 16.58% | 10.74%(+5.84)#38 | 11.49%(+5.09)#7,624 |
| 39. | Salem | 16.29% | 10.74%(+5.55)#39 | 11.49%(+4.80)#7,829 |
| 40. | West Brookfield | 16.28% | 10.74%(+5.54)#40 | 11.49%(+4.79)#7,833 |
| 41. | Haverhill | 16.24% | 10.74%(+5.50)#41 | 11.49%(+4.75)#7,870 |
| 42. | Norton Center | 15.85% | 10.74%(+5.11)#42 | 11.49%(+4.37)#8,200 |
| 43. | Bourne | 15.71% | 10.74%(+4.96)#43 | 11.49%(+4.22)#8,348 |
| 44. | North Adams | 15.53% | 10.74%(+4.79)#44 | 11.49%(+4.05)#8,510 |
| 45. | Gardner | 15.41% | 10.74%(+4.67)#45 | 11.49%(+3.93)#8,596 |
| 46. | Pittsfield | 15.39% | 10.74%(+4.65)#46 | 11.49%(+3.90)#8,608 |
| 47. | Greenfield | 15.33% | 10.74%(+4.59)#47 | 11.49%(+3.84)#8,705 |
| 48. | Taunton | 15.25% | 10.74%(+4.51)#48 | 11.49%(+3.76)#8,782 |
| 49. | Turners Falls | 15.07% | 10.74%(+4.32)#49 | 11.49%(+3.58)#8,953 |
| 50. | Fitchburg | 15.06% | 10.74%(+4.32)#50 | 11.49%(+3.57)#8,963 |
| 51. | Amesbury Town | 15.00% | 10.74%(+4.26)#51 | 11.49%(+3.52)#8,996 |
| 52. | Lunenburg | 14.80% | 10.74%(+4.06)#52 | 11.49%(+3.32)#9,192 |
| 53. | Athol | 14.59% | 10.74%(+3.85)#53 | 11.49%(+3.10)#9,378 |
| 54. | Shelburne Falls | 14.55% | 10.74%(+3.81)#54 | 11.49%(+3.06)#9,423 |
| 55. | Rowley | 14.50% | 10.74%(+3.76)#55 | 11.49%(+3.01)#9,466 |
| 56. | North Seekonk | 14.38% | 10.74%(+3.64)#56 | 11.49%(+2.89)#9,564 |
| 57. | Russell | 14.29% | 10.74%(+3.54)#57 | 11.49%(+2.80)#9,653 |
| 58. | Orange | 14.24% | 10.74%(+3.50)#58 | 11.49%(+2.75)#9,740 |
| 59. | Holbrook | 13.98% | 10.74%(+3.24)#59 | 11.49%(+2.49)#9,974 |
| 60. | Deerfield | 13.82% | 10.74%(+3.08)#60 | 11.49%(+2.33)#10,126 |
| 61. | Chester | 13.61% | 10.74%(+2.87)#61 | 11.49%(+2.13)#10,344 |
| 62. | Easthampton Town | 13.38% | 10.74%(+2.64)#62 | 11.49%(+1.89)#10,561 |
| 63. | Foxborough | 13.14% | 10.74%(+2.40)#63 | 11.49%(+1.66)#10,805 |
| 64. | Sagamore | 13.14% | 10.74%(+2.40)#64 | 11.49%(+1.65)#10,810 |
| 65. | Palmer Town | 13.07% | 10.74%(+2.33)#65 | 11.49%(+1.58)#10,886 |
| 66. | West Chatham | 13.04% | 10.74%(+2.29)#66 | 11.49%(+1.55)#10,935 |
| 67. | Teaticket | 12.68% | 10.74%(+1.94)#67 | 11.49%(+1.19)#11,342 |
| 68. | Attleboro | 12.47% | 10.74%(+1.73)#68 | 11.49%(+0.983)#11,603 |
| 69. | Rutland | 12.45% | 10.74%(+1.71)#69 | 11.49%(+0.965)#11,620 |
| 70. | Revere | 12.09% | 10.74%(+1.35)#70 | 11.49%(+0.605)#11,984 |
| 71. | Monument Beach | 12.06% | 10.74%(+1.32)#71 | 11.49%(+0.570)#12,019 |
| 72. | Weweantic | 11.98% | 10.74%(+1.24)#72 | 11.49%(+0.489)#12,107 |
| 73. | Bellingham | 11.96% | 10.74%(+1.22)#73 | 11.49%(+0.474)#12,123 |
| 74. | Upton | 11.85% | 10.74%(+1.11)#74 | 11.49%(+0.362)#12,242 |
| 75. | Wareham Center | 11.81% | 10.74%(+1.07)#75 | 11.49%(+0.324)#12,286 |
| 76. | Clinton | 11.72% | 10.74%(+0.975)#76 | 11.49%(+0.228)#12,391 |
| 77. | Beverly | 11.25% | 10.74%(+0.514)#77 | 11.49%(-0.233)#12,914 |
| 78. | Northampton | 11.17% | 10.74%(+0.432)#78 | 11.49%(-0.315)#12,997 |
| 79. | Hanscom Afb | 11.14% | 10.74%(+0.395)#79 | 11.49%(-0.351)#13,029 |
| 80. | Whitinsville | 11.13% | 10.74%(+0.392)#80 | 11.49%(-0.354)#13,031 |
| 81. | Townsend | 11.07% | 10.74%(+0.328)#81 | 11.49%(-0.419)#13,148 |
| 82. | Bridgewater Town | 10.88% | 10.74%(+0.143)#82 | 11.49%(-0.603)#13,354 |
| 83. | Westfield | 10.88% | 10.74%(+0.135)#83 | 11.49%(-0.611)#13,364 |
| 84. | Methuen Town | 10.87% | 10.74%(+0.130)#84 | 11.49%(-0.616)#13,368 |
| 85. | Buzzards Bay | 10.65% | 10.74%(-0.094)#85 | 11.49%(-0.840)#13,646 |
| 86. | North Brookfield | 10.64% | 10.74%(-0.099)#86 | 11.49%(-0.845)#13,655 |
| 87. | Framingham | 10.64% | 10.74%(-0.102)#87 | 11.49%(-0.848)#13,656 |
| 88. | Falmouth | 10.54% | 10.74%(-0.204)#88 | 11.49%(-0.950)#13,776 |
| 89. | Raynham Center | 10.38% | 10.74%(-0.366)#89 | 11.49%(-1.11)#13,972 |
| 90. | Leominster | 10.12% | 10.74%(-0.618)#90 | 11.49%(-1.36)#14,280 |
| 91. | Sandwich | 9.92% | 10.74%(-0.821)#91 | 11.49%(-1.57)#14,522 |
| 92. | Milford | 9.75% | 10.74%(-0.990)#92 | 11.49%(-1.74)#14,754 |
| 93. | Andover | 9.74% | 10.74%(-1.00)#93 | 11.49%(-1.75)#14,769 |
| 94. | Malden | 9.73% | 10.74%(-1.01)#94 | 11.49%(-1.76)#14,778 |
| 95. | South Yarmouth | 9.72% | 10.74%(-1.02)#95 | 11.49%(-1.77)#14,791 |
| 96. | Amherst | 9.62% | 10.74%(-1.13)#96 | 11.49%(-1.87)#14,910 |
| 97. | West Yarmouth | 9.60% | 10.74%(-1.14)#97 | 11.49%(-1.89)#14,931 |
| 98. | Milton | 9.49% | 10.74%(-1.25)#98 | 11.49%(-2.00)#15,072 |
| 99. | Cambridge | 9.44% | 10.74%(-1.30)#99 | 11.49%(-2.05)#15,137 |
| 100. | Marshfield Hills | 9.33% | 10.74%(-1.41)#100 | 11.49%(-2.15)#15,269 |
Common Questions
What are the Top 10 Cities with the Highest Percentage of Single Mothers in Massachusetts?
Top 10 Cities with the Highest Percentage of Single Mothers in Massachusetts are:
#1
43.98%
#2
32.11%
#3
27.54%
#4
26.98%
#5
26.73%
#6
26.36%
#7
23.02%
#8
22.56%
#9
22.16%
#10
22.01%
What city has the Highest Percentage of Single Mothers in Massachusetts?
West Wareham has the Highest Percentage of Single Mothers in Massachusetts with 43.98%.
What is the Percentage of Single Mothers in the State of Massachusetts?
Percentage of Single Mothers in Massachusetts is 10.74%.
What is the Percentage of Single Mothers in the United States?
Percentage of Single Mothers in the United States is 11.49%.