Cities with the Most Immigrants from Ecuador in Massachusetts
RELATED REPORTS & OPTIONS
Ecuador
Massachusetts
Compare Cities
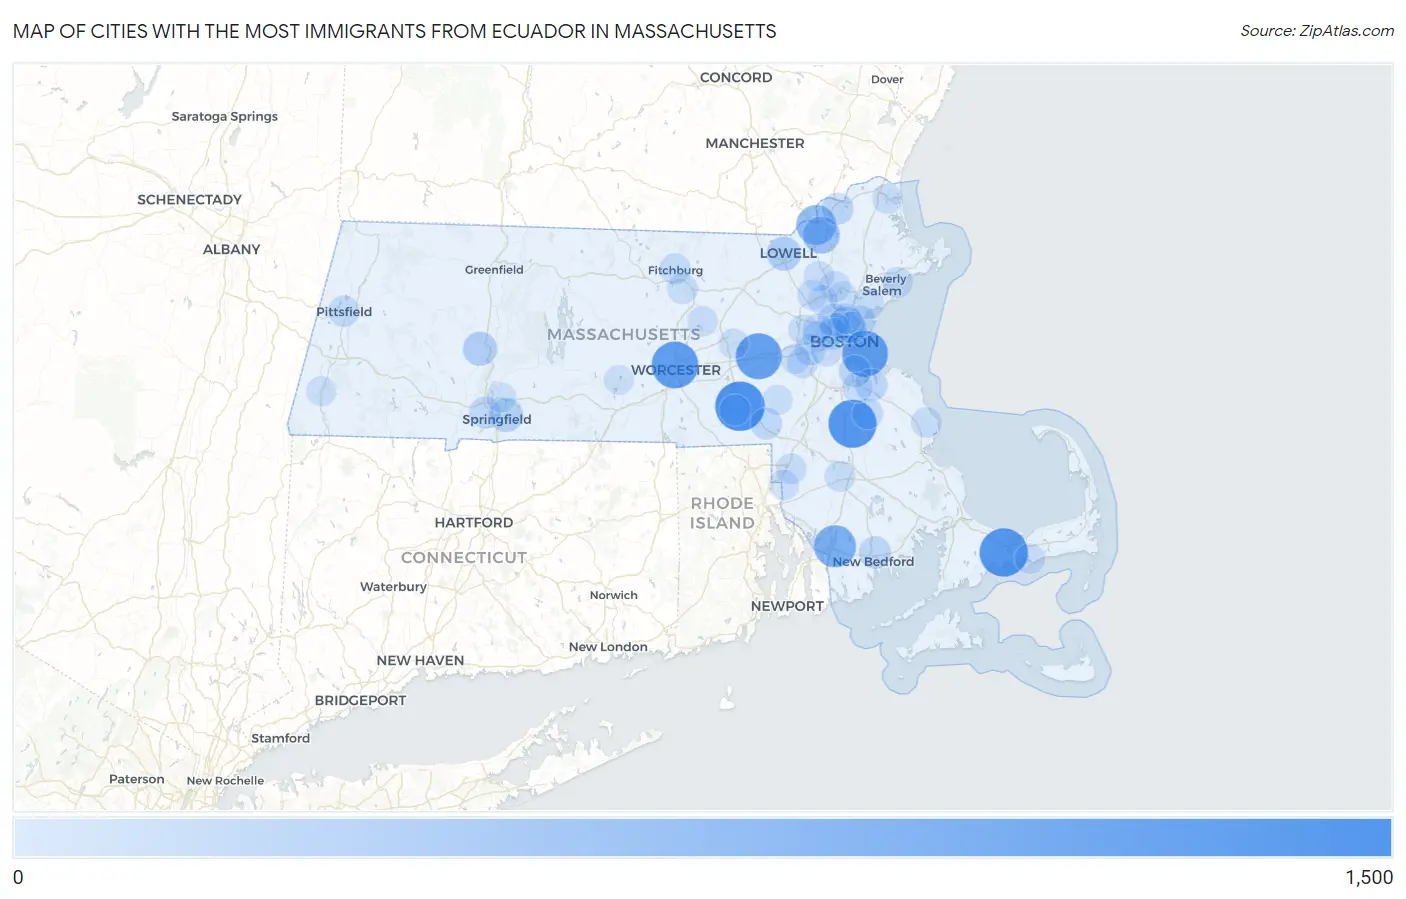
Map of Cities with the Most Immigrants from Ecuador in Massachusetts
0
1,500
Cities with the Most Immigrants from Ecuador in Massachusetts
| City | Ecuador | vs State | vs National | |
| 1. | Milford | 1,130 | 11,727(9.64%)#1 | 480,873(0.23%)#36 |
| 2. | Barnstable Town | 1,062 | 11,727(9.06%)#2 | 480,873(0.22%)#38 |
| 3. | Brockton | 1,046 | 11,727(8.92%)#3 | 480,873(0.22%)#39 |
| 4. | Worcester | 966 | 11,727(8.24%)#4 | 480,873(0.20%)#43 |
| 5. | Boston | 927 | 11,727(7.90%)#5 | 480,873(0.19%)#51 |
| 6. | Framingham | 913 | 11,727(7.79%)#6 | 480,873(0.19%)#53 |
| 7. | Fall River | 691 | 11,727(5.89%)#7 | 480,873(0.14%)#75 |
| 8. | Methuen Town | 564 | 11,727(4.81%)#8 | 480,873(0.12%)#96 |
| 9. | Lawrence | 400 | 11,727(3.41%)#9 | 480,873(0.08%)#134 |
| 10. | Everett | 335 | 11,727(2.86%)#10 | 480,873(0.07%)#160 |
| 11. | Lowell | 232 | 11,727(1.98%)#11 | 480,873(0.05%)#238 |
| 12. | Northampton | 220 | 11,727(1.88%)#12 | 480,873(0.05%)#251 |
| 13. | Springfield | 214 | 11,727(1.82%)#13 | 480,873(0.04%)#262 |
| 14. | Medford | 142 | 11,727(1.21%)#14 | 480,873(0.03%)#388 |
| 15. | Weymouth Town | 136 | 11,727(1.16%)#15 | 480,873(0.03%)#402 |
| 16. | New Bedford | 119 | 11,727(1.01%)#16 | 480,873(0.02%)#448 |
| 17. | Quincy | 110 | 11,727(0.94%)#17 | 480,873(0.02%)#475 |
| 18. | Haverhill | 110 | 11,727(0.94%)#18 | 480,873(0.02%)#476 |
| 19. | Revere | 94 | 11,727(0.80%)#19 | 480,873(0.02%)#532 |
| 20. | West Springfield Town | 91 | 11,727(0.78%)#20 | 480,873(0.02%)#547 |
| 21. | Franklin Town | 85 | 11,727(0.72%)#21 | 480,873(0.02%)#574 |
| 22. | Chelsea | 79 | 11,727(0.67%)#22 | 480,873(0.02%)#603 |
| 23. | Cambridge | 77 | 11,727(0.66%)#23 | 480,873(0.02%)#612 |
| 24. | Pittsfield | 69 | 11,727(0.59%)#24 | 480,873(0.01%)#672 |
| 25. | Somerville | 67 | 11,727(0.57%)#25 | 480,873(0.01%)#695 |
| 26. | Needham | 63 | 11,727(0.54%)#26 | 480,873(0.01%)#733 |
| 27. | North Attleborough | 56 | 11,727(0.48%)#27 | 480,873(0.01%)#792 |
| 28. | Hopedale | 55 | 11,727(0.47%)#28 | 480,873(0.01%)#811 |
| 29. | Fitchburg | 53 | 11,727(0.45%)#29 | 480,873(0.01%)#832 |
| 30. | Newton | 49 | 11,727(0.42%)#30 | 480,873(0.01%)#866 |
| 31. | Abington | 49 | 11,727(0.42%)#31 | 480,873(0.01%)#874 |
| 32. | Reading | 46 | 11,727(0.39%)#32 | 480,873(0.01%)#911 |
| 33. | Beverly | 44 | 11,727(0.38%)#33 | 480,873(0.01%)#930 |
| 34. | Waltham | 43 | 11,727(0.37%)#34 | 480,873(0.01%)#946 |
| 35. | Taunton | 40 | 11,727(0.34%)#35 | 480,873(0.01%)#1,004 |
| 36. | Lynn | 38 | 11,727(0.32%)#36 | 480,873(0.01%)#1,028 |
| 37. | Malden | 38 | 11,727(0.32%)#37 | 480,873(0.01%)#1,031 |
| 38. | Watertown Town | 38 | 11,727(0.32%)#38 | 480,873(0.01%)#1,036 |
| 39. | Marshfield | 36 | 11,727(0.31%)#39 | 480,873(0.01%)#1,086 |
| 40. | Attleboro | 29 | 11,727(0.25%)#40 | 480,873(0.01%)#1,205 |
| 41. | Leominster | 29 | 11,727(0.25%)#41 | 480,873(0.01%)#1,207 |
| 42. | Amherst | 29 | 11,727(0.25%)#42 | 480,873(0.01%)#1,210 |
| 43. | Burlington | 29 | 11,727(0.25%)#43 | 480,873(0.01%)#1,215 |
| 44. | West Yarmouth | 27 | 11,727(0.23%)#44 | 480,873(0.01%)#1,274 |
| 45. | Wellesley | 24 | 11,727(0.20%)#45 | 480,873(0.00%)#1,346 |
| 46. | Clinton | 22 | 11,727(0.19%)#46 | 480,873(0.00%)#1,406 |
| 47. | Brookline | 21 | 11,727(0.18%)#47 | 480,873(0.00%)#1,422 |
| 48. | Newburyport | 18 | 11,727(0.15%)#48 | 480,873(0.00%)#1,547 |
| 49. | North Seekonk | 18 | 11,727(0.15%)#49 | 480,873(0.00%)#1,568 |
| 50. | Wilmington | 17 | 11,727(0.14%)#50 | 480,873(0.00%)#1,596 |
| 51. | Braintree Town | 16 | 11,727(0.14%)#51 | 480,873(0.00%)#1,637 |
| 52. | Millis Clicquot | 15 | 11,727(0.13%)#52 | 480,873(0.00%)#1,705 |
| 53. | Marlborough | 13 | 11,727(0.11%)#53 | 480,873(0.00%)#1,770 |
| 54. | Chicopee | 9 | 11,727(0.08%)#54 | 480,873(0.00%)#1,991 |
| 55. | Woburn | 8 | 11,727(0.07%)#55 | 480,873(0.00%)#2,061 |
| 56. | Wakefield | 5 | 11,727(0.04%)#56 | 480,873(0.00%)#2,217 |
| 57. | Belmont | 5 | 11,727(0.04%)#57 | 480,873(0.00%)#2,218 |
| 58. | Great Barrington | 3 | 11,727(0.03%)#58 | 480,873(0.00%)#2,318 |
| 59. | East Brookfield | 2 | 11,727(0.02%)#59 | 480,873(0.00%)#2,357 |
Common Questions
What are the Top 10 Cities with the Most Immigrants from Ecuador in Massachusetts?
Top 10 Cities with the Most Immigrants from Ecuador in Massachusetts are:
#1
1,130
#2
1,062
#3
1,046
#4
966
#5
927
#6
913
#7
691
#8
564
#9
400
#10
335
What city has the Most Immigrants from Ecuador in Massachusetts?
Milford has the Most Immigrants from Ecuador in Massachusetts with 1,130.
What is the Total Immigrants from Ecuador in the State of Massachusetts?
Total Immigrants from Ecuador in Massachusetts is 11,727.
What is the Total Immigrants from Ecuador in the United States?
Total Immigrants from Ecuador in the United States is 480,873.