Cities with the Most Immigrants from Chile in Massachusetts
RELATED REPORTS & OPTIONS
Chile
Massachusetts
Compare Cities
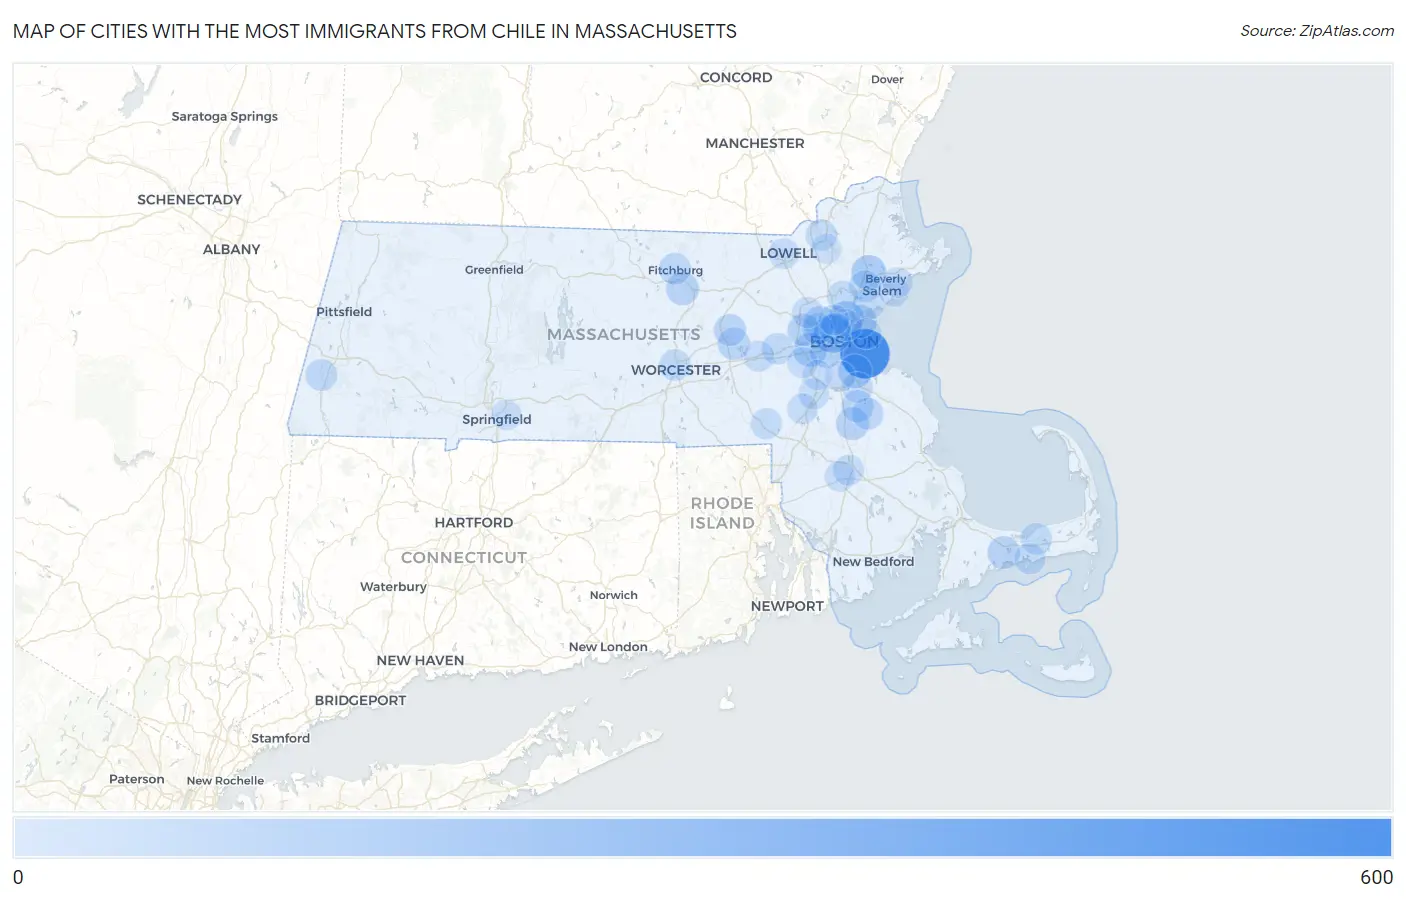
Map of Cities with the Most Immigrants from Chile in Massachusetts
0
600
Cities with the Most Immigrants from Chile in Massachusetts
| City | Chile | vs State | vs National | |
| 1. | Boston | 509 | 2,809(18.12%)#1 | 106,565(0.48%)#15 |
| 2. | Cambridge | 201 | 2,809(7.16%)#2 | 106,565(0.19%)#81 |
| 3. | Malden | 127 | 2,809(4.52%)#3 | 106,565(0.12%)#146 |
| 4. | Danvers | 121 | 2,809(4.31%)#4 | 106,565(0.11%)#157 |
| 5. | Quincy | 91 | 2,809(3.24%)#5 | 106,565(0.09%)#227 |
| 6. | Newton | 91 | 2,809(3.24%)#6 | 106,565(0.09%)#228 |
| 7. | Brookline | 81 | 2,809(2.88%)#7 | 106,565(0.08%)#256 |
| 8. | Revere | 80 | 2,809(2.85%)#8 | 106,565(0.08%)#262 |
| 9. | Brockton | 70 | 2,809(2.49%)#9 | 106,565(0.07%)#303 |
| 10. | Leominster | 70 | 2,809(2.49%)#10 | 106,565(0.07%)#306 |
| 11. | Arlington | 69 | 2,809(2.46%)#11 | 106,565(0.06%)#310 |
| 12. | Barnstable Town | 66 | 2,809(2.35%)#12 | 106,565(0.06%)#325 |
| 13. | Waltham | 65 | 2,809(2.31%)#13 | 106,565(0.06%)#331 |
| 14. | Marlborough | 53 | 2,809(1.89%)#14 | 106,565(0.05%)#404 |
| 15. | Holbrook | 52 | 2,809(1.85%)#15 | 106,565(0.05%)#414 |
| 16. | Hudson | 48 | 2,809(1.71%)#16 | 106,565(0.05%)#444 |
| 17. | Everett | 46 | 2,809(1.64%)#17 | 106,565(0.04%)#461 |
| 18. | Peabody | 45 | 2,809(1.60%)#18 | 106,565(0.04%)#469 |
| 19. | Abington | 41 | 2,809(1.46%)#19 | 106,565(0.04%)#528 |
| 20. | Housatonic | 41 | 2,809(1.46%)#20 | 106,565(0.04%)#532 |
| 21. | Fitchburg | 40 | 2,809(1.42%)#21 | 106,565(0.04%)#536 |
| 22. | Worcester | 36 | 2,809(1.28%)#22 | 106,565(0.03%)#564 |
| 23. | Cochituate | 36 | 2,809(1.28%)#23 | 106,565(0.03%)#580 |
| 24. | Yarmouth Port | 33 | 2,809(1.17%)#24 | 106,565(0.03%)#625 |
| 25. | Somerville | 30 | 2,809(1.07%)#25 | 106,565(0.03%)#653 |
| 26. | Belmont | 30 | 2,809(1.07%)#26 | 106,565(0.03%)#661 |
| 27. | Lawrence | 29 | 2,809(1.03%)#27 | 106,565(0.03%)#671 |
| 28. | Lynn | 28 | 2,809(1.00%)#28 | 106,565(0.03%)#687 |
| 29. | Wakefield | 25 | 2,809(0.89%)#29 | 106,565(0.02%)#745 |
| 30. | Franklin Town | 24 | 2,809(0.85%)#30 | 106,565(0.02%)#763 |
| 31. | West Yarmouth | 24 | 2,809(0.85%)#31 | 106,565(0.02%)#773 |
| 32. | Braintree Town | 21 | 2,809(0.75%)#32 | 106,565(0.02%)#828 |
| 33. | Lexington | 21 | 2,809(0.75%)#33 | 106,565(0.02%)#829 |
| 34. | Framingham | 20 | 2,809(0.71%)#34 | 106,565(0.02%)#843 |
| 35. | Norwood | 20 | 2,809(0.71%)#35 | 106,565(0.02%)#850 |
| 36. | Medford | 17 | 2,809(0.61%)#36 | 106,565(0.02%)#933 |
| 37. | Needham | 15 | 2,809(0.53%)#37 | 106,565(0.01%)#1,004 |
| 38. | Raynham Center | 15 | 2,809(0.53%)#38 | 106,565(0.01%)#1,031 |
| 39. | Walpole | 14 | 2,809(0.50%)#39 | 106,565(0.01%)#1,061 |
| 40. | Lowell | 13 | 2,809(0.46%)#40 | 106,565(0.01%)#1,074 |
| 41. | Amherst | 13 | 2,809(0.46%)#41 | 106,565(0.01%)#1,087 |
| 42. | Taunton | 12 | 2,809(0.43%)#42 | 106,565(0.01%)#1,126 |
| 43. | Milton | 11 | 2,809(0.39%)#43 | 106,565(0.01%)#1,171 |
| 44. | Salem | 10 | 2,809(0.36%)#44 | 106,565(0.01%)#1,217 |
| 45. | Winthrop Town | 10 | 2,809(0.36%)#45 | 106,565(0.01%)#1,230 |
| 46. | Beverly | 8 | 2,809(0.28%)#46 | 106,565(0.01%)#1,305 |
| 47. | Springfield | 5 | 2,809(0.18%)#47 | 106,565(0.00%)#1,419 |
| 48. | Andover | 4 | 2,809(0.14%)#48 | 106,565(0.00%)#1,472 |
| 49. | Dedham | 3 | 2,809(0.11%)#49 | 106,565(0.00%)#1,500 |
Common Questions
What are the Top 10 Cities with the Most Immigrants from Chile in Massachusetts?
Top 10 Cities with the Most Immigrants from Chile in Massachusetts are:
What city has the Most Immigrants from Chile in Massachusetts?
Boston has the Most Immigrants from Chile in Massachusetts with 509.
What is the Total Immigrants from Chile in the State of Massachusetts?
Total Immigrants from Chile in Massachusetts is 2,809.
What is the Total Immigrants from Chile in the United States?
Total Immigrants from Chile in the United States is 106,565.