Cities with the Most Immigrants from Nepal in Massachusetts
RELATED REPORTS & OPTIONS
Nepal
Massachusetts
Compare Cities
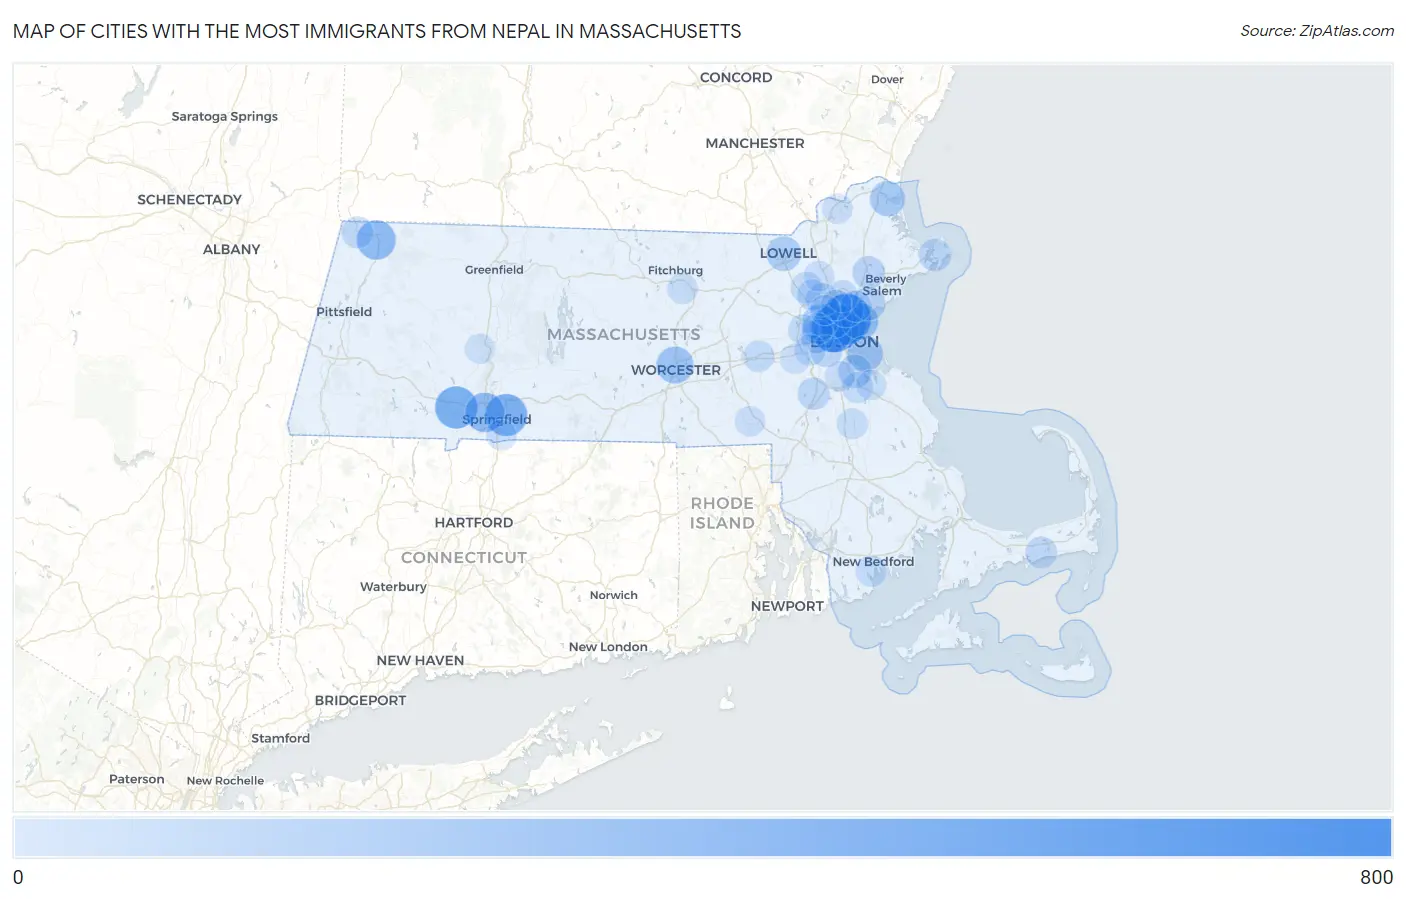
Map of Cities with the Most Immigrants from Nepal in Massachusetts
0
800
Cities with the Most Immigrants from Nepal in Massachusetts
| City | Nepal | vs State | vs National | |
| 1. | Malden | 665 | 6,789(9.80%)#1 | 165,080(0.40%)#26 |
| 2. | Somerville | 573 | 6,789(8.44%)#2 | 165,080(0.35%)#35 |
| 3. | Westfield | 409 | 6,789(6.02%)#3 | 165,080(0.25%)#65 |
| 4. | Springfield | 401 | 6,789(5.91%)#4 | 165,080(0.24%)#68 |
| 5. | Everett | 342 | 6,789(5.04%)#5 | 165,080(0.21%)#83 |
| 6. | West Springfield Town | 313 | 6,789(4.61%)#6 | 165,080(0.19%)#93 |
| 7. | North Adams | 304 | 6,789(4.48%)#7 | 165,080(0.18%)#97 |
| 8. | Cambridge | 248 | 6,789(3.65%)#8 | 165,080(0.15%)#122 |
| 9. | Worcester | 230 | 6,789(3.39%)#9 | 165,080(0.14%)#140 |
| 10. | Revere | 221 | 6,789(3.26%)#10 | 165,080(0.13%)#147 |
| 11. | Medford | 210 | 6,789(3.09%)#11 | 165,080(0.13%)#159 |
| 12. | Boston | 193 | 6,789(2.84%)#12 | 165,080(0.12%)#171 |
| 13. | Arlington | 193 | 6,789(2.84%)#13 | 165,080(0.12%)#173 |
| 14. | Newburyport | 166 | 6,789(2.45%)#14 | 165,080(0.10%)#204 |
| 15. | Melrose | 161 | 6,789(2.37%)#15 | 165,080(0.10%)#212 |
| 16. | Lowell | 149 | 6,789(2.19%)#16 | 165,080(0.09%)#232 |
| 17. | Lynn | 113 | 6,789(1.66%)#17 | 165,080(0.07%)#289 |
| 18. | Quincy | 109 | 6,789(1.61%)#18 | 165,080(0.07%)#305 |
| 19. | Watertown Town | 105 | 6,789(1.55%)#19 | 165,080(0.06%)#314 |
| 20. | Woburn | 91 | 6,789(1.34%)#20 | 165,080(0.06%)#362 |
| 21. | Danvers | 86 | 6,789(1.27%)#21 | 165,080(0.05%)#374 |
| 22. | Gloucester | 79 | 6,789(1.16%)#22 | 165,080(0.05%)#403 |
| 23. | Norwood | 72 | 6,789(1.06%)#23 | 165,080(0.04%)#437 |
| 24. | Brookline | 63 | 6,789(0.93%)#24 | 165,080(0.04%)#481 |
| 25. | Wakefield | 59 | 6,789(0.87%)#25 | 165,080(0.04%)#503 |
| 26. | South Yarmouth | 57 | 6,789(0.84%)#26 | 165,080(0.03%)#520 |
| 27. | Williamstown | 54 | 6,789(0.80%)#27 | 165,080(0.03%)#537 |
| 28. | Waltham | 44 | 6,789(0.65%)#28 | 165,080(0.03%)#601 |
| 29. | Belmont | 43 | 6,789(0.63%)#29 | 165,080(0.03%)#606 |
| 30. | Framingham | 41 | 6,789(0.60%)#30 | 165,080(0.02%)#618 |
| 31. | Amherst | 41 | 6,789(0.60%)#31 | 165,080(0.02%)#625 |
| 32. | Saugus | 39 | 6,789(0.57%)#32 | 165,080(0.02%)#638 |
| 33. | Newton | 38 | 6,789(0.56%)#33 | 165,080(0.02%)#643 |
| 34. | Braintree Town | 38 | 6,789(0.56%)#34 | 165,080(0.02%)#645 |
| 35. | Pinehurst | 38 | 6,789(0.56%)#35 | 165,080(0.02%)#652 |
| 36. | Burlington | 37 | 6,789(0.54%)#36 | 165,080(0.02%)#658 |
| 37. | Bliss Corner | 31 | 6,789(0.46%)#37 | 165,080(0.02%)#723 |
| 38. | Brockton | 27 | 6,789(0.40%)#38 | 165,080(0.02%)#768 |
| 39. | Stoneham | 18 | 6,789(0.27%)#39 | 165,080(0.01%)#909 |
| 40. | Leominster | 17 | 6,789(0.25%)#40 | 165,080(0.01%)#926 |
| 41. | Wilmington | 15 | 6,789(0.22%)#41 | 165,080(0.01%)#966 |
| 42. | Haverhill | 14 | 6,789(0.21%)#42 | 165,080(0.01%)#981 |
| 43. | Longmeadow | 13 | 6,789(0.19%)#43 | 165,080(0.01%)#1,011 |
| 44. | Bellingham | 10 | 6,789(0.15%)#44 | 165,080(0.01%)#1,084 |
| 45. | Weymouth Town | 7 | 6,789(0.10%)#45 | 165,080(0.00%)#1,136 |
| 46. | Milton | 6 | 6,789(0.09%)#46 | 165,080(0.00%)#1,166 |
| 47. | Wellesley | 5 | 6,789(0.07%)#47 | 165,080(0.00%)#1,183 |
| 48. | Winchester | 3 | 6,789(0.04%)#48 | 165,080(0.00%)#1,225 |
| 49. | Northampton | 2 | 6,789(0.03%)#49 | 165,080(0.00%)#1,241 |
Common Questions
What are the Top 10 Cities with the Most Immigrants from Nepal in Massachusetts?
Top 10 Cities with the Most Immigrants from Nepal in Massachusetts are:
#1
665
#2
573
#3
409
#4
401
#5
342
#6
313
#7
304
#8
248
#9
230
#10
221
What city has the Most Immigrants from Nepal in Massachusetts?
Malden has the Most Immigrants from Nepal in Massachusetts with 665.
What is the Total Immigrants from Nepal in the State of Massachusetts?
Total Immigrants from Nepal in Massachusetts is 6,789.
What is the Total Immigrants from Nepal in the United States?
Total Immigrants from Nepal in the United States is 165,080.