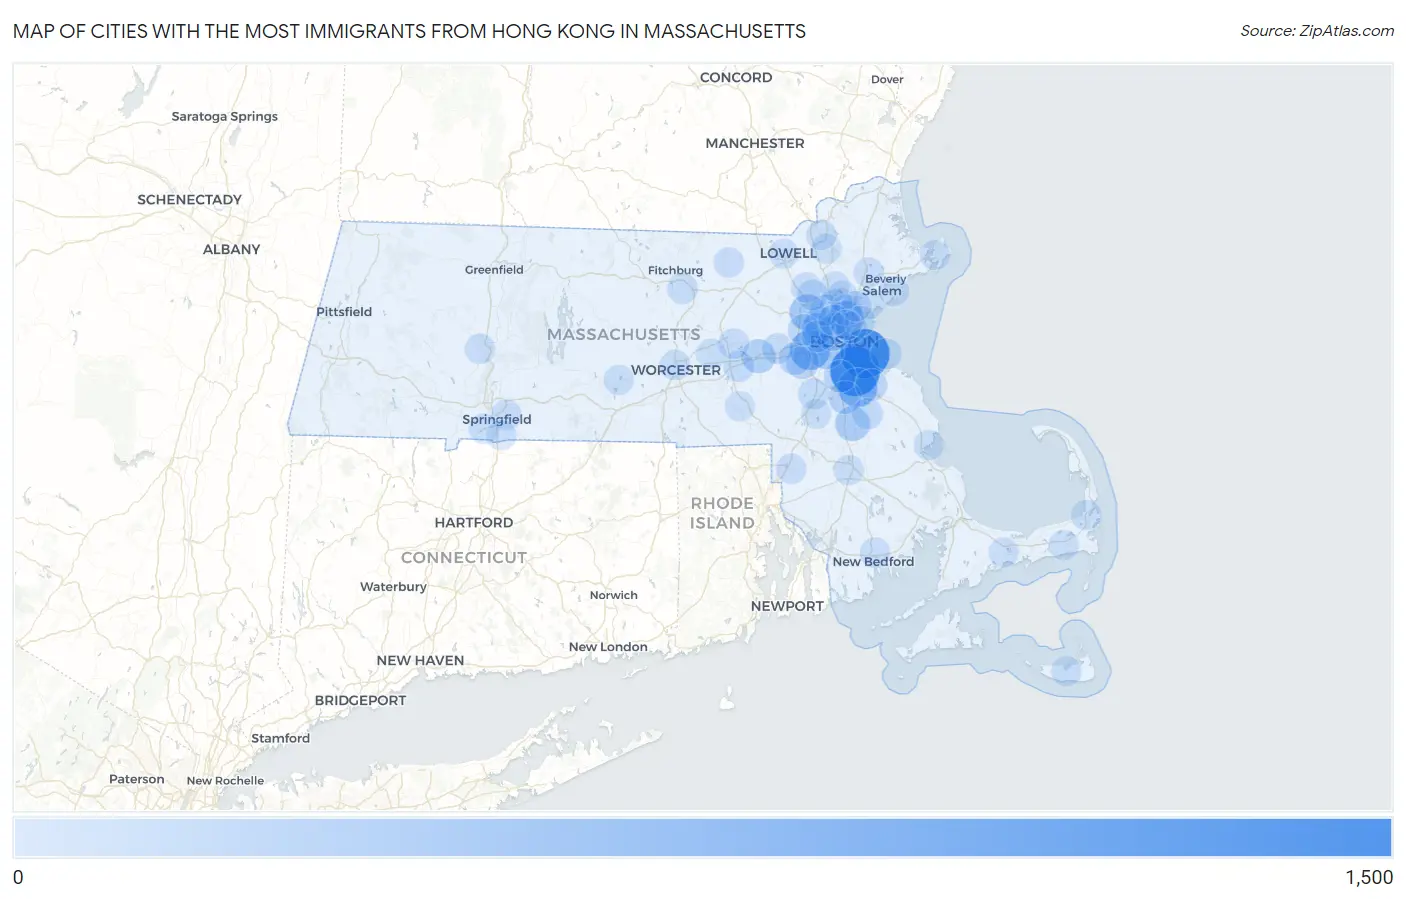
Cities with the Most Immigrants from Hong Kong in Massachusetts
RELATED REPORTS & OPTIONS
Hong Kong
Massachusetts
Compare Cities
Map of Cities with the Most Immigrants from Hong Kong in Massachusetts
0
1,500
Cities with the Most Immigrants from Hong Kong in Massachusetts
| City | Hong Kong | vs State | vs National | |
| 1. | Quincy | 1,112 | 8,536(13.03%)#1 | 239,302(0.46%)#25 |
| 2. | Boston | 1,104 | 8,536(12.93%)#2 | 239,302(0.46%)#26 |
| 3. | Newton | 556 | 8,536(6.51%)#3 | 239,302(0.23%)#63 |
| 4. | Braintree Town | 514 | 8,536(6.02%)#4 | 239,302(0.21%)#65 |
| 5. | Lexington | 338 | 8,536(3.96%)#5 | 239,302(0.14%)#93 |
| 6. | Brookline | 308 | 8,536(3.61%)#6 | 239,302(0.13%)#103 |
| 7. | Malden | 306 | 8,536(3.58%)#7 | 239,302(0.13%)#104 |
| 8. | Brockton | 263 | 8,536(3.08%)#8 | 239,302(0.11%)#114 |
| 9. | Cambridge | 229 | 8,536(2.68%)#9 | 239,302(0.10%)#131 |
| 10. | Framingham | 207 | 8,536(2.43%)#10 | 239,302(0.09%)#149 |
| 11. | Randolph Town | 158 | 8,536(1.85%)#11 | 239,302(0.07%)#192 |
| 12. | Needham | 150 | 8,536(1.76%)#12 | 239,302(0.06%)#201 |
| 13. | Wellesley | 132 | 8,536(1.55%)#13 | 239,302(0.06%)#226 |
| 14. | Stoneham | 129 | 8,536(1.51%)#14 | 239,302(0.05%)#234 |
| 15. | Milton | 126 | 8,536(1.48%)#15 | 239,302(0.05%)#240 |
| 16. | Arlington | 111 | 8,536(1.30%)#16 | 239,302(0.05%)#272 |
| 17. | Weymouth Town | 103 | 8,536(1.21%)#17 | 239,302(0.04%)#285 |
| 18. | Belmont | 103 | 8,536(1.21%)#18 | 239,302(0.04%)#286 |
| 19. | Waltham | 91 | 8,536(1.07%)#19 | 239,302(0.04%)#324 |
| 20. | Somerville | 86 | 8,536(1.01%)#20 | 239,302(0.04%)#342 |
| 21. | Watertown Town | 84 | 8,536(0.98%)#21 | 239,302(0.04%)#350 |
| 22. | Chelsea | 77 | 8,536(0.90%)#22 | 239,302(0.03%)#382 |
| 23. | Winchester | 76 | 8,536(0.89%)#23 | 239,302(0.03%)#387 |
| 24. | Norwood | 61 | 8,536(0.71%)#24 | 239,302(0.03%)#484 |
| 25. | Melrose | 54 | 8,536(0.63%)#25 | 239,302(0.02%)#530 |
| 26. | Abington | 51 | 8,536(0.60%)#26 | 239,302(0.02%)#552 |
| 27. | Hull | 49 | 8,536(0.57%)#27 | 239,302(0.02%)#570 |
| 28. | Cordaville | 48 | 8,536(0.56%)#28 | 239,302(0.02%)#586 |
| 29. | Wakefield | 45 | 8,536(0.53%)#29 | 239,302(0.02%)#619 |
| 30. | Leominster | 42 | 8,536(0.49%)#30 | 239,302(0.02%)#641 |
| 31. | Cochituate | 41 | 8,536(0.48%)#31 | 239,302(0.02%)#659 |
| 32. | Burlington | 40 | 8,536(0.47%)#32 | 239,302(0.02%)#668 |
| 33. | Medford | 38 | 8,536(0.45%)#33 | 239,302(0.02%)#687 |
| 34. | Lynn | 37 | 8,536(0.43%)#34 | 239,302(0.02%)#704 |
| 35. | Marlborough | 36 | 8,536(0.42%)#35 | 239,302(0.02%)#726 |
| 36. | Worcester | 29 | 8,536(0.34%)#36 | 239,302(0.01%)#847 |
| 37. | Revere | 28 | 8,536(0.33%)#37 | 239,302(0.01%)#868 |
| 38. | Amherst | 23 | 8,536(0.27%)#38 | 239,302(0.01%)#991 |
| 39. | Springfield | 20 | 8,536(0.23%)#39 | 239,302(0.01%)#1,067 |
| 40. | New Bedford | 19 | 8,536(0.22%)#40 | 239,302(0.01%)#1,095 |
| 41. | Saugus | 18 | 8,536(0.21%)#41 | 239,302(0.01%)#1,143 |
| 42. | Northampton | 17 | 8,536(0.20%)#42 | 239,302(0.01%)#1,177 |
| 43. | Everett | 16 | 8,536(0.19%)#43 | 239,302(0.01%)#1,217 |
| 44. | Gloucester | 16 | 8,536(0.19%)#44 | 239,302(0.01%)#1,223 |
| 45. | Danvers | 14 | 8,536(0.16%)#45 | 239,302(0.01%)#1,315 |
| 46. | Pinehurst | 14 | 8,536(0.16%)#46 | 239,302(0.01%)#1,343 |
| 47. | South Duxbury | 14 | 8,536(0.16%)#47 | 239,302(0.01%)#1,350 |
| 48. | Attleboro | 13 | 8,536(0.15%)#48 | 239,302(0.01%)#1,365 |
| 49. | Northborough | 13 | 8,536(0.15%)#49 | 239,302(0.01%)#1,393 |
| 50. | Raynham Center | 13 | 8,536(0.15%)#50 | 239,302(0.01%)#1,398 |
| 51. | Orleans | 13 | 8,536(0.15%)#51 | 239,302(0.01%)#1,403 |
| 52. | Nantucket | 12 | 8,536(0.14%)#52 | 239,302(0.01%)#1,430 |
| 53. | Andover | 12 | 8,536(0.14%)#53 | 239,302(0.01%)#1,434 |
| 54. | Groton | 12 | 8,536(0.14%)#54 | 239,302(0.01%)#1,452 |
| 55. | Salem | 11 | 8,536(0.13%)#55 | 239,302(0.00%)#1,464 |
| 56. | Agawam Town | 11 | 8,536(0.13%)#56 | 239,302(0.00%)#1,479 |
| 57. | East Brookfield | 11 | 8,536(0.13%)#57 | 239,302(0.00%)#1,517 |
| 58. | Lawrence | 10 | 8,536(0.12%)#58 | 239,302(0.00%)#1,527 |
| 59. | Sharon | 9 | 8,536(0.11%)#59 | 239,302(0.00%)#1,631 |
| 60. | Northwest Harwich | 8 | 8,536(0.09%)#60 | 239,302(0.00%)#1,694 |
| 61. | Reading | 6 | 8,536(0.07%)#61 | 239,302(0.00%)#1,801 |
| 62. | Longmeadow | 6 | 8,536(0.07%)#62 | 239,302(0.00%)#1,812 |
| 63. | Lowell | 5 | 8,536(0.06%)#63 | 239,302(0.00%)#1,851 |
| 64. | Milford | 2 | 8,536(0.02%)#64 | 239,302(0.00%)#1,972 |
| 65. | Barnstable Town | 1 | 8,536(0.01%)#65 | 239,302(0.00%)#2,012 |
Common Questions
What are the Top 10 Cities with the Most Immigrants from Hong Kong in Massachusetts?
Top 10 Cities with the Most Immigrants from Hong Kong in Massachusetts are:
#1
1,112
#2
1,104
#3
556
#4
514
#5
338
#6
308
#7
306
#8
263
#9
229
#10
207
What city has the Most Immigrants from Hong Kong in Massachusetts?
Quincy has the Most Immigrants from Hong Kong in Massachusetts with 1,112.
What is the Total Immigrants from Hong Kong in the State of Massachusetts?
Total Immigrants from Hong Kong in Massachusetts is 8,536.
What is the Total Immigrants from Hong Kong in the United States?
Total Immigrants from Hong Kong in the United States is 239,302.