Cities with the Highest Percentage of Households with Income Below $10,000 in Massachusetts
RELATED REPORTS & OPTIONS
Household Income | $0-10k
Massachusetts
Compare Cities
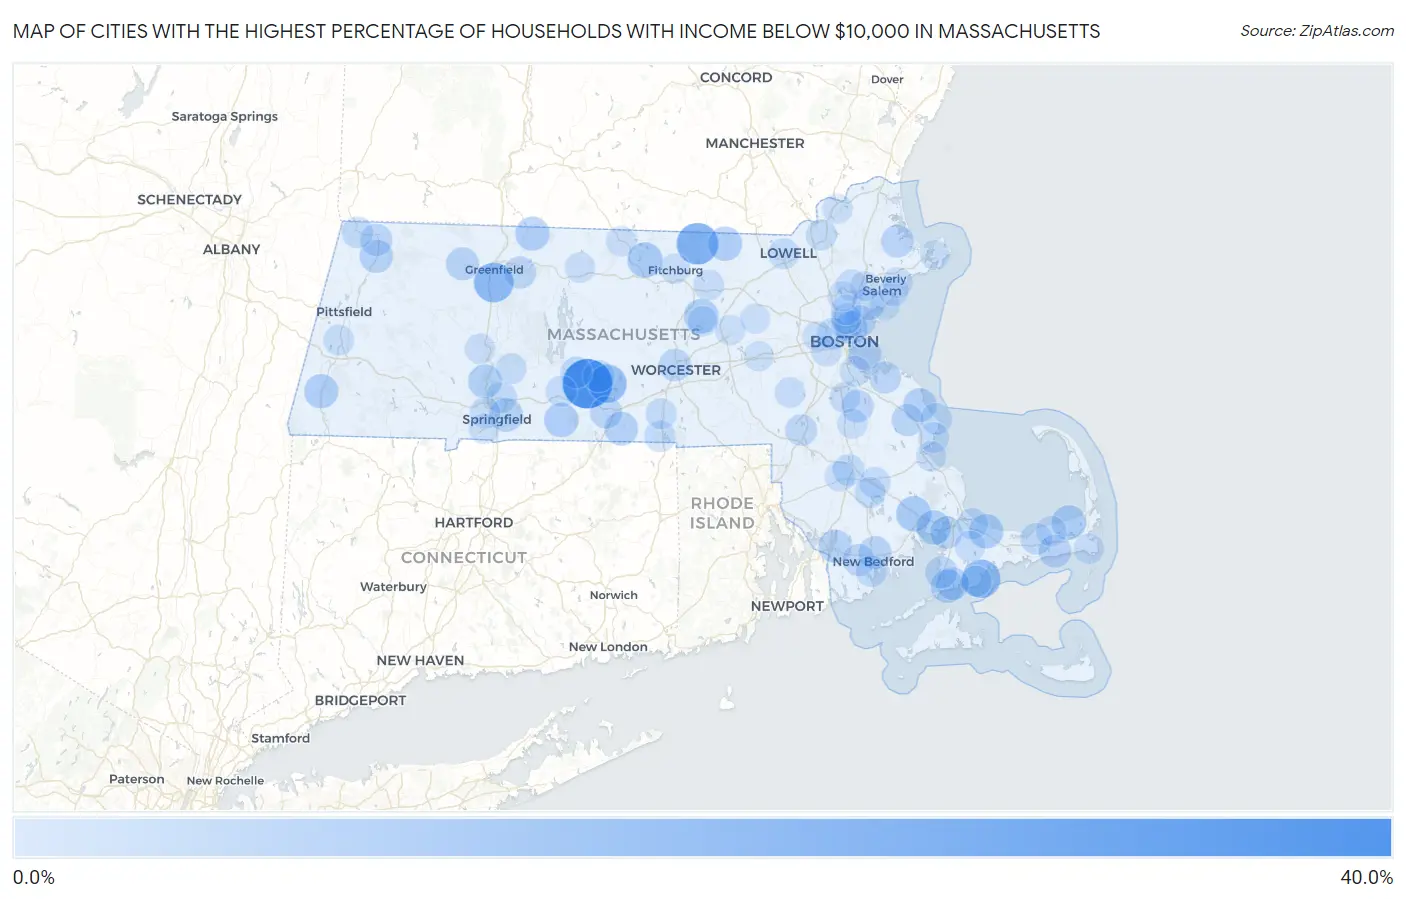
Map of Cities with the Highest Percentage of Households with Income Below $10,000 in Massachusetts
0.0%
40.0%
Cities with the Highest Percentage of Households with Income Below $10,000 in Massachusetts
| City | Households with Income < $10k | vs State | vs National | |
| 1. | Warren | 30.6% | 4.4%(+26.2)#1 | 4.9%(+25.7)#528 |
| 2. | Townsend | 19.5% | 4.4%(+15.1)#2 | 4.9%(+14.6)#1,280 |
| 3. | Deerfield | 16.9% | 4.4%(+12.5)#3 | 4.9%(+12.0)#1,673 |
| 4. | Popponesset | 15.3% | 4.4%(+10.9)#4 | 4.9%(+10.4)#2,034 |
| 5. | Brookfield | 14.8% | 4.4%(+10.4)#5 | 4.9%(+9.90)#2,155 |
| 6. | West Wareham | 10.8% | 4.4%(+6.40)#6 | 4.9%(+5.90)#3,857 |
| 7. | South Ashburnham | 10.8% | 4.4%(+6.40)#7 | 4.9%(+5.90)#3,869 |
| 8. | South Lancaster | 10.1% | 4.4%(+5.70)#8 | 4.9%(+5.20)#4,331 |
| 9. | Brewster | 10.0% | 4.4%(+5.60)#9 | 4.9%(+5.10)#4,386 |
| 10. | Onset | 9.9% | 4.4%(+5.50)#10 | 4.9%(+5.00)#4,465 |
| 11. | East Sandwich | 9.8% | 4.4%(+5.40)#11 | 4.9%(+4.90)#4,529 |
| 12. | Monson Center | 9.7% | 4.4%(+5.30)#12 | 4.9%(+4.80)#4,627 |
| 13. | Pepperell | 9.6% | 4.4%(+5.20)#13 | 4.9%(+4.70)#4,694 |
| 14. | Great Barrington | 9.4% | 4.4%(+5.00)#14 | 4.9%(+4.50)#4,862 |
| 15. | Northfield | 9.3% | 4.4%(+4.90)#15 | 4.9%(+4.40)#4,967 |
| 16. | Holyoke | 9.0% | 4.4%(+4.60)#16 | 4.9%(+4.10)#5,210 |
| 17. | Amherst | 8.8% | 4.4%(+4.40)#17 | 4.9%(+3.90)#5,414 |
| 18. | Southbridge Town | 8.8% | 4.4%(+4.40)#18 | 4.9%(+3.90)#5,422 |
| 19. | Marshfield Hills | 8.8% | 4.4%(+4.40)#19 | 4.9%(+3.90)#5,453 |
| 20. | Springfield | 8.7% | 4.4%(+4.30)#20 | 4.9%(+3.80)#5,528 |
| 21. | Falmouth | 8.5% | 4.4%(+4.10)#21 | 4.9%(+3.60)#5,782 |
| 22. | Adams | 8.4% | 4.4%(+4.00)#22 | 4.9%(+3.50)#5,895 |
| 23. | Fall River | 8.1% | 4.4%(+3.70)#23 | 4.9%(+3.20)#6,204 |
| 24. | Shelburne Falls | 8.1% | 4.4%(+3.70)#24 | 4.9%(+3.20)#6,256 |
| 25. | Boston | 8.0% | 4.4%(+3.60)#25 | 4.9%(+3.10)#6,319 |
| 26. | Chelsea | 7.7% | 4.4%(+3.30)#26 | 4.9%(+2.80)#6,701 |
| 27. | New Bedford | 7.5% | 4.4%(+3.10)#27 | 4.9%(+2.60)#6,995 |
| 28. | Dennis Port | 7.5% | 4.4%(+3.10)#28 | 4.9%(+2.60)#7,044 |
| 29. | Worcester | 7.4% | 4.4%(+3.00)#29 | 4.9%(+2.50)#7,148 |
| 30. | Ipswich | 7.4% | 4.4%(+3.00)#30 | 4.9%(+2.50)#7,186 |
| 31. | Teaticket | 7.3% | 4.4%(+2.90)#31 | 4.9%(+2.40)#7,359 |
| 32. | Holbrook | 7.1% | 4.4%(+2.70)#32 | 4.9%(+2.20)#7,613 |
| 33. | North Adams | 7.0% | 4.4%(+2.60)#33 | 4.9%(+2.10)#7,765 |
| 34. | Bourne | 7.0% | 4.4%(+2.60)#34 | 4.9%(+2.10)#7,807 |
| 35. | Lynn | 6.9% | 4.4%(+2.50)#35 | 4.9%(+2.00)#7,894 |
| 36. | Smith Mills | 6.9% | 4.4%(+2.50)#36 | 4.9%(+2.00)#7,930 |
| 37. | Fiskdale | 6.9% | 4.4%(+2.50)#37 | 4.9%(+2.00)#7,946 |
| 38. | Hingham | 6.8% | 4.4%(+2.40)#38 | 4.9%(+1.90)#8,093 |
| 39. | West Falmouth | 6.8% | 4.4%(+2.40)#39 | 4.9%(+1.90)#8,132 |
| 40. | North Pembroke | 6.7% | 4.4%(+2.30)#40 | 4.9%(+1.80)#8,279 |
| 41. | Millers Falls | 6.7% | 4.4%(+2.30)#41 | 4.9%(+1.80)#8,315 |
| 42. | Revere | 6.6% | 4.4%(+2.20)#42 | 4.9%(+1.70)#8,387 |
| 43. | West Brookfield | 6.5% | 4.4%(+2.10)#43 | 4.9%(+1.60)#8,616 |
| 44. | Foxborough | 6.4% | 4.4%(+2.00)#44 | 4.9%(+1.50)#8,750 |
| 45. | Ware | 6.4% | 4.4%(+2.00)#45 | 4.9%(+1.50)#8,751 |
| 46. | Yarmouth Port | 6.4% | 4.4%(+2.00)#46 | 4.9%(+1.50)#8,754 |
| 47. | Raynham Center | 6.1% | 4.4%(+1.70)#47 | 4.9%(+1.20)#9,291 |
| 48. | Ocean Bluff Brant Rock | 6.1% | 4.4%(+1.70)#48 | 4.9%(+1.20)#9,294 |
| 49. | Chicopee | 6.0% | 4.4%(+1.60)#49 | 4.9%(+1.10)#9,462 |
| 50. | Williamstown | 5.9% | 4.4%(+1.50)#50 | 4.9%(+1.00)#9,715 |
| 51. | Cambridge | 5.8% | 4.4%(+1.40)#51 | 4.9%(+0.900)#9,867 |
| 52. | Everett | 5.8% | 4.4%(+1.40)#52 | 4.9%(+0.900)#9,871 |
| 53. | Bliss Corner | 5.8% | 4.4%(+1.40)#53 | 4.9%(+0.900)#9,929 |
| 54. | Sandwich | 5.8% | 4.4%(+1.40)#54 | 4.9%(+0.900)#9,953 |
| 55. | Webster | 5.7% | 4.4%(+1.30)#55 | 4.9%(+0.800)#10,094 |
| 56. | Palmer Town | 5.6% | 4.4%(+1.20)#56 | 4.9%(+0.700)#10,314 |
| 57. | Lawrence | 5.5% | 4.4%(+1.10)#57 | 4.9%(+0.600)#10,511 |
| 58. | New Seabury | 5.5% | 4.4%(+1.10)#58 | 4.9%(+0.600)#10,662 |
| 59. | Lowell | 5.3% | 4.4%(+0.900)#59 | 4.9%(+0.400)#10,926 |
| 60. | Middleborough Center | 5.3% | 4.4%(+0.900)#60 | 4.9%(+0.400)#10,965 |
| 61. | Oxford | 5.3% | 4.4%(+0.900)#61 | 4.9%(+0.400)#10,981 |
| 62. | North Lakeville | 5.3% | 4.4%(+0.900)#62 | 4.9%(+0.400)#11,004 |
| 63. | West Springfield Town | 5.2% | 4.4%(+0.800)#63 | 4.9%(+0.300)#11,170 |
| 64. | Lynnfield | 5.2% | 4.4%(+0.800)#64 | 4.9%(+0.300)#11,199 |
| 65. | Duxbury | 5.2% | 4.4%(+0.800)#65 | 4.9%(+0.300)#11,289 |
| 66. | Forestdale | 5.1% | 4.4%(+0.700)#66 | 4.9%(+0.200)#11,485 |
| 67. | Granby | 5.1% | 4.4%(+0.700)#67 | 4.9%(+0.200)#11,542 |
| 68. | Malden | 5.0% | 4.4%(+0.600)#68 | 4.9%(+0.100)#11,649 |
| 69. | Randolph Town | 5.0% | 4.4%(+0.600)#69 | 4.9%(+0.100)#11,657 |
| 70. | Shirley | 5.0% | 4.4%(+0.600)#70 | 4.9%(+0.100)#11,794 |
| 71. | Quincy | 4.9% | 4.4%(+0.500)#71 | 4.9%(=0.000)#11,888 |
| 72. | Greenfield | 4.9% | 4.4%(+0.500)#72 | 4.9%(=0.000)#11,918 |
| 73. | Medfield | 4.9% | 4.4%(+0.500)#73 | 4.9%(=0.000)#11,948 |
| 74. | East Dennis | 4.9% | 4.4%(+0.500)#74 | 4.9%(=0.000)#11,970 |
| 75. | Lenox | 4.9% | 4.4%(+0.500)#75 | 4.9%(=0.000)#12,001 |
| 76. | Taunton | 4.8% | 4.4%(+0.400)#76 | 4.9%(-0.100)#12,125 |
| 77. | Beverly | 4.8% | 4.4%(+0.400)#77 | 4.9%(-0.100)#12,127 |
| 78. | Melrose | 4.8% | 4.4%(+0.400)#78 | 4.9%(-0.100)#12,133 |
| 79. | Athol | 4.8% | 4.4%(+0.400)#79 | 4.9%(-0.100)#12,170 |
| 80. | Swampscott | 4.7% | 4.4%(+0.300)#80 | 4.9%(-0.200)#12,424 |
| 81. | West Chatham | 4.7% | 4.4%(+0.300)#81 | 4.9%(-0.200)#12,532 |
| 82. | Brookline | 4.6% | 4.4%(+0.200)#82 | 4.9%(-0.300)#12,662 |
| 83. | Peabody | 4.6% | 4.4%(+0.200)#83 | 4.9%(-0.300)#12,665 |
| 84. | Winchendon | 4.6% | 4.4%(+0.200)#84 | 4.9%(-0.300)#12,744 |
| 85. | North Plymouth | 4.6% | 4.4%(+0.200)#85 | 4.9%(-0.300)#12,745 |
| 86. | Brockton | 4.5% | 4.4%(+0.100)#86 | 4.9%(-0.400)#12,898 |
| 87. | Fitchburg | 4.5% | 4.4%(+0.100)#87 | 4.9%(-0.400)#12,910 |
| 88. | Agawam Town | 4.5% | 4.4%(+0.100)#88 | 4.9%(-0.400)#12,917 |
| 89. | Northampton | 4.5% | 4.4%(+0.100)#89 | 4.9%(-0.400)#12,918 |
| 90. | Clinton | 4.5% | 4.4%(+0.100)#90 | 4.9%(-0.400)#12,978 |
| 91. | Oak Bluffs | 4.5% | 4.4%(+0.100)#91 | 4.9%(-0.400)#13,054 |
| 92. | Wakefield | 4.4% | 4.4%(=0.000)#92 | 4.9%(-0.500)#13,190 |
| 93. | Framingham | 4.3% | 4.4%(-0.100)#93 | 4.9%(-0.600)#13,417 |
| 94. | Haverhill | 4.3% | 4.4%(-0.100)#94 | 4.9%(-0.600)#13,420 |
| 95. | Salem | 4.3% | 4.4%(-0.100)#95 | 4.9%(-0.600)#13,430 |
| 96. | Hudson | 4.3% | 4.4%(-0.100)#96 | 4.9%(-0.600)#13,466 |
| 97. | Maynard | 4.3% | 4.4%(-0.100)#97 | 4.9%(-0.600)#13,479 |
| 98. | Watertown Town | 4.2% | 4.4%(-0.200)#98 | 4.9%(-0.700)#13,734 |
| 99. | Gloucester | 4.2% | 4.4%(-0.200)#99 | 4.9%(-0.700)#13,736 |
| 100. | Green Harbor | 4.2% | 4.4%(-0.200)#100 | 4.9%(-0.700)#13,886 |
Common Questions
What are the Top 10 Cities with the Highest Percentage of Households with Income Below $10,000 in Massachusetts?
Top 10 Cities with the Highest Percentage of Households with Income Below $10,000 in Massachusetts are:
#1
30.6%
#2
19.5%
#3
16.9%
#4
15.3%
#5
14.8%
#6
10.8%
#7
10.8%
#8
10.1%
#9
10.0%
#10
9.9%
What city has the Highest Percentage of Households with Income Below $10,000 in Massachusetts?
Warren has the Highest Percentage of Households with Income Below $10,000 in Massachusetts with 30.6%.
What is the Percentage of Households with Income Below $10,000 in the State of Massachusetts?
Percentage of Households with Income Below $10,000 in Massachusetts is 4.4%.
What is the Percentage of Households with Income Below $10,000 in the United States?
Percentage of Households with Income Below $10,000 in the United States is 4.9%.